Correlation & Regression
Scatter Plots
Scatter plot is a graph of ordered pairs (x, y) of numbers consisting of the independent variable, x, and the dependent variable, y.
Relationships
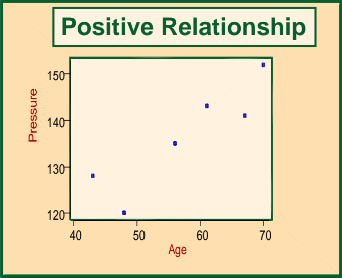
Positive relationship: If the points cluster in a band running from lower left to upper right, there is a positive correlation.
If x increases, y increases and if x decreases, y decreases.
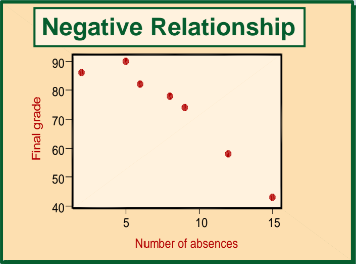
Negative relationship: If the points cluster in a band from upper left to lower right, there is a negative correlation.
If x increases, y decreases and if x decreases, y increases.
The more the points cluster closely around the imaginary line of best fit, the stronger the relationship between the two variables.
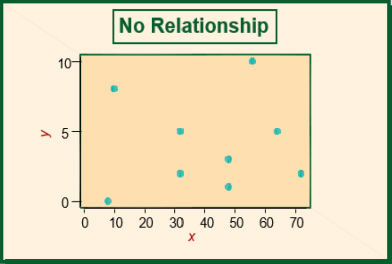
No Relationship: If it is hard to see where you would draw a line, and if the points show no significant clustering, there is probably no correlation.
Illustrations
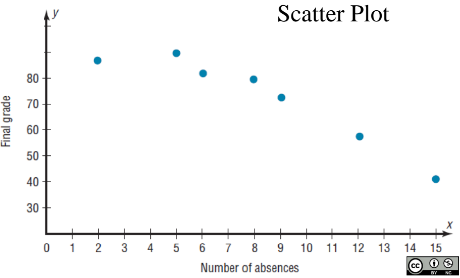
Problem1: Construct a scatter plot for the data obtained in a study on the number of absences and the final grades of seven randomly selected students from a statistics class.
- Based on the scatter plot, there is a negative relationship between the number of absences and the final grade.
Correlation Coefficient
The correlation coefficient measures the strength and direction of a relationship between two variables.
Sample correlation coefficient, r.
Population correlation coefficient, ρ.
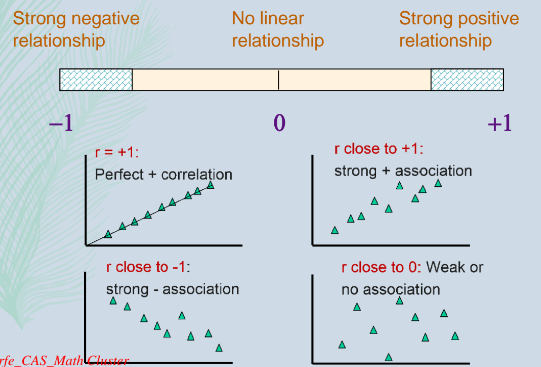
Range of values for the correlation coefficient:
-1: Strong negative relationship
+1: Strong positive relationship
0: No linear relationship
Illustration
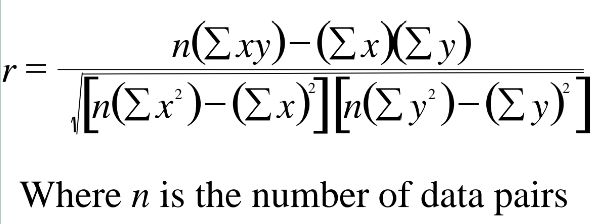
Formula for the correlation coefficient (r):
Problem1: Compute the correlation coefficient of the data obtained in a study on
the number of absences and the final grades of seven randomly selected students from a statistics class. The data are shown here.
Solution: Find the values of xy, x2, and y2; place these values in the corresponding columns of the table. n=7 (number of data pairs).
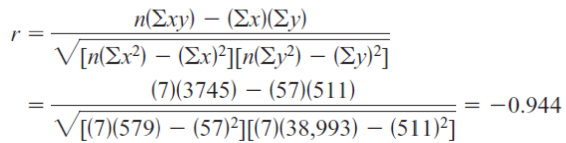
Substitute in the formula and solve for r.
The value of r is close to -1 which means that there is a strong negative relationship between a student’s final grade and the number of absences a student has. That is, the more absences a student has, the lower is his or her grade.
The Significance of the Correlation Coefficient
The population correlation coefficient, ρ, is the correlation between all possible pairs of data values (x,y) taken from a population.
In hypothesis testing, there are two possibilities:
H: p = 0 (null hypothesis)
No correlation between the x and y variables in the population.
H: P ≠ 0 (alternative hypothesis)
Significant correlation between the variables in the population.
The significance of the correlation coefficient is determined by rejecting or not rejecting the null hypothesis.
Illustration
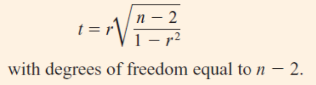
Formula for the t Test for the Correlation Coefficient:
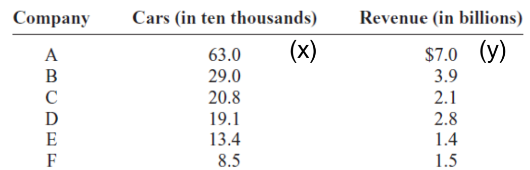
Problem1: The data shown for car rental companies in the United States for a recent year. Test the significance of the correlation coefficient. Use α=0.05
Given: α=0.05, n=6, df=n-2=4, r=0.9819798097
Step 1: State the hypothesis.
H0: ρ = 0
H1: ρ ≠ 0 (two-tailed test)
Step 2: Find the critical value given α=0.05 and df=4
CV= ± 2.776
Step 3: Compute the test value.
Given: n=6, r=0.9819798097
TV=10.4
Step 4: Make the decision.
H0: Reject
H1: Do not reject since TV falls in the critical region
Step 5: Summarize the results.
There is significant relationship between between the number of cars a rental agency owns and its annual income.
Linear Regression
Regression is an approach for modeling the relationship between a dependent variable y and an independent variable x.
Regression line is called the line of best fit.
The equation of the line is y' = a + bx.
Illustration
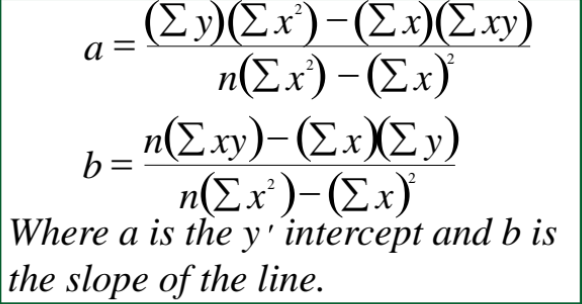
Formulas for the Regression Line: y = a + bx
Problem1: Data obtained in a study on the number of absences and final grades of seven randomly selected students from a statistics class
Goal:
A. Find the equation of the regression line for the data
B. predict the final grade of a student with 10 absences
Solution:
A. Find the values of xy and x2; place these values in the corresponding columns of the table. n=7 (number of data pairs)
Substitute in the formula and solve for a and b
B. Predict the final grade (y’) if the number of absences (x) is 10.
The equation of the regression line is given by
y’ = 102.493 – 3.622x.
So we have,
y’ = 102.493 – 3.622 (10)
y’ = 66.273
Thus, the predicted final grade of a student with 10 absences is 66.273.
Coefficient of Determination
The coefficient of determination (r2) is a measure of the variation of the dependent variable explained by the regression line and the independent variable
r2 is the square of the correlation coefficient
Illustration
If r = 0.90, then r2 = 0.81 (coefficient of determination)
The coefficient of non-determination is (1 - r2)
If r = 0.90, then 1 - r2 = 0.19 (coefficient of non-determination)