S2 Research methods - 1
Introduction central tendency z-scores
Schedule:
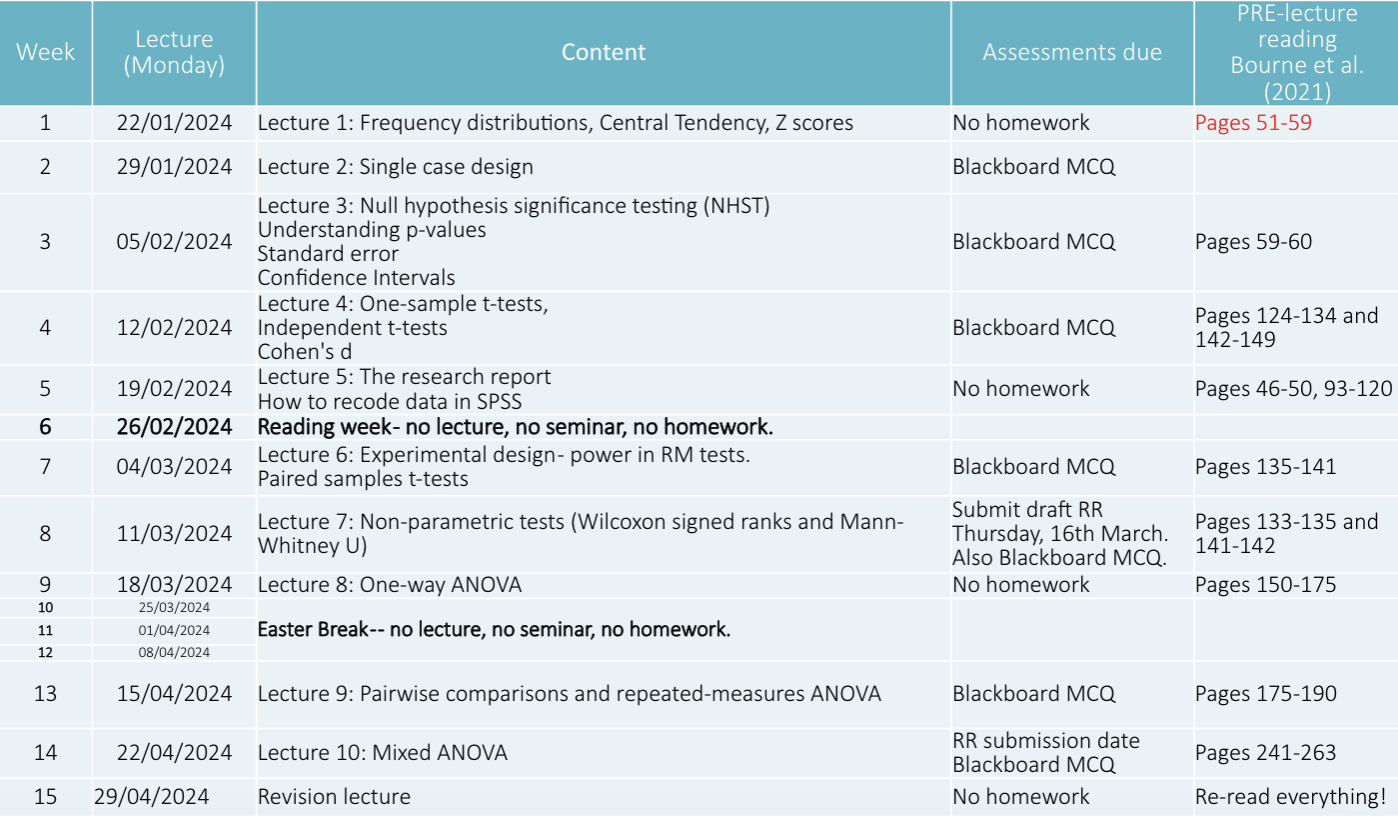
Lecture 1:
- Frequency distributions
- Normal (gaussian) distribution
- Central tendency
- Z Scores
Frequency distributions - describe the pattern of observations in a data set
E.g how many times does each observation appear in my dataset?
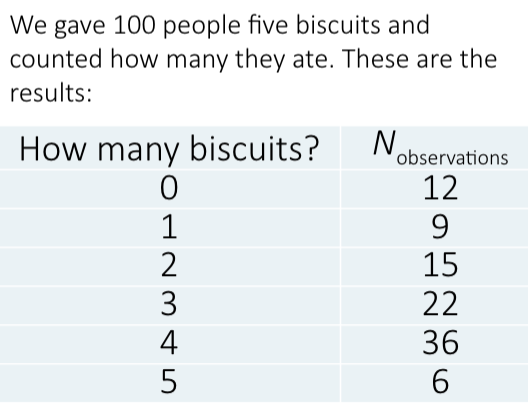
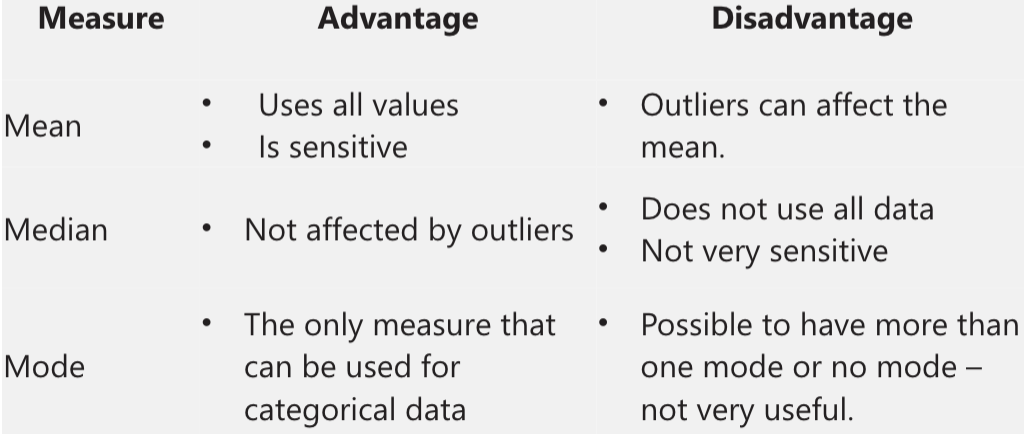
Central tendency - a value that represents the typical average or centra; value in a dataset
Mean: sum of all data points divided by number of observations
Mean = sum of all data/number of data points (∑/n)
Median: middle data vale when assorted from ascending to descending order
Mode: data value that occur with the greatest frequency
In a perfect distribution the mean, median and mode are the same value
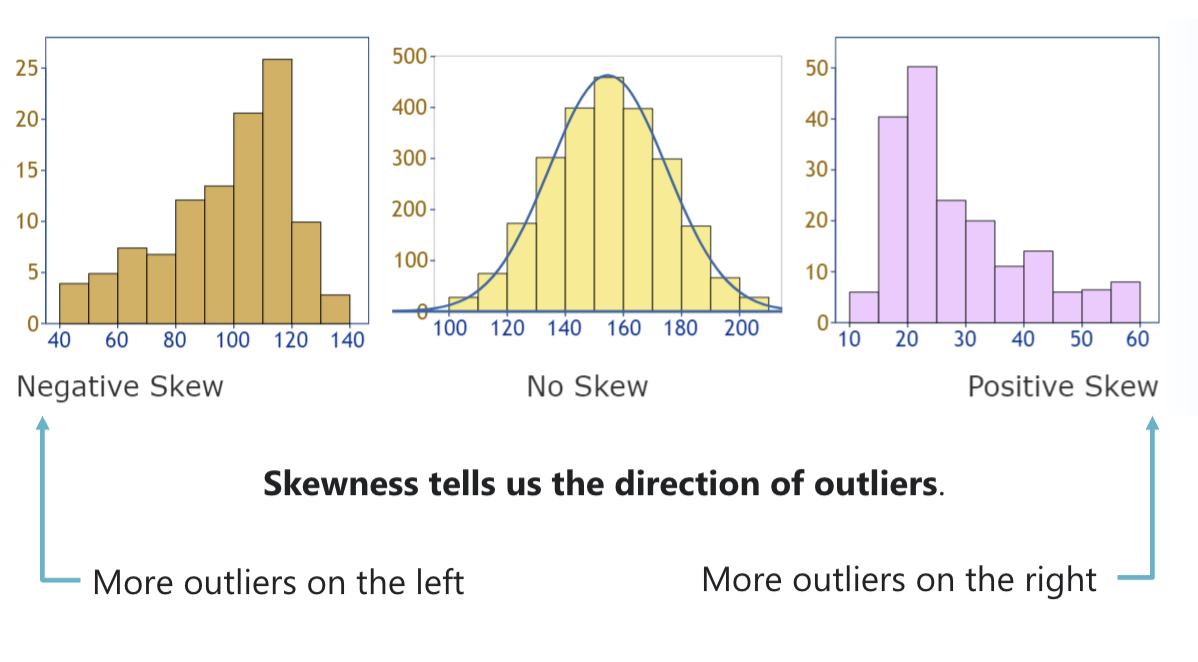
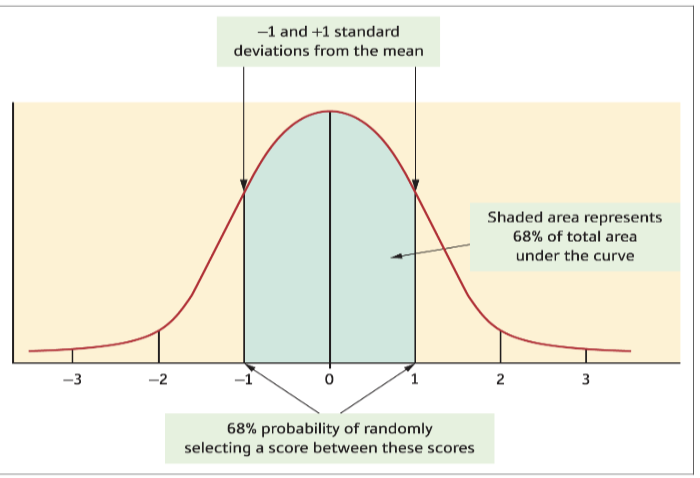
Normal distribution
- Symmetrical
- Unimodal
- Mean, median and mode at the centre of peak
- 68% of scores fall between 1 SD and 95% between 2SD
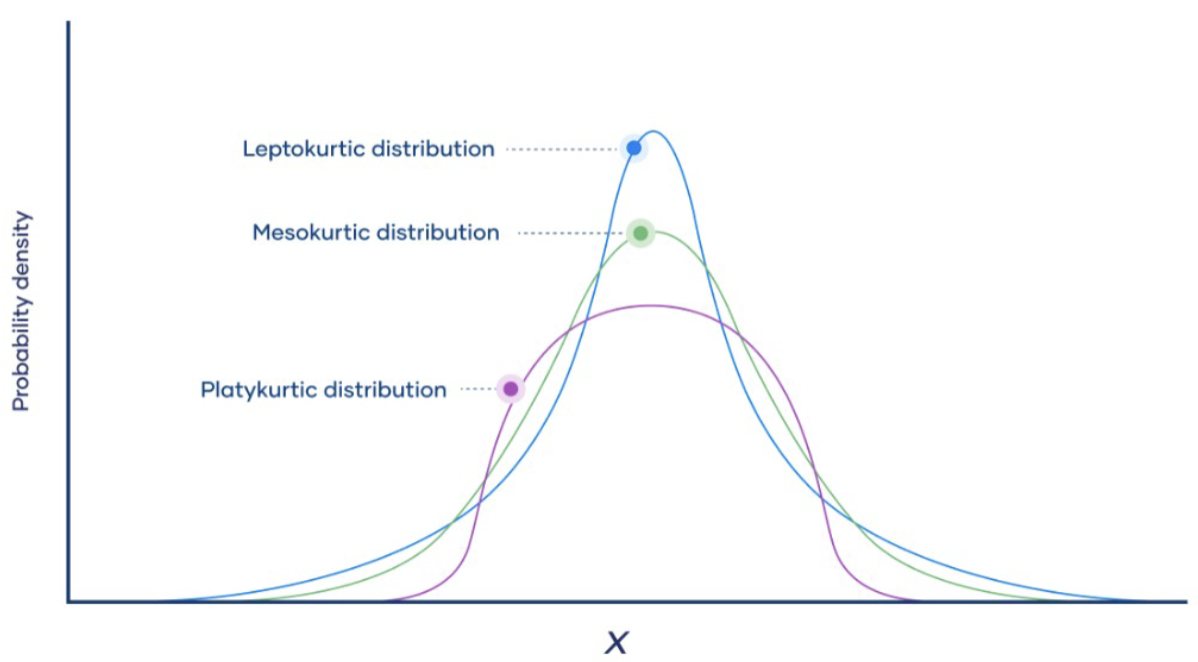
Kurtosis
Collective intelligence
- Vox populi (galton, 1970)
- Guess the weight of the ox
- 787 guesses of experts and non experts
- Mean guess - 1207
- Real weight - 1198
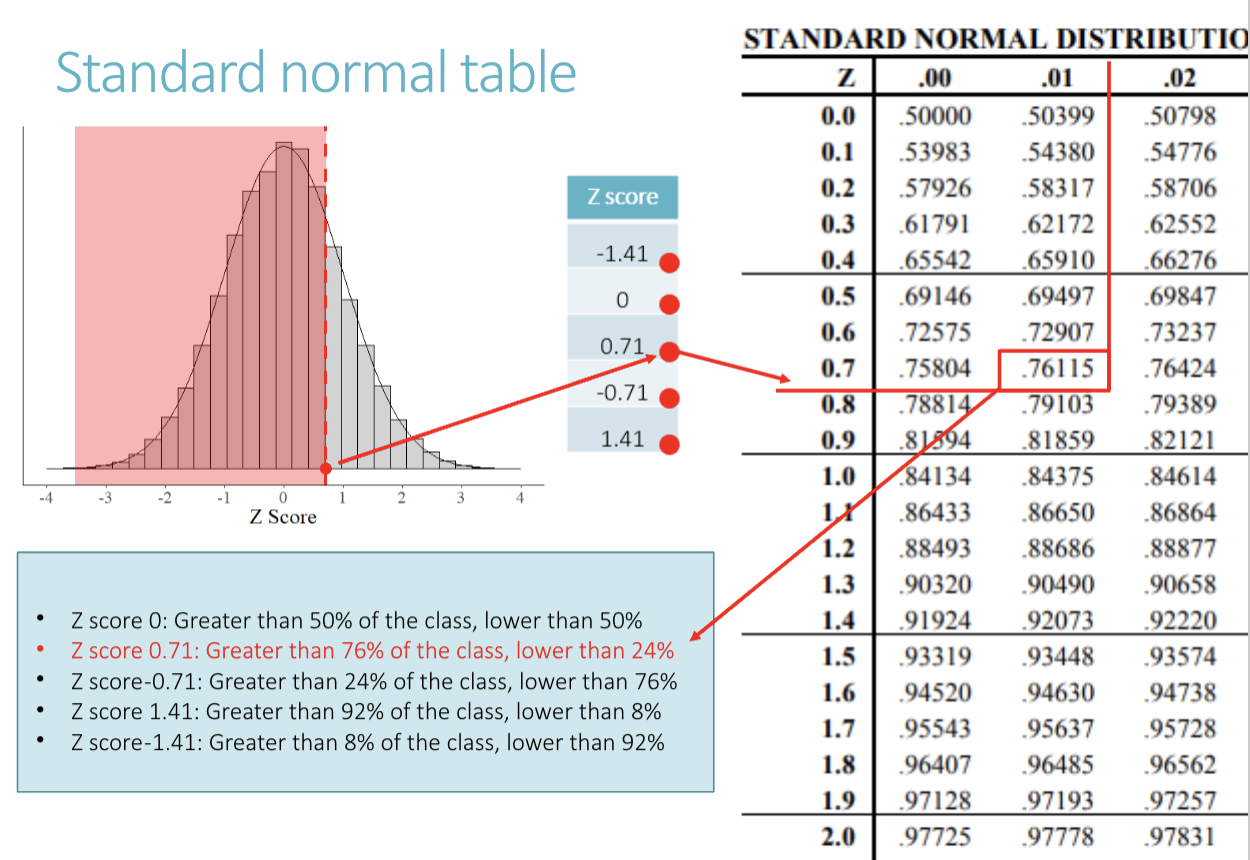
Z-scores (standard scores)
Z score- Standard normal distribution : the same as the normal distribution but always has a mean of zero and SD of 1)
- 68% scores within +/- 1SD
- 95% scores within +/- 2 SD
- 99.7 Scores within +/- 3SD
Z scores are standardised scores - a group of data points transformed to have a mean of 0 and a SD of 1 just like the standard normal distribution
A Z score is expressed in standard deviation units
- Z score of 1 is 1SD above the mean
- Z score of -1 is 1SD below the mean
X | M | X-M | SD | Z score |
|---|---|---|---|---|
2 | 4 | -2 | 1.41 | -1.41 |
4 | 4 | 0 | 1.41 | 0 |
5 | 4 | 1 | 1.41 | 0.71 |
3 | 4 | -1 | 1.41 | -0.71 |
6 | 4 | 2 | 1.41 | 1.41 |
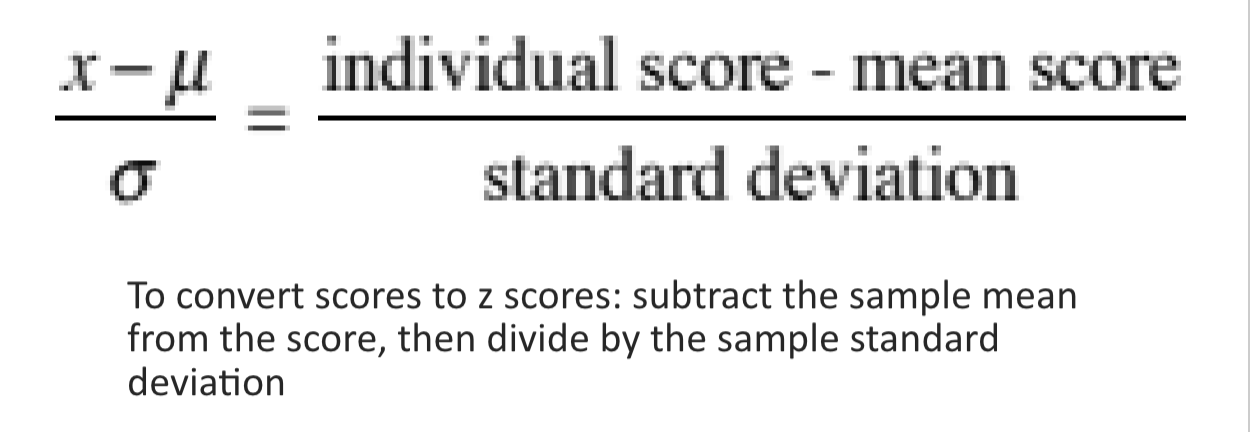
𝘟−𝝻/𝞂 = Individual score-mean score/standard deviation
M=20/5=4
SD=1.41
Using Z score
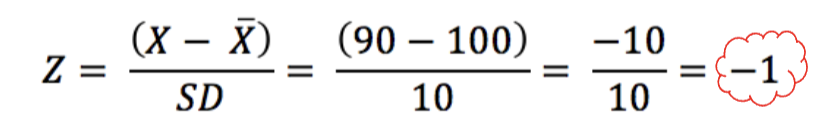
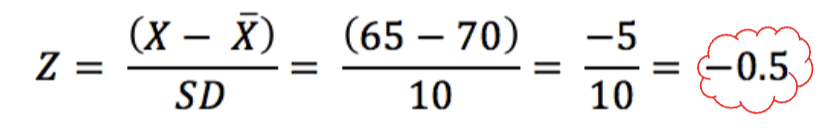
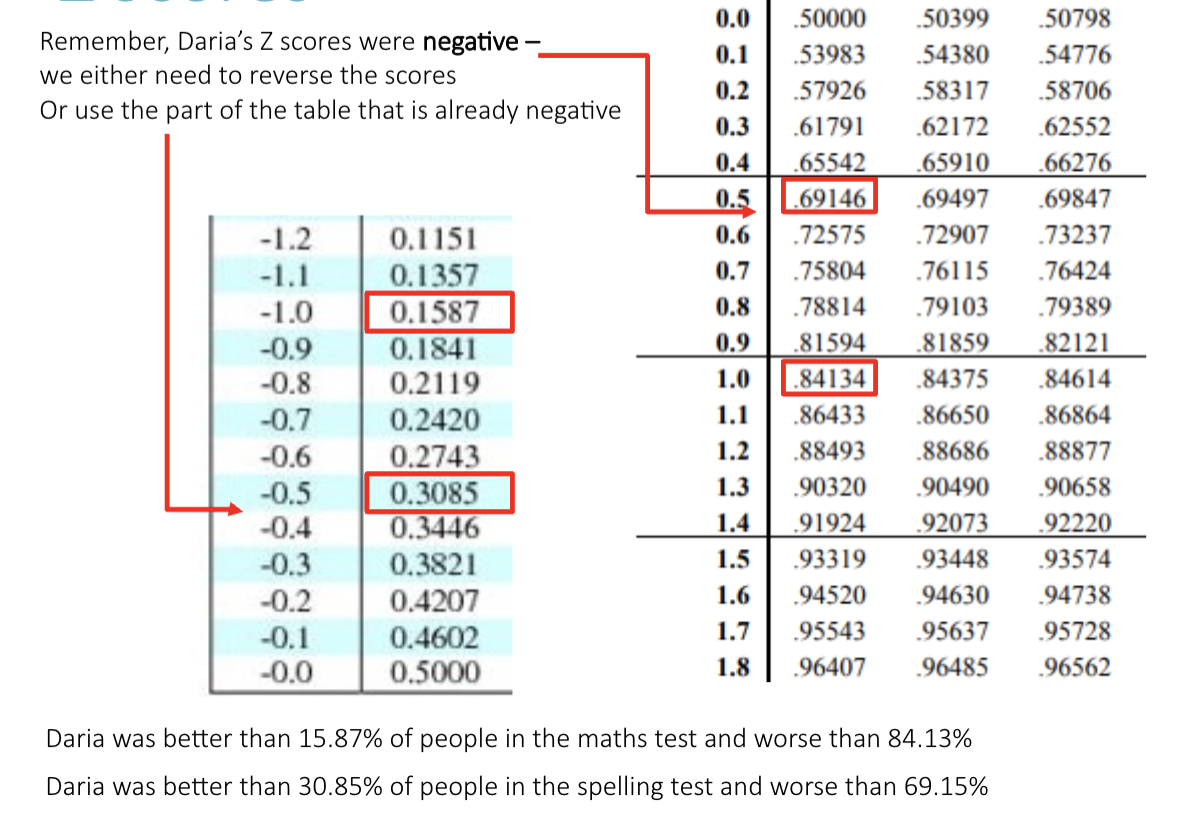
Daria scored 90 on a maths test and 65 on a spelling test did she perform better at maths or spelling to compare her score in these 2 tests we need to standardise the units, so we convert the scores to Z scores (expressed in SD Units)
Overall class distributions
Maths test: mean=100 and SD =10
Spelling test: mean=70 and SD=10
Maths test: mean=100, SD=10, Score of 90
Spelling test; mean =70, SD=10, Score of 65
Important values of Z scores
A Z score of 1.96 is the cutt off for the top 2.5% of the distribution
Z score of -1.96 is the cut off for the bottom 2.5% of the distribution
Together they amount to 5% of the distribution
So 95% of the z scores lie between -1.96 and 1.96
We say that ‘95% of scores lie between +/- 2SD. That's just because it's easier to remember we are rounding for brevity. The exact figure is +/- 1.96SD
Finding raw scores from Z scores
X = 𝝻 + Z𝞂
- X - Raw score, individual score or test results
- 𝝻 - the mean
- Z - z score
- 𝞂 - the SD
Multiply the Z score by the SD then add the mean
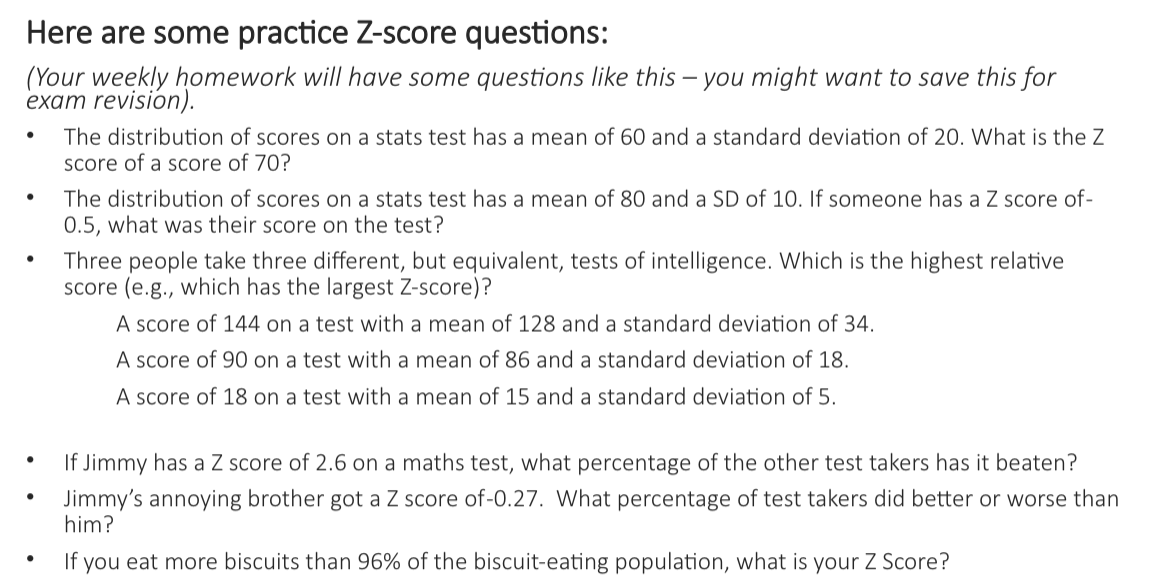
Things to do:
- Weekly homework
- Reading - bourne ‘starting out in methods and statistics for psychology 51-59 -> 283-317
Revision guide
- What is a frequency distribution
- What does a normal distribution look like whats its properties
- Why do we care about distribution of data
- What is central tendency
- What are the 3 common measures of central tendency
- Properties of Z scores
- Why do we love them so much (aka how do you use them)
- How do you calculate a z score (what's the mformula)
Assessments
- Final exam (40%)
- Research report (35%)
- Weekly homeworks (20% total)
- Sona (5%)