7. Serial Visual Field Analysis
Serial Visual Field Analysis
Visual field tests are inherently variable due to patient factors such as distraction and inattentiveness.
There is high disagreement about whether a patient’s visual field loss is progressing, especially in glaucoma.
Computer-assisted analysis programs have been developed to improve assessment of progression by correcting the “noise” and data variability.
Trend-based analysis techniques assess the rate of change in the visual field over time.
For most progression analyses, a minimum of four to five field tests in a series is required to identify progression; more tests are needed for reliable trend-based analysis.
Glaucoma Progression Analysis (GPA)
GPA is implemented on the Humphrey Field Analyzer (HFA).
Uses pattern deviation plots from SITA Standard or SITA Fast to correct for developing cataracts and pupil effects.
GPA identifies significant pointwise progression based on statistical probabilities using at least 3 sequential visual fields.
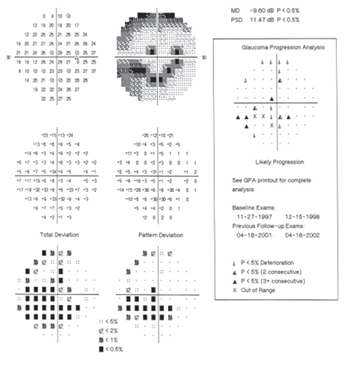
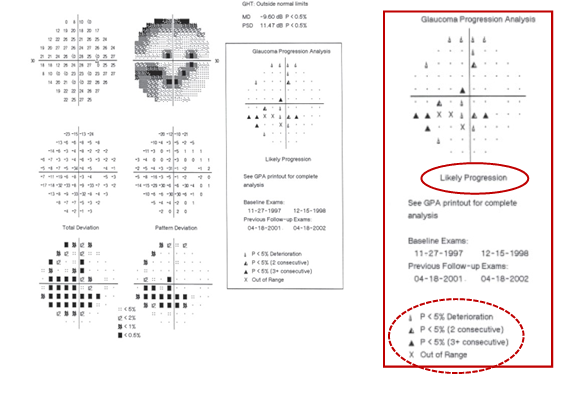
GPA Alerts
No progression detected
Possible progression
3 or more test points show statistically significant deterioration on 2 consecutive follow-up tests
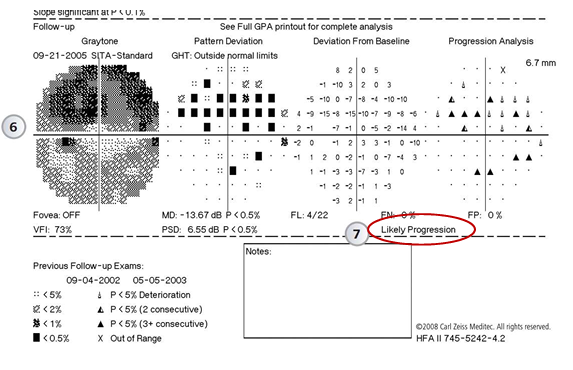
Likely progression
3 or more test points show statistically significant deterioration on at least 3 consecutive follow-up tests
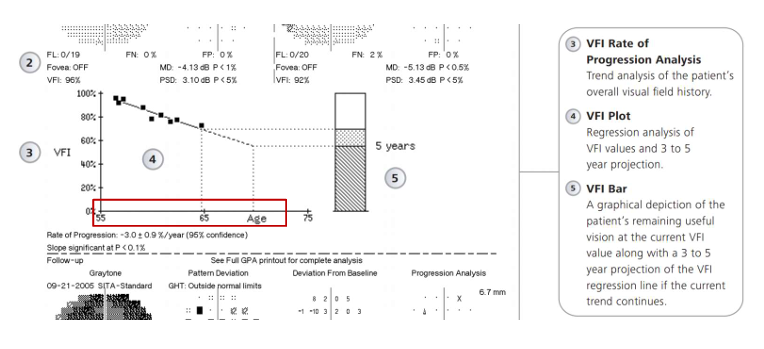
Visual Field Indices and Trend Analysis
Visual Field Index (VFI): a trend-based global index that summarizes remaining visual field function.
Range: 1% to 100% with 100% representing a perfect age-adjusted visual field.
Central VF points are weighted more heavily in calculating the percentage of visual field loss.
VFI is derived from an aggregate percentage of visual function, using pattern or total deviations depending on depth of loss.
minimum of five examinations over 3 years are needed to calculate VFI
VFI interpretation nuances:
Higher weight on central field points
VFI plotted against age to assess clinical significance of progression rate
VFI progression can be accompanied by a regression line and a 3–5 year projection in GPA trend analyses
Minimum Examinations and Age-plots
Minimum of five examinations required over 3 years for reliable trend-based evaluation.
All VFI values from the examinations are plotted as a function of patient’s age to aid interpretation of the rate and clinical significance of progression.
Rate of Progression and Trend Plots
GPA trend analysis provides a global rate of change for the patient’s visual function, represented by the VFI trend and the overall MD/PSD trajectory.
Example rate values from the GPA visuals:
Example rate:
Slope significance criterion: P < 0.1\% for slope significance
The rate of progression is illustrated with a regression line on the VFI plot and a 3–5 year projection of VFI if the current trend continues.
Visual Field Interpretation Workflow
Confirm patient and examination parameters (DOB, refractive correction, test pattern).
Assess whether the VF plot can be trusted:
Review reliability indices, test artefacts, and determine if the test should be repeated.
Scan across all sections of the printout:
Threshold values, Total Deviation, Pattern Deviation, MD, PSD, VFI, GPA,Cluster Analysis.
Describe the VF defect:
Depth (Shallow-Deep), Pattern (Diffuse-Localised), Location.
Integrate findings into a clinical interpretation considering trend data and GPA classifications.