Descriptives
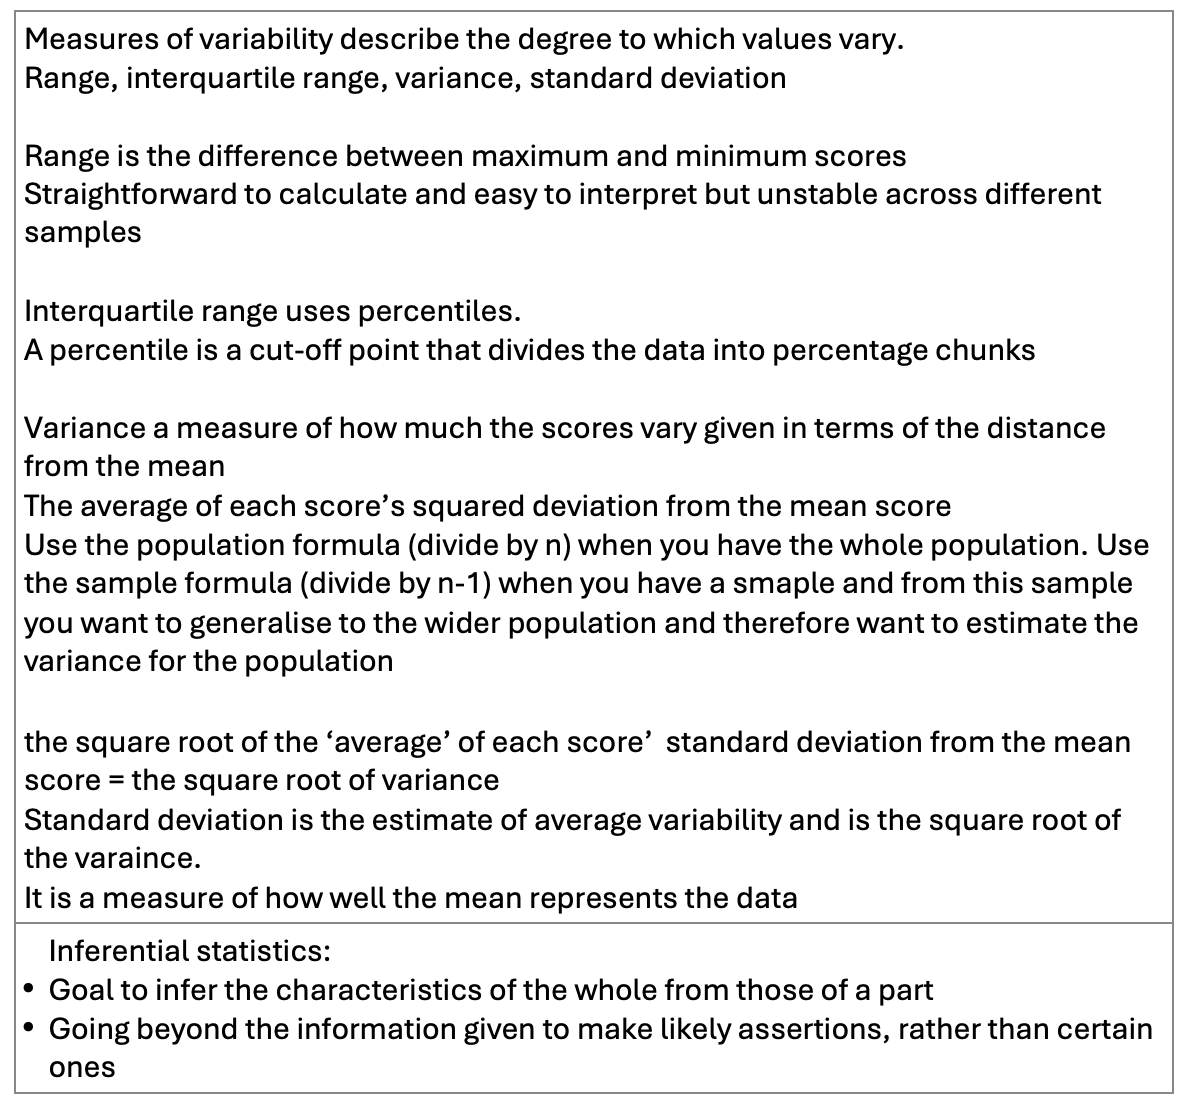
Types of data: measurement (quantitative) and categorical (qualitative) |
Types of scales: Nominal – categorical data reflect label for categories Ordinal – orders people/objects/events along some continuum (various rankings). No information is given about differences between points on the scale Interval – equal intervals between objects represent equal differences Ratio scales – have a true zero point. A true zero point corresponds to the absense of the thing being measured. |
|
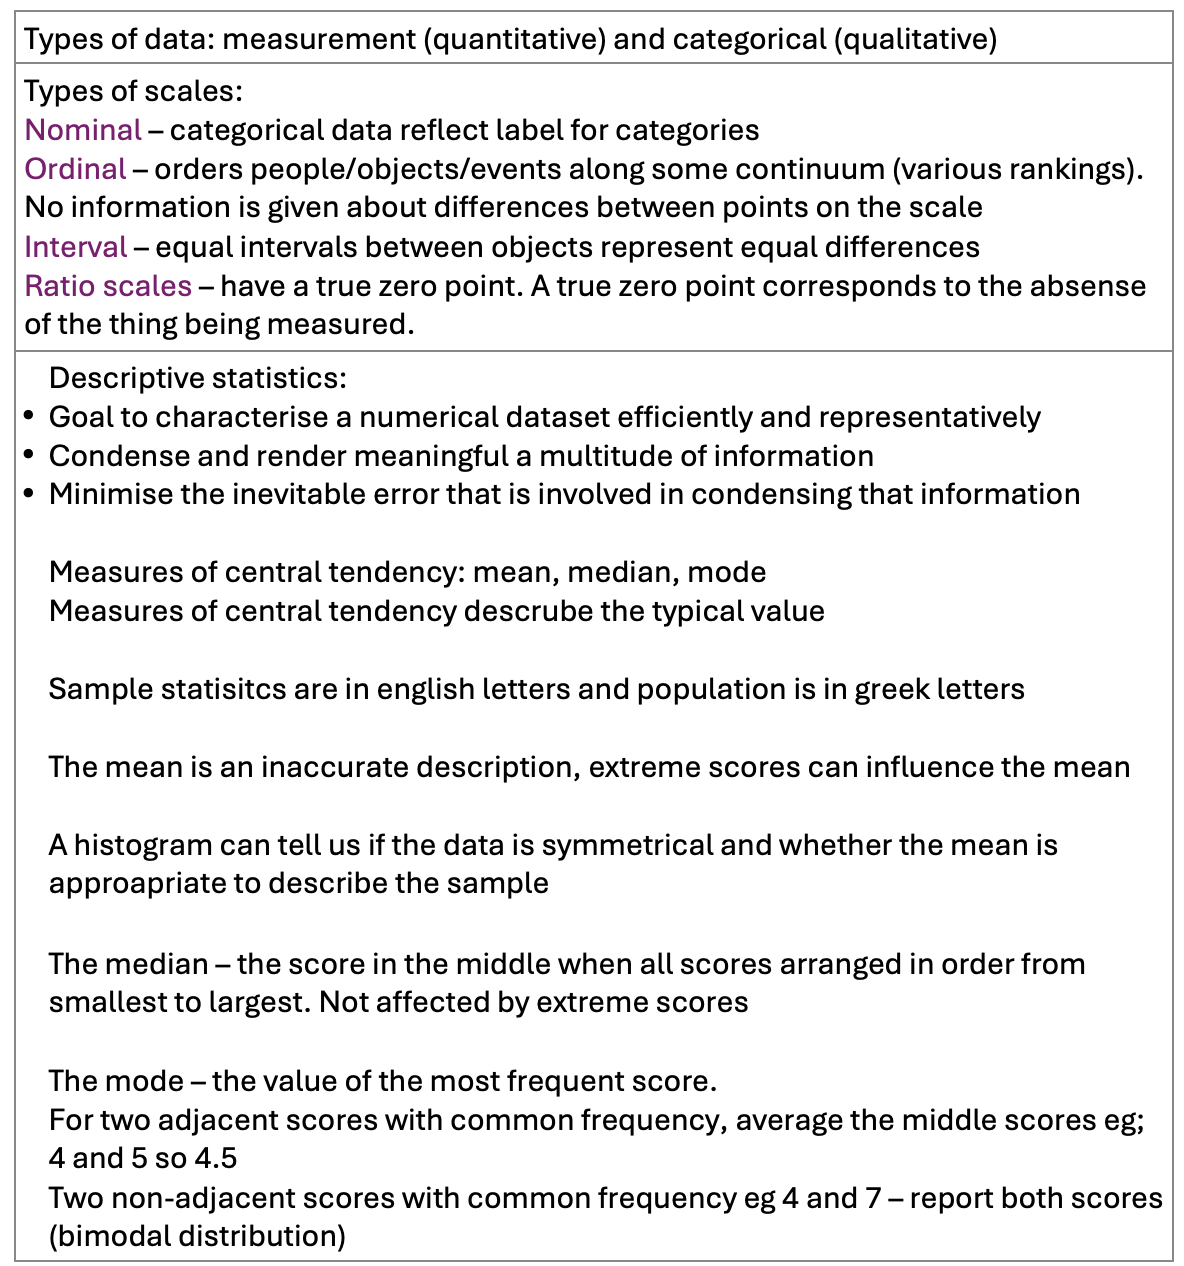
Measures of variability describe the degree to which values vary. Range, interquartile range, variance, standard deviation
Range is the difference between maximum and minimum scores Straightforward to calculate and easy to interpret but unstable across different samples
Interquartile range uses percentiles. A percentile is a cut-off point that divides the data into percentage chunks
Variance a measure of how much the scores vary given in terms of the distance from the mean The average of each score’s squared deviation from the mean score Use the population formula (divide by n) when you have the whole population. Use the sample formula (divide by n-1) when you have a smaple and from this sample you want to generalise to the wider population and therefore want to estimate the variance for the population
the square root of the ‘average’ of each score’ standard deviation from the mean score = the square root of variance Standard deviation is the estimate of average variability and is the square root of the varaince. It is a measure of how well the mean represents the data |
|