UNIT 2.1: baby making factory
IN CLASS NOTES (scroll for reading quiz)
midlatitudes: most ppl live in the regions between 30N and 60N bc of moderate climate
low lying areas: better soil for raising crops, close to ocean, ease of transportation, sources of food, temp
fresh water: rivers, lakes, oceans (for crops and transport too)
Human factors that influence pop:
transportation networks
politics
culture
SCALE OF ANALYSIS
deterrents: pollution, government, social stratification
ecumene: the portion of earths surface occupied by permanent settlement
east asia: ¼ of the worlds pop live here (eastern china, japan, korean peninsula, taiwan)
½ of the ppl in china work as farmers in rural areas
south asia: ¼ of the worlds ppl (india, pakistan, bangladesh, sri lanka)
most of the pop is concentrated in the plains of indus ganges rivers
europe: ¾ of europe’s pop live in cities, fewer than 5% are farmers
highest concentration near major rivers, coalfields (germany, belgium) and historic capitals
southeast asia: abt 600 mil ppl live here (mostly in the islands that lie between the indian and pacific oceans)
most work as farmers in rural areas
other:
africa has two clusters of abt 300 mill one (one on the west coast of from senegal to nigeria and one on the east coast from Eritrea and south africa)
northeastern us and southeastern canada (abt 100 mill ppl from boston to va)
POPULATION DENSITY
arithmetic pop density
most commonly used
calc by dividing a regions prop by total area
says little abt pop dist. it is simply an average num of ppl, doesn’t indicate where the live
physiological pop density
calc by dividing pop by the amt of arable land
a large diff between arithmetic and physiological density indicates that a small percentage of a regions land is capable of growing crops
carrying capacity: the pop of a regions can support w/o significant environmental deterioration
countries w high physiological densities face extra challenges feeding their populations!
agricultural pop density: compares the num of farmers to the area of arable land
it gives an indication of the efficiency of the regions farmers
developed countries have lower agricultural densities bc farmers use tech to produce large quantities of food w few workers
Economic, social, political processes- most economic decisions are based partly on pop dist and density
redistricting: boundaries change every ten yrs or so as pop changes
overpopulation: having more ppl than a region can support (can’t hold the carry capacity)
time:
density does change by time of yr (and even time of day)
“snowbirds”= places like fl become more dense each winter from ppl in northern states who flee cold weather
manhattan: abt 1.5 mill ppl live there but each weekday the num rises 3 mill once commuters get to work
infrastructure and urban services:
infrastructure: providing services (sewers, water, policing) is actually more cost effective in high density areas
labor costs of installing sewer pipes is the same for small towns vs large city
POPULATION COMPOSITION:
composition: language, religion, ethnicity, age, and sex
ethnicity: members of ethnic groups (including immigrants and religion groups) tend to cluster within regions cities, neighborhoods
age: age of the members in a region shape public policy
young= public school funding
old=services for seniors
sex: differences in a gender balance
population pyramid: also called age-sex composition graphs (bc they are only based on age & sex)
follow same structure- vertical axis shows age groups (called cohorts normally listed in the middle). male pop on left, female on right
scale can vary, but normally country
determining trends:
a wide base that tapers upward shows a growing pop
nearly symmetrical=balanced
population distribution: the pattern of human settlement- the spread of ppl across the each (rep it on a map highlights places that are crowded, sparsely settled, or even empty)
pop density: a measure of the avg pop per mile² or km² (measure of how crowded a place is)
midlatitudes: the regions between 30 and 60 deg
low lying areas:
other factors:
most ppl live near lakes/rivers for irrigation, drinking water, transportation, and food
low pop densities are also found in tropics where disease runs rampant and poor soil quality
ppl prefer to live near trade routes (so, paths created by rivers/roads/etc prive a linear pathway for housing)
political decisions sometimes bring small pops to isolated location
elevation matters, even within cities
ex: coastal California has a very large population compared to the desert and mountain regions of the interior. On a larger or local scale, such as a city, the spatial climate variation is usually too small to affect settlement.
many ppl are attracted to cities, despite pollution concerns, due to economic opportunities.
on a local lvl, few ppl intentionally choose to settle near a pollution source (unless there is a lower price factor involved)
social stratification: hierarchical division of ppl into groups based on factors such as economic status, power, &/ ethnicity
arithmetic pop density: calc by dividing the regions pop by total area
says little abt pop dist
(doesn’t indicate where ppl live)
physiological pop density: calc by dividing pop by the amt of arable land
carrying capacity: the pop it can support without significant environmental deterioration
high carrying capacity= high need for crop yields
agricultural pop density: number of farmers vs the area of arable land
redistricting: due to urban areas are continuing to increase in pop and the pop of rural areas is usually shrinking there need to be boundary adjustments every ten years (as required by the constitution)
infrastructure: the facilities and structures that allows ppl to carry out their typical activities
influence of time: the carrying capacity of a region can change over time due to things like tech changes in agriculture or climate changes
influence on cities: ppl have always chosen places with the greatest carrying capacity
significance of density:
high pop density= environmental problems/depletion of resources
POPULATION COMPOSITION
age & sex: dist patterns are related to age and sex of the pop- some regions of a country may have a younger or older avg pop than others
sometimes the difference is so significant that it shapes public policy
ex: Officials in Utah have a higher percentage of school-age children for which to provide services.
differences in the gender balance can result from warsm migrations, and govt policies
ex: mining towns and military training facilities have have significantly more males than females
age-sex composition graph/pop pyramid:
vertical axis shows age groups (cohorts), listed in the middle usually
pyramids usually show the male pop on the left and the female pop on the right
values on horizontal axis may be % or absolute numbers of pop
mostly constructed at country scale, but can be scaled smaller
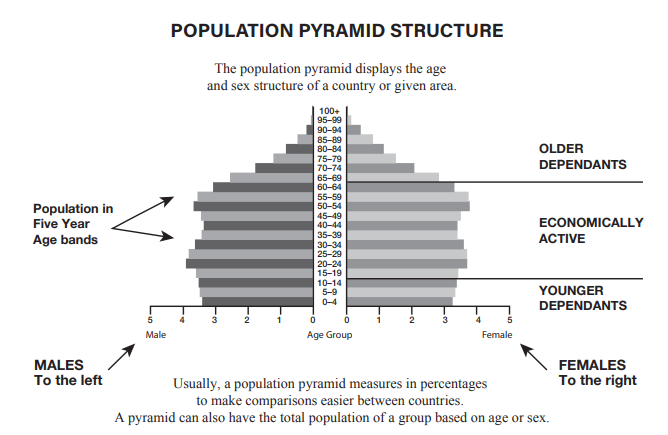
if a pop pyramid has a wide base and tapers upward=pop is growing
indicates large families
war: the clearest effect is that ppl are killed
half+ deaths in wartime are civilians, and those deaths affect ppl of all ages
during war, men and women are often separated, and even if they stay together they may decide to delay a family until the war ends
result: bars are often significantly shorter than the bars above or below them
birth deficit: slowdown of births
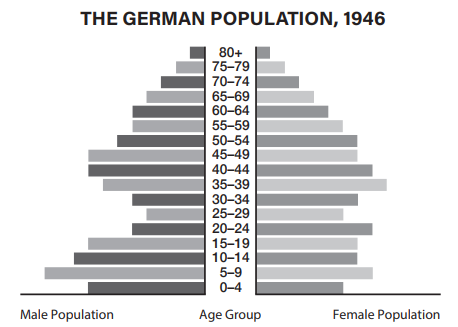
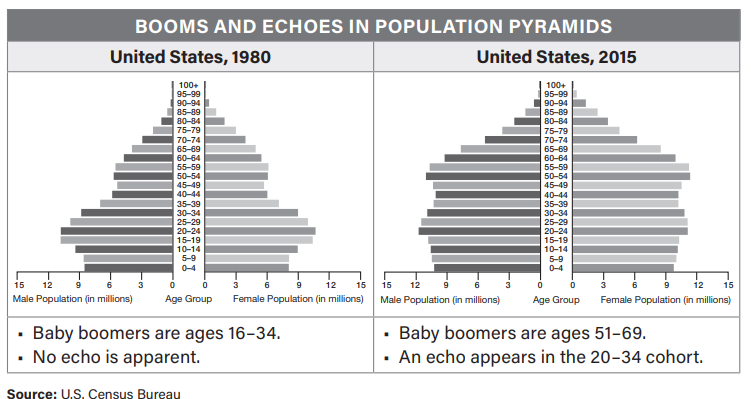
baby boom: birth rate spike, often associated w either the end of a war or economic abundance
baby bust: once the boom ends, the birth rates are lower for a number of yrs
echo: With a high number of boomers in the population having children, there can be a significant increase in births that shows up as a bulge on a pyramid- reflects a an earlier boom
patterns:
Bars are longer for people ages 18 to 25 than for people younger or older
A small city with a large university causes an increase of this age group.
A shortage of school funding causes families to move away when they have children.
bars are longer for ppl ages 25-30 than for children
An economic crisis causes people to decide to have fewer children.
A government policy to slow population growth discourages births.
An epidemic causes many infants to die.
bars are longer for ppl over the age of 65
A community in a warm climate attracts retirees.
A lack of jobs causes young people to move away.
bars are longer for males than females
An oil boom or fishing industry attracts people for jobs that are traditionally done by men.
A region contains a military base or prison that may have a larger percentage of men
bars are longer for females than males
A neighborhood contains a large assisted living home with a high percentage of females who typically outlive males.
potential workforce: ppl ages 15-64, the group expected to be the society’s labor force
dependant population: ppl under 15 or over 64, bc they are considered too old/young to work full time and are assumed to rely on the economically active workforce to keep running.
dependency ratio: the comparison between the size of the two groups
EQ 1: What are the factors that influence population distribution and what are the impacts of different methods used to calculate population density?
Factors that can influence population density are elevation, and people. Generally speaking, people prefer lower elevations because they are closer to water sources that provide transport, drinking water, and food. Higher elevations are further away from these resources, and have hasher, colder climates. People are also factors in this- once we build cities, more people keep coming for job opportunities. There’s two ways to calculate population: arithmetically and physiologically. Arithmetic pop density is calculated by dividing the region’s population by total area, but it doesn’t show population distribution (where people live). physiological population density is calculated by dividing the population by the amount of arable land, which gives a better look at population distribution, but still isn’t a perfect measure.
EQ 2: How do population distribution and density affect society and the environment?
in sparsely dense areas, the environment tends to be relatively untouched because of the lack people to use the natural resources. Compare this to densely populated areas where people create concrete jungles, and leave massive carbon footprints. There, the pollution is higher, so the health of the people is much worse. People also tend to crowd near water sources, which then leads to water pollution and overfishing is the population gets big enough. Highly dense areas need more human resources as well: emergency services, education, plumbing, and people to keep the city running. But this brings in the concept of carrying capacity, which is the population places can support without significant environmental deterioration. High carrying capacity signifies a high need for crop yield, or importation.
EQ 3: What are elements of population composition, and how are those elements used by geographers to depict and analyze population composition?
Age and sex are the two elements of population composition. Differences in these elements can show trends and significant events within the region. Differences in age cohorts can suggest wars, outbreaks, economic crises, or lack of infrastructure built into the area. Geographers visualize this data by putting it into an age-sex composition graph. Divots in the graph can mean a significant population decreasing event has happened, while bulges in the graph can mean a baby boom. They can also analyze trends of the region’s population, such as signs of birth deficits or an emerging population.
Think like a geographer:
that the US is less densely populated than the average density of the world
If you take the scale of the state of Utah, you can claim to have low population density, but if you look even closer, like Salt Lake City, it’s very densely populated.
Multiple Choice:
Which generalization is best illustrated by the world map above?
C, since you can roughly estimate where 20N and 60N is, and then compare to see that the generalization mostly fits.
Based on the map, which area is most densely populated?
A, since almost the entire region is between 128-256+ range, which can’t be seen anywhere else
According to the table, which country has a greater need for increased
crop yields and imported foods and why?
C, since the high arithmetic and physiological densities indicate there a large population that needs to be able to feed themselves, demanding more crop yields/imports
Which of the following can be concluded from the data in the table?
D, since we are given that country B’s arable land percentage is 16. 8, while A’s is 2.8.
Which country has the lowest arithmetic population density?
C, because australia has mostly hot, desert land that is almost intolerable for humans, leaving just the outskirts to be civilized. lots of land and comparatively little population.
Which might explain the asymmetrical aspect of the population
pyramid?
B, since the population spike is mostly for men in the working ages (from 15-64), though women also spike similarly, it is not as much.
Which statement about birth is best supported by the pyramid?
?? I’m not sure how to answer this since we’re only given a graph from 2016
FRQ
A: Describe the regional distribution of U.S. residents by median age.
the highest median ranges of age are in Montana, Maine area (including connecticut ☹ ), and Florida.
B: Explain why Florida has a relatively high median age compared to other states and its economic impact on the state of Florida.
Florida is mostly a warm place where older people can live for the colder months, which lasts very long in more northern states. This means that Florida’s government has to spend more on building old age homes and that it doesn’t have as much of a working population, which could possibly lead to some economic issues.
C: Explain ONE age-related issue that affects Texas more than Florida
Texas has to think and spend more on education for their young, and since Florida doesn’t have as many kids they’re not as concerned with that.
D:Identify the scale in which the data on the map is aggregated.
It is aggregated on a country wide scale, but each state has its borders and median age shown.
E: Using a specific location on the map, describe how changing the aggregated scale of the data could impact the patterns on the map
If you chose specifically from the state of Hawaii, the range of median ages would change, and there would be minimal/no information on the rest of the us
F: Using a specific location on the map, describe how changing the
aggregated scale of the data could impact the patterns on the map
If I were given a census of median age in the winter vs the summer for Florida, it would help to explain who leaves, who comes, and who stays. Therefore, I can then assume why so many older people live in florida.
G: Describe ONE additional specific qualitative data source, not shown
on the map, that would help explain the patterns on it.
seeing a migration map of the ages of people coming to and from where to where in the US during the year would help understand why they’re going there (such as places in texas have more job opportunities, so more young people keep moving in, but often it is too hot for older people so they could be moving out.)