2.3.1 The characteristics of AS
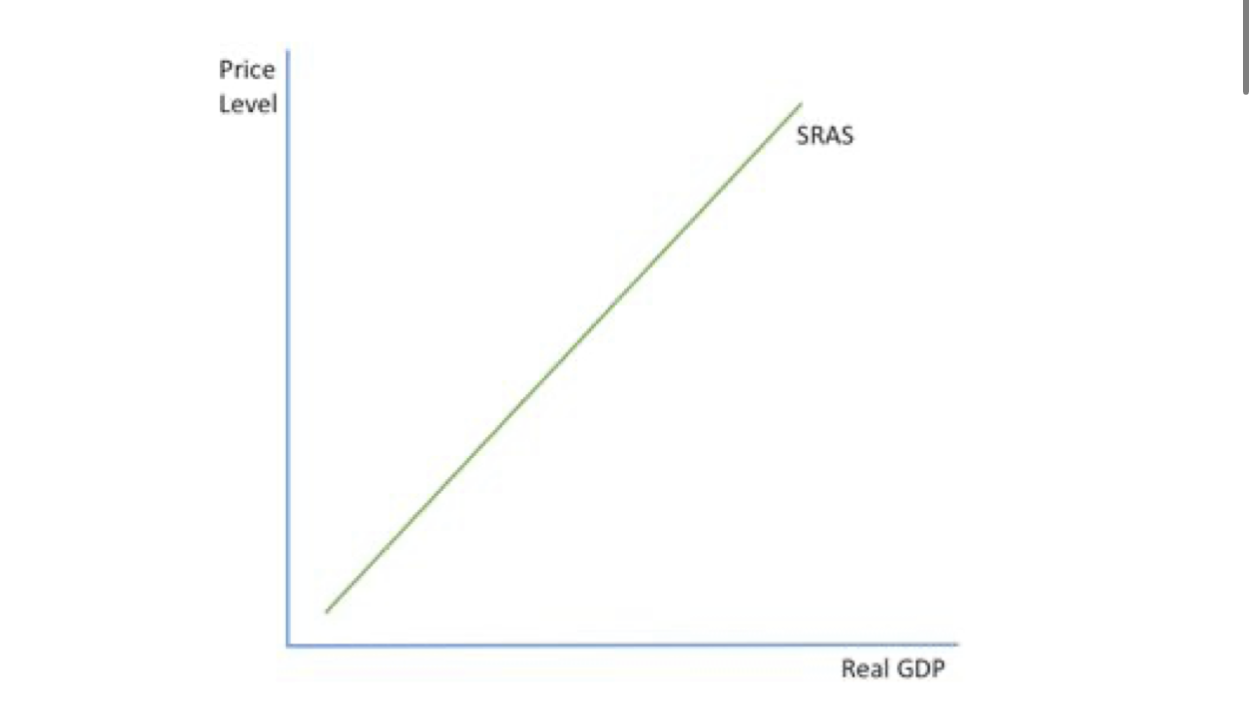
Aggregate supply is the volume of goods and services produced within the economy at a given price level. SRAS curve is upward sloping because at a higher price level, producers are willing to supply more because they can earn more profits. It indicates the ability of an economy to produce goods and services and shows the relationship between the real GDP and the average price levels .
Moving along the AS curve
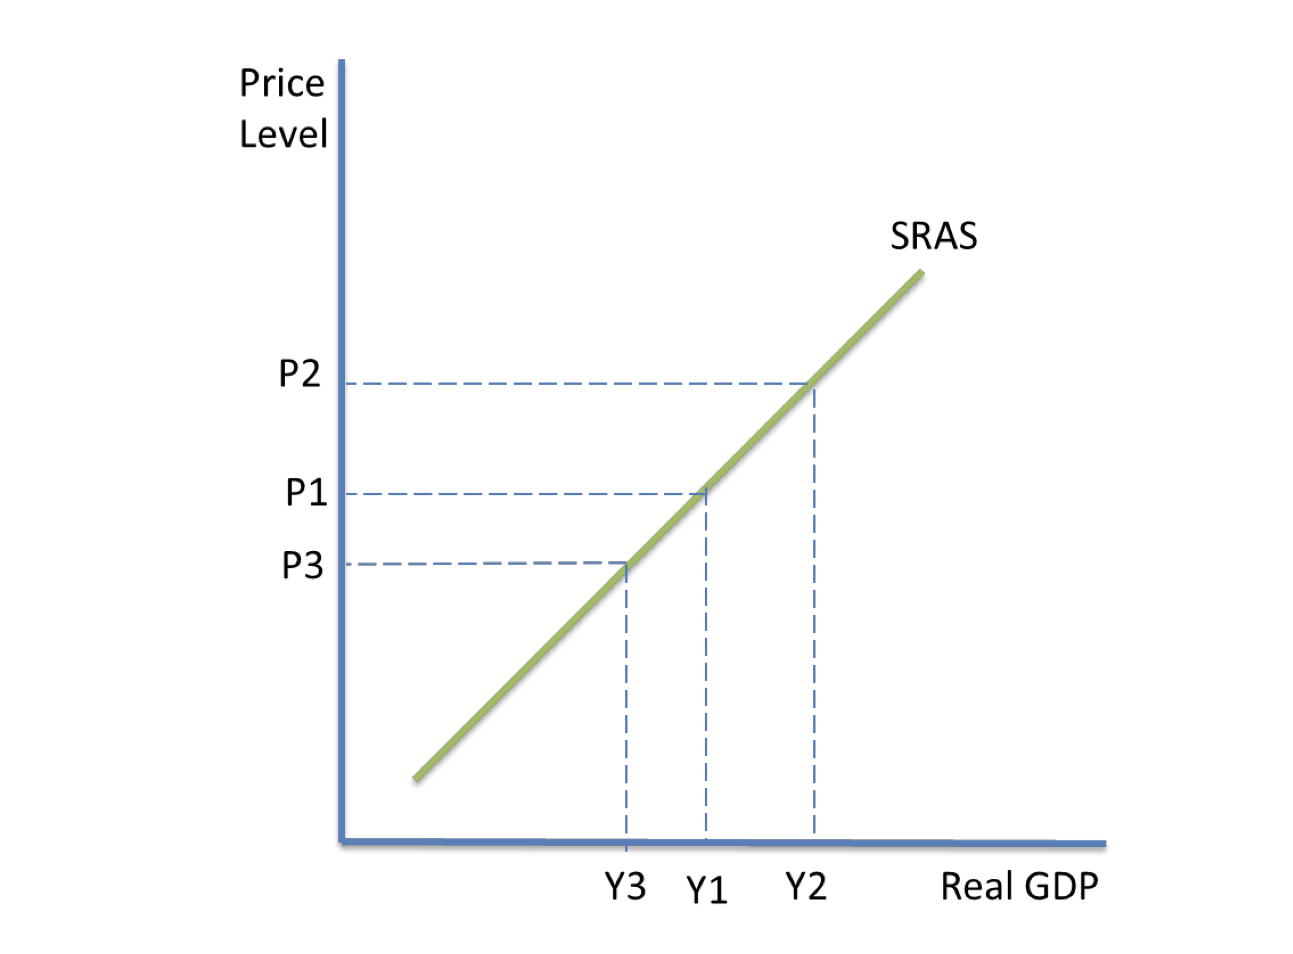
Only changes in the price level, which occur due to changes in AD, lead to movements along the AS curve.
If AD increases, there is an expansion in the SRAS, from Y1 to Y2. If AD falls, there is a contraction in SRAS, from Y1 to Y3.
Shifting the AS curve
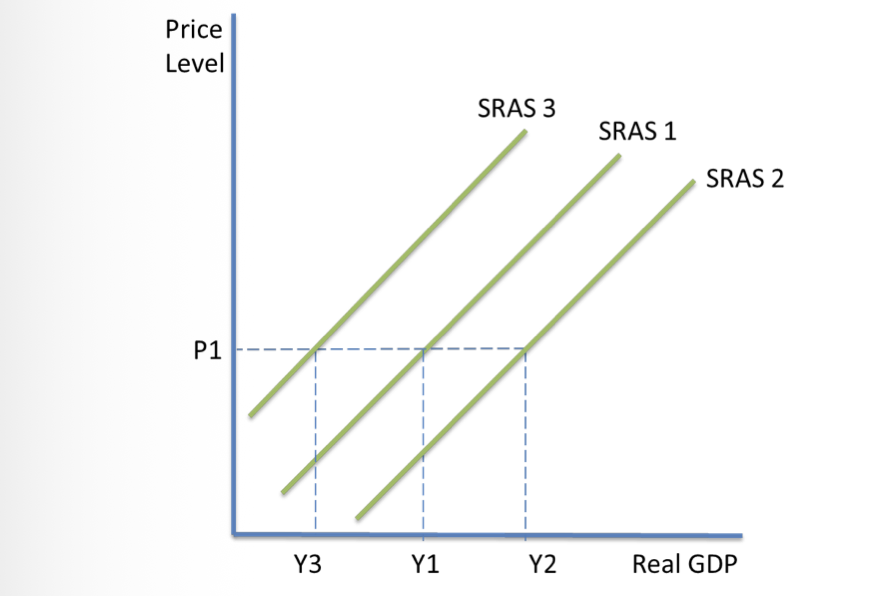
The SRAS curve shifts when there are changes in the conditions of supply, any of the factors which affect SRAS.
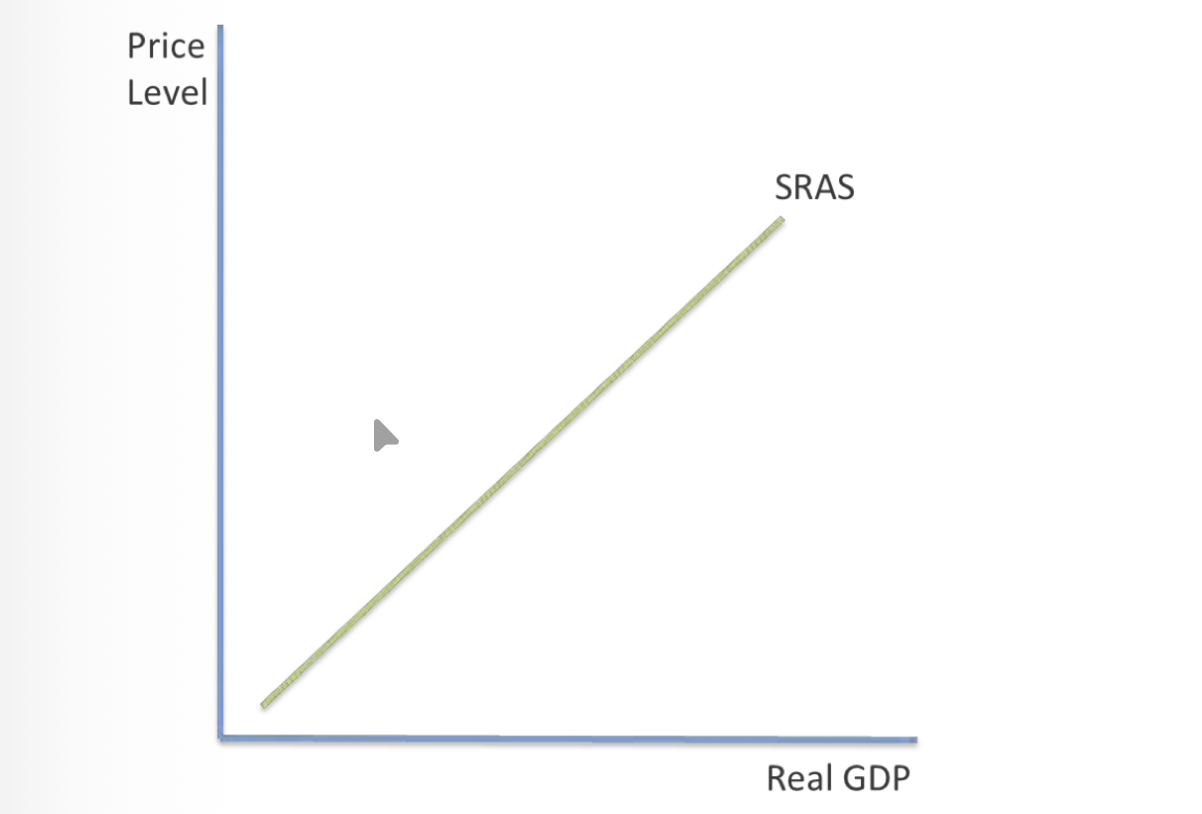
The relationship between short run AS and long run AS
The short run is the period of time when at least one factor of production is fixed, whilst in the long run all factors of production are variable.
The short run aggregate supply curve (SRAS) only covers the period immediately after a change in the price level. It shows the planned output of an economy when prices change, whilst the cost of production and productivity of the factor inputs are kept constant. A change in one of these will result in the shift of the curve.
Long run aggregate supply curve
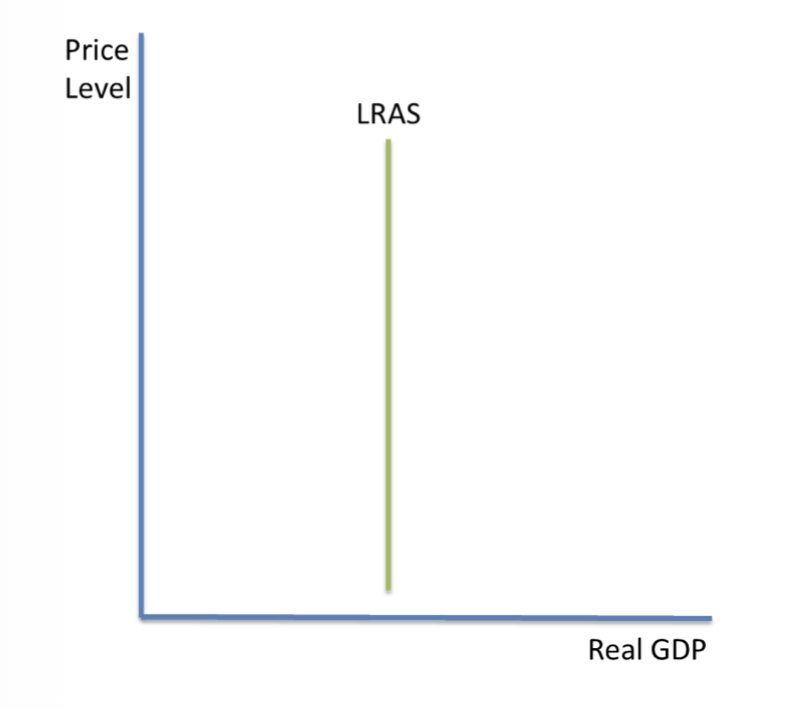
The long run aggregate supply curve (LRAS) shows the potential supply of an economy in the long run. This is when prices, and the costs and productivity of factor inputs, can change. Similarly to the PPF, it can show the economy’s productive potential.
The curve is vertical in the classical model, because supply is assumed not to change as the price level changes.