LIFESCI 2A03 Final Notes
Module 1 - Introduction to Science, the Scientific Method, and Research Studies
Lecture 1
Science = Pursuit and application of knowledge and understanding of the natural + social world following a systematic methodology based on evidence
Characteristics of science (REMEMBER):
Based on empirical knowledge
Provides rational/natural explanations
Testable
Repeatable + reproducible + reliable
Involves observation and experimentation
Generality of principles
Empirical knowledge = Knowledge based on evidence
Evidence: data collection from observation/experimentation
Observation - common starting point of scientific investigations
Natural explanations = Explains what we observe in the natural world
Cannot be explained by “miraculous phenomenon”
Testable = Scientific explanations must generate specific expectations + can be tested through observation/experimentation
Can generate a hypothesis and a prediction
“If (hypothesis), then (prediction)”
Repeatable + reproducible + reliable = Scientific concepts can be confirmed by repeated/reproduced tests
More reproduction/repeats = More reliable findings
Experiment = Controlled setting in which the researcher manipulates/intervenes a natural process to observe its effects
Observation = When a researcher observes the focal individual/population without manipulating any processes/behaviours
In a natural setting
Generality of principles = Scientific explanations can be applied universally to explain common patterns
Research = Systematic, planned, multi-step process that uses discoveries to advance knowledge
Scientific research = Research with the purpose of scientific contribution
Importance of scientific knowledge:
Identifying new phenomena, materials, organisms
Solves scientific problems
Develops scientific inventions
Provides basis for government and industry policies
Research process is an interplay of inductive and deductive reasoning
Inductive reasoning = Process of using specific observations to make generalizations
Start with specific observation
Goal is to find general theory
Deductive reasoning = Process of determining a generalization to explain specific observations
Start with general theory
Goal is to observe and explain specific observation
Steps of the scientific method (REMEMBER):
Determine the problem/question
Formulate a hypothesis
Formulate predictions based on hypothesis
Test predictions
Analyze data
Ask “does the data support the hypothesis”
Draw conclusions
Communicate results
Scientific method is an iterative process, the steps can be repeated multiple times if needed
Lecture 2
Research hypothesis = Tentative explanation to a research question
Characteristics of a research hypothesis (REMEMBER):
Stated before experimental/observational studies
Based on prior knowledge
Testable
Can be falsified but NOT proven
Leads to predictions
Implies a relationships between independent (predictor) and dependent (outcome) variables
Types of relationships between variables (REMEMBER):
Correlation = Association between 2 variables, they change together in a predictable way
Causation = One event is the result of the occurrence of another event
Patterns correlations (REMEMBER):
Positive/direct linear = When x increases, y increase
Negative/inverse linear = When x increases, y decreases or vice versa
Non-linear relationship = Can be visualized as a non linear function (e.g. parabola)
No relationship
Directional vs. directional RH:
Directional = The hypothesis states either a positive or negative direction of the association
Directional hypotheses can ONLY be made if there is evidence of a directional relationship
If the RH is directional, the predictions must be directional
Directional RH uses a one tailed t-test
Nondirectional RH uses a two tailed t-test
Steps on testing a hypothesis (REMEMBER):
Generate predictions using DEDUCTIVE reasoning
Collect data
Statistically analyze and interpret data (includes finding significance level)
Generate a conclusion - either you fail or REJECT TO FAIL hypothesis
Null and alternate hypotheses = More specific hypotheses generated from the RH that can be tested
Null hypothesis (H0) = Implies no relationship between variables
Alternate/alternative hypothesis (Ha) = Implies relationship between variables
Corresponds with research hypothesis
2 types of statistical analysis:
Hypothesis tests
Estimation statistics
Hypothesis tests:
Researcher sets their a (significance level = likelihood of type 1 error) value
Researcher chooses the statistical test to run (i.e.. t-test, chi squared test)
Test statistic and p value are calculated
Estimation statistics:
More common in clinical studies
Researcher sets their a value
Researcher calculates parameter estimates (i.e. mean differences, risk ratio, correlation coefficient) - which quantifies the strength of associations
Types of statistical errors (REMEMBER):
Type 1 (alpha) error = Rejecting a true H0
Type 2 (beta) error = Failing to reject a false H0
Statistical power (a value) = 1 - beta value
Quantifies the ability to identify a real relationship when it exists
When to reject or fail to reject a hypothesis:
Case 1: if P < a
The confidence interval does not include the H0 value
Reject H0
Fail to reject Ha
Biological conclusion = There is significant evidence to support the hypothesized association
Case 2: if P > a
The confidence interval does include the H0 value
Fail to reject H0
Reject Ha
Biological conclusion = There is not enough evidence to support the hypothesized association
Lecture 3
Primary research = Researchers conduct their own studies
Includes collection and analysis of raw data
Types: observational research, experimental research
Secondary research = Analysis of studies that have already been performed
Types: narrative/traditional literature reviews, systematic reviews, meta-analyses
Primary and secondary research can be either:
Basic = Investigates basic principles and reasons for a particular event/process/phenomenon
Applied = Attempts to solve practical problems of interest to humans
Biological systems used in research:
Pre-clinical = non-human subjects
In vitro = Isolated cells in a dish/tube
Ex vivo = Isolated tissue/organ
In vivo = Model organism
Clinical = human subjects
Research questions can be either:
Descriptive (who, what, when, where)
Analytic (why, how)
Data collection can be either:
Longitudinal = Subjects are followed over time and data is collected at set intervals/events
Prospective = Data is collected over time as characteristics/circumstances change
Retrospective = Information is collected from an individual’s past (e.g. medical records, criminal history)
Cross-sectional = Data is collected at one point in time
Lecture 4
Sources of bias:
Limitations in study design
Technical limitations
Limited abilities of scientists to discern differences
Wishful thinking
When can bias occur:
In the design stage
During data collection/analysis
During publication
Types of biases (REMEMBER):
In the design stage
Sampling/recruitment/selection bias = Unrepresentative sampling of subjects
Allocation Bias = Unequal allocation of subjects into groups
During data collection/analysis
Performance bias = Differences in care provided to groups other than the manipulated variable
Recall/attrition bias = Incomplete/inaccurate/lost data
Assessment/measurement/detection bias = Errors in assessing/recording/analyzing data + data manipulation
During publication
Reporting bias = Selective reporting of data
Citation bias = Only citing studies that support own findings
Publication bias = Preference of journals to publish studies with significant results/studies that cite the journal
Example of limitations in science - Painter’s Human Chromosome Count
Painter reported 48 chromosomes in a human cell
This was accepted for 3 decades
Issues:
Sampling error = Low sample size
Source of tissue (testicular) had a low # of spermatogonia
Measurement error = Damaged chromosomes since tissue was not fixed
Chromosomes were clumped/curled
DNA was not adequately condensed to visualize
From researchers that reproduced the study:
Sampling bias
Assessment/detection bias
Skeptical to challenge previous count
Improvements:
Fixation of tissue
Hypotonic solution to prevent chromosome clumping
Use of colchicine for further DNA condensation
How researchers can minimize bias (REMEMBER):
Be aware of all potential sources of bias
Include:
Control groups
Matching
Randomization
Blinding
Declare study limitations
How editors and reviewers can minimize bias (REMMEBER):
Create and enforce guidelines for publication
Detect bias during review process
Avoid publication bias
Lecture 5
Study design for hypothesis driven studies require:
Variables of interest
Methods of sampling + assigning subjects
Determining the sample size
Determining how data is collected and analyzed
Types of errors in study design:
Random = Due to chance/natural variation in population
Systematic = Bias
Statistical = Type 1 and 2 errors
Confounding variables = Variables not of interest to the experimenter
How to control confounders:
Including control groups
Matching groups for known confounding factors
Subject randomization
Large sample sizes
Inclusion of confounder in statistical analysis
Types of control groups:
Negative control = When there is no effect expected, they produce no effect
Sham = Given the procedure without the actual treatment (surgery)
Vehicle = Administering the vehicle for the treatment without the treatment itself (saline, buffer)
Placebo = Administering inactive substance (sugar pill)
No treatment
Positive control = When there is treatment with a known expected effect, they produce the expected effect when they are given the treatment
Shows that the experimental setup works
Randomization can be applied at sampling and/or allocation to groups
Types of randomization:
Simple
Stratified
Block
Randomization can’t always, like in observational studies
Sample sizes must be large enough to represent the population
Sample size = # of biological replicates
However, we can’t always use the largest samples possible as it can be too expensive and time consuming
Blinding minimizes performance bias and detection/assessment bias
Types of blinding:
Single blind
Double blind
Full blind
Partial blind
How to study causation:
Control unknown and known confounders
Use interventional studies (longitudinal) that manipulate the predictor
Include dose-response analysis in design
Drawbacks of experimental studies:
Sometimes difficult to apply/generalize results
Some variable cannot be manipulated
Ethical considerations
Module 2 - Introduction to Stem Cells (SCs)
Lecture 1
Stem cells (SCs) = Cells capable of self-renewal and differentiation
Characteristics of SCs (REMEMBER):
Spherical shape
Self renewal through mitosis
Unspecialized cells that later differentiate
Types of SC divisions (REMEMBER):
Symmetric self-renewal = One SC divides into 2 SCs
Asymmetric division = One SC divides into 1 SC and 1 progenitor (which becomes a differentiated cell)
Symmetric differentiation (AKA symmetric division) = 1 SC becomes 2 progenitors (which become 2 differentiated cells)
Stem cells have either unlimited or limited proliferation potential
Hayflick limit = Term that applies to the limited proliferation of cells in culture
Depends on
Species
Tissue type
Age of donor
Limited proliferation potential is due to telomeres
Shorten over time
Telomerase becomes less active
Types of differentiation potential (REMEMBER):
Totipotent = Can become any cell type + extraembryonic tissue
Pluripotent = Can become any cell type
Multipotent = Can become a few cell types
Unipotent = Can only become one cell type
Factors regulating SC function (quiescent or actively cycling)(REMEMBER):
Extrinsic = The environment where the SC is
Intrinsic = Proteins and miRNAs in the cell
SC niche = Cellular + non cellular components
Lecture 2
Types of SCs:
Embryonic stem cells (ESCs)
Adult tissue stem cells (ASCs)
Induced pluripotent stem cells (iPSCs)
ESCs = From the inner cell mass (ICM) of plastocyst
Unlimited proliferation
Pluripotent
Can form tumors
ASCs = From adult tissue
Somatic ASCs = Gives rise to somatic cells
Hayflick limit
Can be multi or unipotent
Replaces dead/damaged cells
Can be dormant for a long time
Hard to isolate and grow in lab
Germline = Gives rise to germline cells
Processes of ASCs in order:
Symmetric self renewal
Asymmetric self renewal
Progenitor division
Differentiation of progenitors
Intestinal epithelium = Monolayer of cells in intestine
Replaced every few days
SCs are found in intestinal epithelium and differentiate into
Absorptive cells
Goblet cells
Paneth cells
Enteroendocrine cells
iPSCs = Cells that are isolated from a patient and treated with “reprogramming factors”
Unlimited self-renewal
Pluripotent
Clinical applications of iPSPs (REMEMBER):
In vitro, clinical studies for human disease
Drug screening/toxicity test
Cell regenerative therapy
Module 3 - Non-clinical SC Research
Lecture 1
Non-clinical research = Research where the subjects of study are NOT humans
Types of non-clinical research:
Primary and secondary
Basic and applied
Observational and experimental
Model organisms = Non human species used by researchers to study conserved phenomena (processes that can only be observed in vivo)
Planaria = Small flatworms
Benefits of planaria as model organisms:
Easy to rear
Inexpensive
Similar molecular and cellular processes as higher organisms
Easy to manipulate
High regenerative ability throughout lifespan
“immortal under the edge of the knife”
Planarian SCs = neoblasts
Pluripotent
20% of all cells
Involved in tissue homeostasis and regeneration
Only mitotically active cell population
BrdU (bromodeoxyuridine) = analogue of thymidine used to label neoblasts in planaria
Neoblasts cultured in different cell medium conditions (extrinsic factors) can give rise to all known types of differentiated cells in planaria
Single neoblasts grafted into irradiated planaria can restore the subject’s regeneration capacity
Process is formation of blastema (mass of cells)
Lecture 2
Research study #1 - Reddien et al
RQ = Are Smedwi genes required for neoblast function? If so, in which process (homeostasis/regeneration) and step (proliferation, migration, differentiation)?
Prior knowledge:
PIWI genes regulate SC function
2 types of PIWI like genes in planaria - smwedi 1 and smwedi 2
Smwedi gene expression:
RH = Smwedi genes are expressed in neoblasts
Prediction = Patterns of smwedi 1 and 2 expression should resemble neoblast distribution
Ha = There is a relationship between the location of neoblasts and the location of smwedi gene expression
H0 = There is no relationship between the location of neoblasts and smwedi gene expression
Statistical conclusion = H0 is rejected, failed to reject Ha
Biological conclusion = Smwedi genes are expressed in neoblasts
Smwedi genes role in regeneration:
RH = Smwedi-2 is crucial for the proliferation of neoblasts during regeneration
Prediction = Reducing smwed-2 expression should block neoblast proliferation during regeneration
Ha = Smwedi-2 has a positive effect on the proliferation of neoblasts during regeneration
H0 = There is no effect of smwedi-2 expression on the proliferation of neoblasts
Statistical conclusion = Ha rejected, failed to reject H0
Biological conclusion = Smwedi-2 expression does not play a role in neoblast proliferation during regeneration
Lecture 3
Niche = Local tissue microenvironments that maintain and regulate SCs
Source of extrinsic stimuli
Example: Intestinal SC niche (Gut microbiota community)
Microorganisms in the intestinal tract
Association between an imbalance of gut microbiota community and GI related disorders
Extrinsic stimuli = Secreted/membrane bound bacterial components + by products and metabolites
Research study #2: Naito et al.
RQ: Does gut microbiota regulate intestinal epithelium homeostasis in the colon? If so, how?
Example: Hair follicles
Hair follicles - epithelial mini-organs that sustain cyclic hair growth
New bulge in follicle —> asymmetrical division of SC
Activity of hair follicles are time dependent
Leading to hair thinning and loss
Research study #3: Matsumura et al.
RQ: What causes hair follicle aging and age-dependent hair loss?
Lecture 4
Research Study #2 - Naito et al.
Prior knowledge:
Gut microbiota community called CSCM (niche) is found close to intestinal epithelia
Mice deficient in TLRs (receptors that mediate immune responses) and LPS (lipopolysaccharides) show increased cell proliferation in these niches
RH = CSCM regulates intestinal epithelial homeostasis
Prediction = Mice colonized with germs will show different #s of proliferative cells compared to germ free (GF) mice
Methods:
Ex vivo - analyzed organoids from mice after they were/weren’t mono-colonized
Ha = CSCM has an effect on intestinal epithelial homeostasis
H0 = CSCM has no effect on intestinal epithelial homeostasis
Statistical conclusion = Rejected H0, failed to reject Ha
Biological conclusion = CSCM regulates intestinal epithelial homeostasis by regulating proliferation through LPS
Lecture 5
Research study #3 - Matsumura et al.
Prior knwoledge:
Increase in hair thinning and loss with age
Patients with COL17A1 deficiency show alopecia
Miniaturization of HFs = Underlying cause of male pattern baldness (androgenic alopecia)
RH = Age-dependent hair loss is driven by HF miniaturization as a loss of collagen XVII and SC depletion
RH1 = Age dependent hair loss has a positive correlation with miniaturization of HFs
Ha = Age dependent hair loss is positively associated with miniaturization of HFs
H0 = There is no relationship between HF miniaturization and hair loss
RH2 = Aging related hair loss and HF miniaturization is linked to loss of collagen XVII and HFSCs
Prediction = HFs of old mice should have lower levels of collagen XVII and of S100A6 (SC marker)
H0 = Aging related hair loss and HF miniaturization are not related to loss of collagen XVII and HFSCs
RH3 = Age dependent loss of COL17A1 triggers HF miniaturization and hair loss
Prediction = Young mice with mutant COL17A1 + knockout gene for expression of bulge will have more miniaturized HFs compared to control mice
Ha = Age dependent loss of COL17A1 will have a positive effect on HF miniaturization and hair loss
H0 = No relationship between the 2 variables
Tutorial 5
1. Why is the null hypothesis a valuable tool in experimental design? What is the null hypothesis that will be tested in this experiment?
Value of the Null Hypothesis:
The null hypothesis (H₀) is essential in experimental design because it provides a baseline for comparison, allowing researchers to measure the strength of evidence against it. By assuming that no real effect or difference exists, the null hypothesis helps determine if the observed results are due to chance.Null Hypothesis in Fisher’s Experiment:
In the "Lady Tasting Tea" experiment, the null hypothesis states that the lady cannot distinguish between tea with milk added first and tea with milk added second.
Mathematically:
H0:The lady’s guesses are purely random.
Comparison with Initial Assumption:
If your original answer was that the null hypothesis suggested the lady could distinguish the order of milk and tea, then it differs from Fisher’s null hypothesis, which assumes no ability to differentiate. Fisher’s null hypothesis forms the foundation for calculating the probability of her success by random guessing.
2. Why is it important to offer the model more than just two cups? Was your answer the same as Fisher’s answer? Describe Fisher’s reasoning.
Importance of More Than Two Cups:
Offering only two cups (one milk-first and one tea-first) is inadequate because it creates a 50% chance of guessing correctly, making it impossible to distinguish genuine skill from random guessing.Fisher’s Reasoning:
Fisher advocated for offering 8 cups (4 with milk-first, 4 with tea-first) because it reduces the likelihood of success by chance alone. With 8 cups, the probability of guessing all correctly by chance is:
1/70 = 0.014
This design ensures that success is unlikely unless the subject genuinely possesses the ability to discriminate.
3. How many cups did you say the lady should taste? How many cups did Fisher say she should taste? Describe Fisher’s answer, including mathematical considerations.
Your Initial Estimate vs. Fisher’s Suggestion:
If you initially suggested fewer than 8 cups, your design would not have been as statistically rigorous as Fisher’s. Fisher specified 8 cups because:4 with milk-first and 4 with tea-first.
This number balances a manageable experimental size while minimizing the probability of guessing correctly by chance.
Mathematical Considerations:
Fisher calculated the probability of perfect success by chance using the hypergeometric distribution. With 8 cups, the chance of randomly identifying all correctly is 1/70 =
This design provides a stringent test for detecting real ability.
Factors Impacting Significance and Constraints:
Sample size: Small sample sizes reduce power and precision.
Bias and systematic errors: Can lead to misleading results.
Variability in responses: Uncontrollable variability can affect outcomes.
4. How should the cups be prepared? Does every cup need to be identical in every way except for the order of milk and tea? What does Fisher suggest about variation?
Cup Preparation:
Ideally, the cups should be identical except for the order of adding milk and tea to eliminate confounding variables.Can Cups Be Identical?
In practice, it is nearly impossible to make every cup truly identical. Small variations in temperature, mixing, or cup quality can occur.Fisher’s View on Uncontrollable Variation:
Fisher acknowledged that slight, uncontrollable variations are inevitable. However, randomization minimizes the impact of these variables, ensuring that differences between cups are equally likely to affect all experimental conditions.
5. Why is randomization important in experimental design? In what order should the cups be presented? How did Fisher recommend choosing the order?
Importance of Randomization:
Randomization prevents systematic bias by ensuring that any uncontrolled variables are equally distributed across experimental conditions.Order of Presentation:
Fisher recommended randomizing the order of presentation of the cups to ensure that the sequence of tasting does not inadvertently influence the results. Without randomization, subconscious cues or fatigue could bias the experiment.Fisher’s Method for Choosing Order:
Fisher’s approach involved randomly assigning the order of the cups, using principles of combinatorial probability to calculate the likelihood of success by chance.
6. Would it be acceptable to add two more cups to the original 8 cups? Why or why not? Why is it important not to change the design mid-experiment?
Adding More Cups:
No, it is not acceptable to add two more cups after establishing the design. Changing the experimental setup midway introduces bias and undermines the validity of the results.Value of Predefined Experimental Design:
Predefining the design ensures:Consistency and reproducibility.
Maintenance of the original probability calculations.
Protection against cherry-picking favorable outcomes.
7. Can you conclude from the lady’s success that most people can tell the difference between milk-first and tea-first? Design an experiment to test this broader question.
Conclusion from Her Success:
No, success in one individual does not imply that most people possess the same ability. Fisher’s test evaluated the skill of one individual, not the general population.Designing a Broader Experiment:
To test this question more broadly:Sample Size: Recruit a large and diverse sample of participants.
Experimental Setup:
Randomly assign 8 cups (4 milk-first, 4 tea-first) to each participant.
Randomize the order of cup presentation.
Control Group: Include a control group with individuals who self-report no ability to differentiate.
Data Collection: Measure the number of correct guesses per participant.
Statistical Analysis: Use a chi-square test or binomial test to determine if the overall proportion of correct responses differs significantly from chance.
Module 4 - Clinical SC Research
Lecture 1 - Overview of Clinical Studies
Learning Outcomes
Identify different types of clinical research studies and their characteristics
Explain advantages and disadvantages of each type
Explain the application and purpose of blinding and randomization in clinical research
Pre-Clinical vs. Clinical Research
Pre-clinical = Involves isolated cells, tissues, or organs
Less complex
Fewer ethical issues
Clinical = Involves human subjects
More complex
More ethical considerations
Why Conduct Clinical Studies?
To gain medical knowledge for:
prevention of disease development or recurrence
diagnosis
treatment
palliative/support care symptom management
Types of Clinical Studies
Divided into 2 main categories:
Observational = Researchers observe and analyze what happens to people in different situations based on exposure
No interventions
Experimental (interventional) = Researchers manipulate/assign a specific treatment/factor to subjects
Study Type | Design | Group Assignment | Measures/Reports | Key Use |
|---|---|---|---|---|
Cohort | Longitudinal | By exposure | Risk Ratio (RR) | Measure incidence of disease |
Case-Control | Longitudinal | By outcome (disease status) | Odds Ratio (OR) | Study rare diseases |
Cross-Sectional | Single time pt. | By exposure & outcome (same time) | Risk Ratio (RR, from prevalence) | Measure prevalence of disease |
Clinical Trials (CTs) | Prospective | By intervention (assigned) | Risk Ratio (RR) | Test safety/efficacy of interventions; strongest evidence of causality |
RR and OR
Risk ratio (RR) and odds ratio (OR) are measures of association used to quantify the relationship between an exposure/intervention, and an outcome
RR
RR (AKA relative risk) = Compares the risk of an event in one group to the risk of the same event in another group
Interpretation:
RR = 1 - There is no association, as the risk of the event is the same in both groups
RR >1 - There is a positive association, as the risk of the event is higher in the exposed/intervention group compared to the control
RR <1 - There is a negative association (AKA protective effect), as the risk of the event is lower in the exposed/intervention group compared to the control
Calculation:
Example:
Imagine a clinical trial testing a new drug to prevent heart attacks. After 5 years, 5% of the participants taking the drug had a heart attack, while 10% of the participants taking a placebo had a heart attack.
Risk in the drug group = 5% = 0.05
Risk in the placebo group = 10% = 0.10
The Risk Ratio is:
RR=0.05/0.10 = 0.5
This means that the risk of having a heart attack in the drug group is 0.5 times (or 50%) of the risk in the placebo group. In other words, the drug reduces the risk of heart attack by 50%.

OR
OR = Compares the odds of the exposure in the group with the disease to the odds of exposure in the group without the disease
Interpretation:
OR = 1 - No association, as the odds of exposure are the same in both groups
OR >1 - Positive association, as the odds of exposure are higher in the cases compared to controls
OR < 1 - Negative association (AKA protective effect), as the odds of exposure are lower in the cases compared to the controls
Calculation
Example: In a case-control study looking at the association between smoking and lung cancer, researchers found that 80% of lung cancer patients (cases) were smokers, while 20% of a control group without lung cancer were smokers.
First, calculate the odds of exposure (smoking) in each group:
Odds of smoking in cases = 0.8/(1-0.8) = 4
Odds of smoking in controls = 0.2/(1-0.2) = 0.25
Then, calculate the Odds Ratio:
OR=40.25=16
This means that the odds of smoking are 16 times higher in people with lung cancer compared to people without lung cancer.

Observational Studies
Cohort Studies
Cohort study = A study that follows groups of people over time
Prospective or retrospective
To see how certain exposures affects the likelihood of developing a disease/outcome
Participants are grouped based on exposure to a risk factor
Main advantage - Can measure the incidence (new cases) of disease, good for studying common outcomes
Primary statistical measure: Risk ratio (AKA RR)
Case Control Studies
Case control study = Researchers group subjects based on the outcome (whether they have a particular disease or not), then they look in time to determine exposures or risk factors they might have had
Retrospective
Main advantage - Useful for studying rare diseases because researchers already have subjects with the disease (rather than wasting their time with a cohort study to see if any participants get the disease)
Main disadvantage - Relies on participants’ memory and/or past records
Subject to bias
Main statistical measure: Odds ratio (AKA ORR) = Odds of exposure in cases vs. controls
Cross-Sectional Studies
Cross-sectional study = Researchers collect data from a population @ a single point in time
“Snapshot” of the population = Both the exposure and the outcome are measured simultaneously
Main advantage - Useful for determining the prevalence of a disease/condition in a population
Main disadvantage - Cannot study causation or changes over time
Experimental/Interventional Studies
Clinical Experimental Studies
AKA clinical trials (CT)
Involves assigning interventions/treatments to participants
Main advantage - Strongest evidence for cause and effect relationships
Main statistical measure: RR
Types of CTs:
Randomized control trials (RCTs) = Participants are randomly assigned to groups to minimize bias
Non-randomized trials = Assignment is not random, which can introduce bias
Community/cluster trials = Groups (e.g. schools, towns) are assigned to interventions, rather than individuals
Field trials = Preventative interventions are tested in healthy populations
Key Terminology
Exposure (AKA predictor/risk factor) = Independent variable that is naturally determined, it is not something that can be manipulated by the researcher
e.g. Age, sex, smoking
Intervention (AKA treatment) = Independent variable assigned and manipulated by the researcher
e.g. drug administration, medical procedure
Special Study Designs
Pilot and feasibility studies = Small-scale versions of larger studies
Used to test whether a full-scale study is practical
Also used to refine study procedures
Multi-Arm Multi-Stage trials (AKA MAMS) = Trials that test multiple treatments @ once, allowing researchers to add/drop treatment groups as results become available
Nested case-control and case-cohort studies = Variations that combine features of cohort and case-control studies
Often used to improve efficiency or reduce bias
Lecture 2 - Function and Cancer
Learning Outcomes
Understand the characteristics of heterogeneous tumore
Explain what cancer stem sells (CSCs) are and their origin
Identify potential tissue/organ sources of CSCs that drive tumor relapse
What is Cancer?
Involves the formation and growth of abnormal cell populations
Interferes with normal vital functions
Cause - Uncontrolled cell proliferation
Tumor Heterogeneity
Tumor heterogeneity = The structural and functional diversity observed within many tumors
Question - Is cancer driven by a specific population of cancer cells?
Is a subset of cells within the tumor primarily responsible for driving the tumor’s growth and spread?
Cancer, SC Number, and Function
Cancer SCs = Cancer cells with high self-renewal capacity
Thought to drive tumor growth
Characteristics of cancer stem cells include:
their ability to self-renew,
differentiate into various cell types, and
resist conventional therapies
SC Division Theory of Cancer
CSC division is the driving force of carcinogenesis (initiation of cancer formation)
Carcinogens → accumulation of cell divisions in SCs ←→ accumulation of DNA alterations → cancer
Hierarchal Model of Tumor Growth
There is a structured organization of cells within tumors
Each cell type has a distinct role
Hierarchal model of tumor growth:
Cancer stem cells (CSCs) = High self-renewal capacity which sustains the tumor
Transit amplifying (TA) cells = They divide faster than CSCs but have a finite # of divisions before they stop
Non-proliferative cancer cells = Cells that do not actively proliferate
Example of Cancer - Glioblastoma Multiforme (GBM)
GBM = Type of brain tumor originating from astrocytes
The most common and aggressive form of malignant brain tumors
Rapid growth
Treatment resistant
Mainly observed in adults from 45-75 years old
Poor prognosis = typically given 1 year to live after diagnosis
Treatment (often not curative):
Surgery
Radiation
Chemo using temozolomide
Neural SC Niches and GBM
Neural SC niches (AKA NSC niches) = Microenvironment where neural stem calls reside
Subventricular zone (SVZ) of lateral ventricles
Sub granular zone (SGZ) of dentate gyrus within the hippocampus
Issues within the NSC niches can give rise to brain tumor propagating cells (AKA BTPCs), which can initiate and help sustain tumor growth
Lecture 3 - Research Study 1
Learning Outcomes
Identify key features, advantages, and limitations of this type of observational studies
Explain what progression-free survival is and how it can be studied
Explain what prognostic factors are and how their effect can be studied
Identify variables, formulate RH, predictions, and conclusions
Research Study #1
RQ - Are brain SC niches a reservoir for glioma CSCs driving relapse? If so, can irradiation of the SC niches improve patient survival?
RH - Irradiation of NSC niche decreases GBM recurrence and improves patient prognosis
Prediction 1 (P1) - Patients that receive ‘high’ dose PV (SVZ) irradiation should survive longer than those treated with ‘low’ doses
P2 - Patients that receive ‘high’ dose PV (SVZ) irradiation should have a lower risk of progression than those that received ‘low’ doses
Previous Observations + Findings
GBMs are hierarchally organized - They contain distinct cell populations with varying self-renewal capacities
GBMs often recur even after chemo + radiotherapy
NSCs can undergo malignant transformation which leads to tumor development
This was observed in mice models
Study Design
Population was composed of individuals with a grade 3 or grade 4 tumor
N = 55
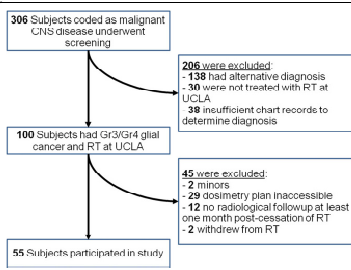
Divided the population based on radiation dose to the PV zone (AKA PV volume):
High bilaterial PV dose RT (>43 Gy) = Patients that received a radiation dose higher than 43 gray
Low bilateral PV dose RT (<43 Gy) = Patients who received a radiation dose lower than 43 gray
Further divided the PV dose groups into progression or no progression after bilateral PV radiation
Progression = Relapse/recurrence of the tumor after initial treatment
Analyzed:
Ipsilateral hippocampal formation (HF)
Ipsilateral PV
Total radiation dose received by the tumor
Results
Median PFS for the high PV dose group = 15 months
Median PFS for the low PV dose group = 7.2 months (p < 0.03)
Statistically significant difference (p < 0.03) between the two groups
Analyzing the Effect of Prognostic Factors (AKA Hazard Ratio)
Prognostic factors = Characteristics of a disease/patient that can be used to predict the likely outcome of the disease
Prognostic factors for the risk of tumor progression:
Location of the tumor
Extent of surgical intervention
Total tumor does - amt of radiation delivered to the tumor
Hazard ratio = Measures how a specific prognostic factor affects the rate @ which an event occurs over time
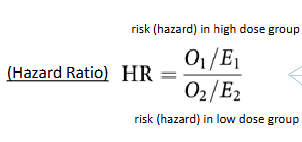
HR interpretation:
< 1: Lower risk of event (progression) in high dose group, indicating a protective effect of high-dose irradiation.
= 1: No difference between groups, suggesting that the factor has no impact on the risk of progression.
> 1: Higher risk of event (progression) in high dose group, indicating that high-dose irradiation may be associated with increased risk of progression
Study Limitations
Was a retrospective analysis
They need prospective studies to confirm the correlation
Overall survival was not assessed
They focused only on progression-free survival
Individuals who did survive and had progression were not included in the findings
Researchers assumed that treatment and other factors were consistent during the follow-up period
Did not evaluate the potential long-term effects of radiation on NSC niches
Memory impairment, impaired tissue regeneration
Lacked MGMT (O6-methylguanine DNA-methyltransferase) promoter methylation data for most patients
This is an important predictor of response to temozolomide chemotherapy
MGMT and Temozolomide (TMZ)
TMZ is an alkylating agent that methylates DNA, leading to cell death.
MGMT = Enzyme that removes methyl groups from DNA, repairing the damage caused by TMZ
High levels of MGMT expression can make cancer cells resistant to TMZ by repairing the DNA damage it causes
Summary of Research Study #1
Prescribed high dose (>43 Gy) to the periventricular region may improve GBM patient outcome
RCTs (randomized controlled trials) are needed to confirm the benefits of high-dose periventricular irradiation and to assess its potential side effects
Impact on OS: RCTs should evaluate the impact of high-dose periventricular irradiation on overall survival (OS)
Impact on adult neurogenesis, memory, and tissue repair: RCTs should also assess the potential effects of high-dose periventricular irradiation on adult neurogenesis, memory, and tissue repair
Lecture 4 - Research Study #2
Learning outcomes
Identify the key features, advantages, and limitations of this type of study (historical control study)
Explain what a historical control is and how it differs from a concurrent control
Identify variables and formulate RH, predictions, and conclusions
Research Study #2
RQ - Can NPC-sparing strategy be efficient @ controlling tumor relapse and survival while mitigating treatment-induces neurocognitive decline
Previous observations/findings:
Higher radiation doses → improved survival, BUT ALSO negative effects on cognitive function
Lower radiation doses → Reduced negative cognitive effects, but less effective against the tumor
RH - Low (sparing) irradiation to NPC niches does not impair tumor contro lor patient survival
P1 - Patients treated with NPC sparing RT and those treated with standard RT will have similar overall survival rates
P2 - Patients treated with NPC sparing RT will have similar progression free survival compared to those with standard RT
Neural Progenitor Cells (NPCs)
Neural progenitor cells (NPCs, AKA neural stem cells/NSCs) = Stem cells that reside in the SC niches of the brain
Helps maintain homeostasis
May be the source of cancer stem cells that drive tumor relapse after treatment
Study Design
Population - Patients with GBM receiving NPC niche sparing radiation therapy
Sample size, n = 30 (only 17 completed neurocognitive assessment)
NPC niche sparing RT = Radiation that is delivered in a way that avoids as much of the NSC niches as possible
Depends on tumor location and geometry
Outcomes measured:
Progression free survival (PFS) = Time from treatment until the tumor worsens/returns
Overall survival (OS) = Time from treatment until death or up to 24 months after RT
Neurocognition = Cognitive function after treatment, with a focus on verbal memory
Historical controls were used - patients in the past who received standard (non NPC sparing) RT
Historical control = A group of subjects from previous studies used for comparison instead of a concurrent control group
Concurrent control = Control group enrolled and treated @ the same time as the experimental group
Variables:
IV = Type of radiation therapy (NPC-sparing RT vs. standard RT)
DVs:
Overall survival (OS)
Progression free survival (PFS)
Neurocognitive outcomes
Results
OS and PFS after NPC-sparing RT were similar to the historical controls
Patients who received NPC niche-sparing RT showed better verbal memory performance than the historical controls
Study Limitations
Larger and more comprehensive studies are needed (only 17 participants did a neurocognitive assessment)
Using historical controls may introduce bias if patient populations or treatments differ over time
MGMT methylation was not uniformly measured
Does not address whether higher radiation doses may improve survival compared to standard RT
Only addressed if the survival rates were similar
Lecture 5 - Intro to CTs
Learning Outcomes
Identify key features of clinical trials (CTs) and differentiate them from observational studies
Recognize different CT designs and phases
Explain the advantages and limitations of different CT designs
Clinical Trials - Review
Participants receive interventions based on the researcher’s protocol
Designed to assess the safety and therapeutic effect of interventions
Therapeutic effects being assessed:
Efficacy - Performance of the intervention under ideal and controlled circumstances
Effectiveness - Performance of an intervention under real world settings
Prospective + analytical (evaluates the relationship between an intervention and an outcome)
Types of Controls in CTs
Standard treatment (active) = The current standard of care
The intervention is compared to this standard of care
Placebo = An inactive substance or treatment
Dose-response = Comparing different dosages of the same intervention
the lower/higher dose is used as a control for the new dose researchers are implementing
Historical = Using data from previous studies as a control group
Different Designs of CTs
Studies can be either:
Randomized or non randomized
Parallel or crossover
Randomized = Participants are randomly assigned to different treatment groups
Randomization can occur @ different stages of the CT
3 types of randomization: simple, block, stratified
Simple randomization = Each individual is randomly assigned
Block randomization - Participants are divided into subgroups (blocks) then randomized within each block
Stratified randomization = Dividing patients into subgroups (strata) according to prognostic factors (ie. smokers, non smokers, drinkers) then randomly assigning treatments within each stratum
There can be equal (balanced) or unequal (unbalanced) #s of participants in each group
Non randomized = Participants are not randomly assigned
Potential for bias - Selection bias, confounding variables
Parallel = Participants remain in their assigned group throughout the study
Crossover = Participants switch treatment groups during the study
Allows each participant to serve as their own control
Blinding/Masking in CTs
Ideally included when its feasible to reduce/prevent performance, assessment, or attrition bias
Types of blinding:
Single-blind = Participants are unaware of their treatment assignment
Double-blind = Both participants and researchers are unaware of treatment assignments
Triple-blind = Participants, researchers, and data analysts are unaware of treatment assignments
Phases of CTs
Determined by the U.S. FDA
Each phase differs from the others in:
Goal
# and type of participants
Length
Presence of comparison groups, types of comparison groups present, and # of comparison groups present
5 phases overall:
Early phase 1 (AKA “0”)
Phase I
Phase II
Phase III
Phase IV
Phase I - Safety and Dosage
Phase I trial = Trial focused on assessing the safety and dosage of a new treatment in a small group of people
Usually done on healthy volunteers
n = 20 - 100
Done in specialized centers
Open (not blind)
Phase II - Efficacy and Side Effects
Phase II trial =Trial to verify the therapeutic effect of a treatment (efficacy), the possible side effects, and its feasibility
Treatment is given to patients with the disease
n = 100 - 500
Done in medical institutions and private practices
Multiple doses are used
Blinded
Comparative
Phase III - Comparison to Existing Treatments
Phase III trial = Larger trial comparing the new treatment to the current standard treatment to determine its effectiveness and monitor side effects
n = 1000 - 5000
Done in medical institutions and private practices
Blinded
Comparative
Phase IV - Post-Marketing Surveillance (Safety Monitoring)
Phase IV trial = A post-marketing surveillance study to monitor the long-term safety and effectiveness of a treatment after is has been approved and is available to the public
n = very large
Leads to new areas of application of the treatment
Lecture 6 - Research Study 3
Learning Outcomes
Identify key features, advantages, and limitations of this type of study (randomized phase II CT)
Explain the difference between primary and secondary outcome measures
Identify dependent, independent, and confounding variables
Research Study #3
RQ - Do high doses of radiation in the SVZ (subventricular zone - a NPC/NSC niche) improve the survival of GBM patients
RH - A higher than routine radiation dose to the SVZ decreases the chance of relapse, improving the survival of GBM patients
Previous Observations/Findings
NSCs in the SVZ might contribute to the recurrence of GBM
From preclinical data
Patients receiving higher radiation doses to the SVZ might have improved survival
From retrospective observational data
Study Design - A Phase II Therapeutic Trial
Gathers preliminary data on a drug’s effectiveness
Randomized + parallel
No blinding (AKA open)
¾ patients will be treated with the higher dose of RT
¼ patients will be given the standard radiation treatment plan
Control = Standard treatment
Inclusion/exclusion criteria:
Both sexes
Adults (18+)
Patients newly diagnosed and histologically confirmed with GBM
Must have undergone gross total resection or subtotal resection
Radiation must be done within 12 weeks of surgery
But CANNOT be before surgery
Patients must be scheduled to receive temozolomide as well as RT (during and after RT)
Cannot have prior malignancy (cannot be diagnosed with a recurrent GBM before the study)
Cannot be pregnant/breastfeeding
Cannot be using Avastin or another VEG-F inhibitor
Outcome Measures
Primary Outcome: The most important outcome for evaluating the effect of an intervention/treatment.
One or more primary outcomes.
Example: Progression-Free Survival (PFS)
Secondary Outcome: Is not as important as the primary outcome but still of interest. May become a primary outcome in future studies.
More than one secondary outcome.
Examples: Overall Survival (OS), location of tumor progression, neurocognitive changes