Plasmid Mapping
you will determine the orientation of the insert in the plasmid provided to you
picking the colony, growing the liquid culture and the miniprep to isolate the plasmid have been done for you
because this has been done for you, you may not have plasmids from the same liquid culture as the spent culture you used/will use to obtain your standard curve
Plasmid Mapping OLM
depending on how RD/ligation was performed, insert can be ligated in 2 different orientations
right way or upside down
using just 1 restriction enzyme → restriction digest sites on either side of the insert are identical
can be ligated in 2 different ways: 5’ to 3’ or 3’ to 5’
using 2 different enzymes to digest then ligate insert in
different restriction enzyme cut sites; sticky ends don’t match
want to express insert — must be in correct orientation
must be in the 5’ to 3’ orientation
only used one restriction enzyme, EcoR1 → insert can actually go in either 5’ to 3’ or 3’ to 5’
which of the plasmids have insert in correct orientation
provided with plasmid that has been isolated from miniprep made from liquid culture of picked white colony
we did not keep the same liquid cultures from spectrophotometry to plasmid mapping experiment
don’t necessarily match
if results don’t match, this is why!!!!!!!!!!!!!!
plasmid we’re using is pAMP
determine orientation of insert by looking at results of double digest
HindIII site — will cut plasmid backbone once
determine orientation with BamHI site
BamHI site is in the insert and it’s off centre of insert (towards one end)
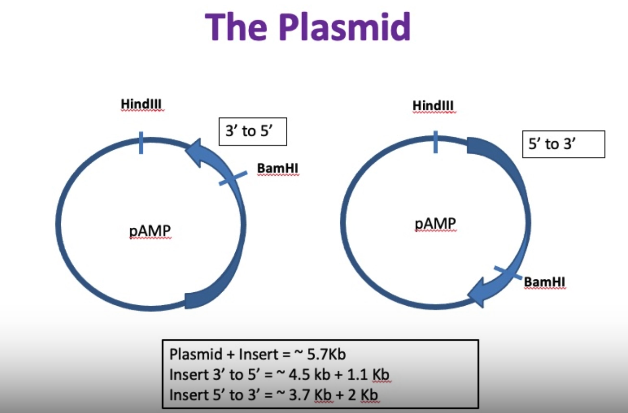
small fragment if 3’ to 5’ and a very large segment
if 5’ to 3’: will have two fragments that are more similar in size
distinguish between orientations of insert using the pattern of the cut — i.e. the size
because we are on an agarose gel, size estimates are not super precise
approximate — can be off a bit (larger fragment with smaller fragment)
should be close
just looking for pattern of bands that are really close together
in lab, will be performing four different digests:
uncut plasmid
HindIII
BamHI
HindIII + BamHI
EcoRI = HindIII
combine digests (once complete) with loading dye
combine with 0.75% agarose gel and run for 30-45 min at 100V
on the gel, there is a Ladder to tell what the size of the fragments are (1 Kb Plus Ladder)
stained with Red Safe → allow us to visualize the DNA
0.75% Agarose Gel:
agarose is a sugar that creates pores when in gel form
higher the percentage, the smaller the pores
which means the greater the resolution (can distinguish a smaller difference in the band size)
however: it takes longer to run
maximize percentage for size of band
very large fragments, can get away with a lower percentage gel
DNA (negative) will be separated based on size when current is run → run towards positive electrode
separated based on size
smallest will run further than largest
Loading Dye:
must add Loading Dye to samples!
contains a dense sugar like glycerol
makes sample sink to bottom of well
if didn’t have a dense sugar to make it more viscous, when add sample to wells (which are sitting in running buffer), they would just float away into running buffer
contain a Dye (often bromothymol blue)
allows us to see where samples are loaded + as gel is running, allows us to visualize how far the gel has run
roughly 500-300 bp on agarose gel (of our percentage)
EDTA — stops enzymatic reactions by binding metal ions that are often required by the enzyme
don’t want restriction digests to keep going (nonspecific cutting)
PCR reaction to stop
Red Safe:
allows for the visualization of DNA
intercalates between DNA base pairs (inserts itself in between)
when exposed to UV, emits light and can be captured on a gel doc
only where there is dsDNA, we will see the light being given off → gives bands on gel
gel tank: agarose gel + running buffer (to have electricity be able to move through tank)
black in back! DNA is going to go closest toward black (back end) → negative
runs toward red (red ahead)
power pack supplies power to gel
not same gel tank or power pack we’re using but principles are the same
visualize DNA in gel dock
Gel doc: connected to computer → inside closed container, there is a camera that can sense the light (shows us the image on the computer)
drawer
place drawer
drawer gets closed
that image gets uploaded to OWL
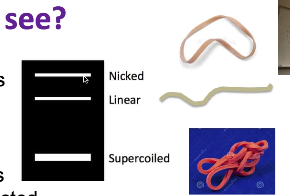
What will we see?
uncut plasmid:
exists in multiple forms (all the sample plasmid but will run differently on the gel because of their conformations)
supercoiled (like a circular rubber band that has been twisted up into lots of tertiary structure) — fastest running form of plasmid
all condensed: will travel the fastest
nicked (one of the strands gets nicked but other is intact—loses supercoiled structure + runs the slowest)
gets hung up more
often occurs because of freezing and thawing
linear (both strands have been cut) — expect for digests (can also happen by chance)
middle band → lowest frequency (fainter bands)
difficult to be linearized without enzyme
amount of band = darkness
may form concatamers so be larger than expected
often get concatamers of different forms (several clumped together)
bigger than we expect
pattern of 3 different bands in uncut plasmid, representing nicked, linear, supercoiled
single and double digests:
single — plasmid cut once so now linear
cut through both strands — represented as appropriate size for plasmid + insert together
one singular band
double — plasmid cut twice so 2 binds
THIS IS THE DIGEST YOU USE TO DETERMINE ORIENTATION
Why Undigested and Single Digests?
both are controls!
if a lane of digested plasmid has extra bands that are the same size as undigested, shows not all the plasmid was digested
if double digest has extra band that are the same size as single digest, who that some of the plasmid was not digested by both enzymes
same size as single digest
some of plasmid was only digested with one of the enzymes (not both)
include both enzymes in single to show that both are actually working
explain away extra bands (if didn’t match up with other lanes, might have problem and can’t analyze gel)
BOTTOM LINE: IT ALLOWS YOU TO TROUBLE SHOOT ANY EXTRA BANDS THAT APPEAR
in either single or double digest lane
enzymes are often not 100% efficient — not all the plasmid is going to be cut by the restriction enzyme
if we have extra bands we can tell if it is what we expected by including controls
if a lane of digested plasmid has extra bands in it and when you look across gel, you can see that they’re the same size in undigested lane, shows that you have some that are intact and not fully digested
gel pictures will be uploaded to OWL
label each lane
identify size of bands using ladder
use band sizes to determine the orientation of the insert for YOUR sample
this will be reported in your lab report
tie this info back to the level of insert product
how would the orientation that you found for this particular sample effect the insert product level?
whether insert is in correct or incorrect orientation — what does that mean for production of insulin in spectrophotometry lab
How to Load a Gel
using a mini-sub cell to perform agarose gel electrophoresis
provides electric current to pass which separates the DNA fragments in the cell
DNA at black electrode to positive, red electrode
place agarose gel into chamber
add electrophoresis running buffers to each end
keep adding until covered by at least 2 mm of buffer
when loading samples, keep tip perpendicular to wells
just inside or just above well (break surface of buffer)
avoid bumping or movement of gel chamber
should see samples migrate