11. Independent Samples t-test + Assumptions
NHST (null hypothesis significance testing) steps
formulate hypothesis:
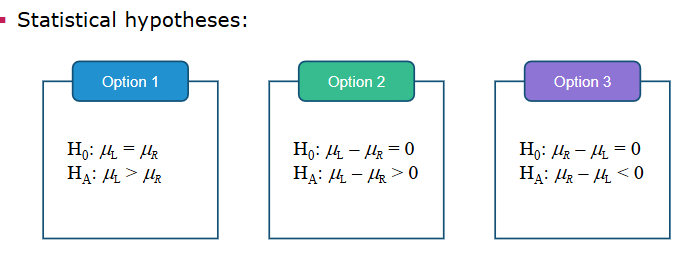
choose test statistic and compute value - indep. or paired samples t-test
calculate probability of result or more extreme, given H0 - p value given by t
decide if reject H0 or not: H0: p > α
(bonus) state conclusion
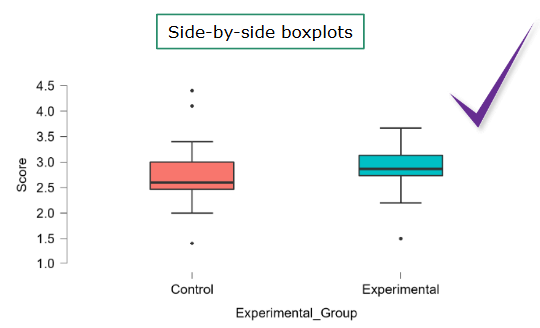
Independent samples t-test - when comparing mean scores of 2 independent groups
is difference small or large? → consider unit of meas. or spread in meas.
t-test uses relative difference bet. groups: mean dif, M1 - M2, spread in scores SD1 and SD2, group sizes n1 and n2
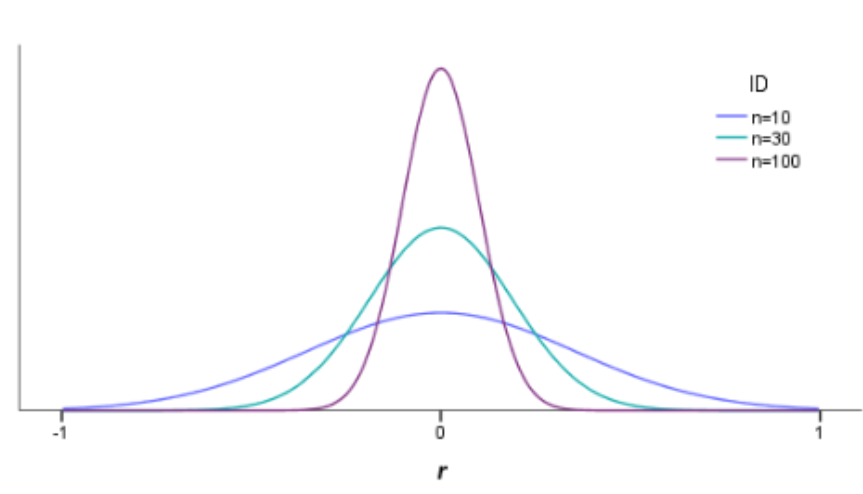
values of M1-M2 varies from sample to sample
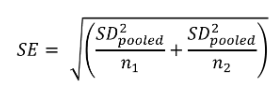
standard error contains group sized (n1 and n2) and spread in scores (SD1 and SD2) - can be estimated for difference in means
standardized score (t): divide M1 - M2 by its standard error
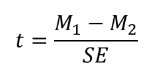
(unit of meas and spread in the meas. no longer play a role)
if lots of samples are drawn from pop where H0 is true → t will often be near 0 (dif. bet. sample means is near 0)
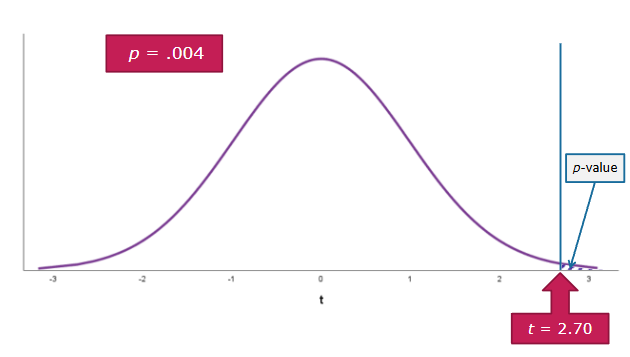
p-value = probability of observing the value of observed test statistic = area under the curve in the tail of distribution
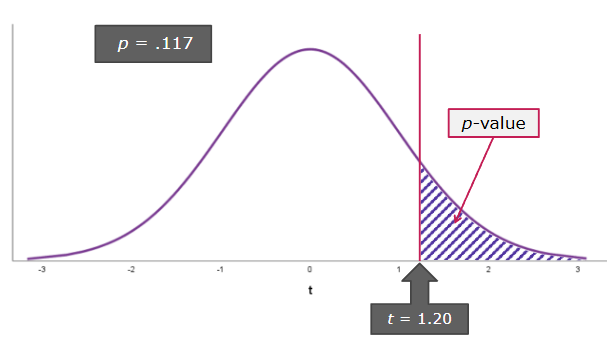
If H0 is true (there is no dif.) → chance of finding a dif. of 2 or larger is .117 → in 11.7% of experiments done with same no. of ppl. we would observe dif. of 2 or larger
Standard error = weighted average of SD in sample 1 and sample 2
depends on group sizes (n1 and n2) and variation in scores (SD1 and SD2)
What influences t-statistic?
numerator: difference in means (M1 - M2)
denominator: SE → variation in scores (SD1 and SD2) and sample sizes per group (n1 and n2)
big dif. in means → larger t
more variation → smaller t
larger sample → larger t
larger t → smaller p
Assumptions
sample is random
DV is interval/ ratio measurement lvl
groups are independent
scores in both groups are normally distributed
scores in both groups have equal spread
If DV is not interval/ratio → Chi-squared test of homogeneity - 2 independent var (DV is categ.) - works the same as other Chi square
this Chi squared test - used to det. if distribution of a categ var. is the same in both groups
To check that groups are independent → also use Chi squared test of homogeneity
Measure of effect size for Chi-square: Cramer’s V [0,1] - measures strength of dependency bet 2 nominal var.
dependent samples (repeated or paired measurements) → paired samples t-test
Paired samples t-test - DV is interval/ration (like other one), but samples are dependent
μD = μafter - μbefore → H0: μD = 0 (D - difference)
Effect size: Cohen’s d

Reporting in APA: t (df) = [value], p = . [smth], effect size: d = [value], 95% CI [values]
Normally distributed scores - check with histograms (2 for independent, 1 for dependent)
If minor deviations or large sample → still use t-test
If large deviation or small sample → use alternative
Equal variances
check with graph
chech with test: Levene’s (when data is normally distributed) , Brown-Forsythe (when data is not normally distributed) , F-max
If variances are not equal → Welch’s test