Taxes & Subsidy
Learning Outcomes
Understand how government taxes and subsidies change market prices and quantities.
Keywords/Points
Taxes: Government takes money from individuals/firms.
Subsidies: Government gives money to individuals/firms.
Excise Tax: Tax on specific goods (e.g., cigarettes).
Supply Curve (SS): Shows how much sellers offer at different prices.
Demand Curve (DD): Shows how much buyers want at different prices.
Equilibrium: Where supply equals demand (stable price and quantity).
Taxes
What is a Tax?
A mandatory payment to the government from individuals or businesses.
Used to fund public services or influence behavior.
Type: Excise Tax
A specific tax on the production or sale of certain goods.
Purpose: Often used to discourage consumption (e.g., alcohol, tobacco) or generate revenue.
Excise Tax: How it Works
Effect on Sellers (Supply):
When an excise (unit) tax is placed on sellers, it's like an extra cost for each unit they sell.
Example: If a shirt costs to make, and there's a tax, the seller now effectively needs to cover costs and maintain profit.
This increases their cost of production.
Key Impact: The Supply Curve (SS) shifts UPWARDS by the exact amount of the tax.
Why? Sellers now require a higher price for the same quantity to cover the tax cost. Or, they will sell less at the old price.
Calculation Example: If a unit tax is imposed and 100 units are sold, the seller pays to the government.
Overall Market Impact:
Supply Decreases: The SS curve shifts up/left.
Equilibrium Changes:
Price for Buyers (): Increases. Buyers pay more.
Quantity Traded (Q): Decreases. Less of the good is bought/sold.
Price for Sellers (): The amount sellers keep after paying the tax decreases.
Resource Allocation: Less resources are used to produce the taxed good.
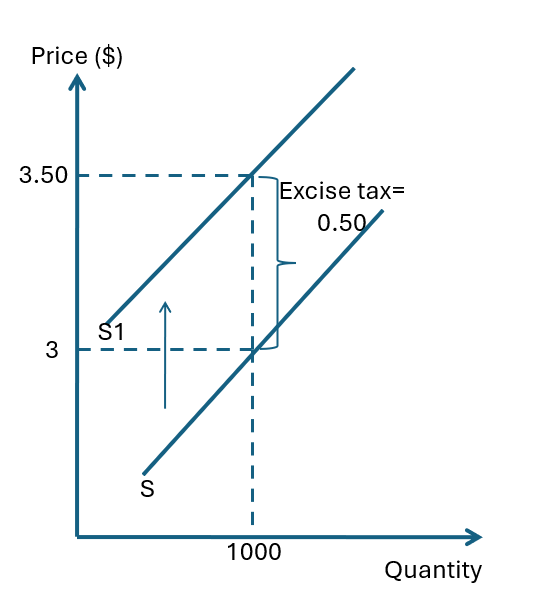
Example: Unit tax of $0.50 is imposed
To produce the same quantity as before, sellers must receive $3.50 to cover the extra cost
This applies at every output level
The supply curve shifts upward by the tax amount ($0.50)
The vertical distance between old and new supply curves = size of the excise tax
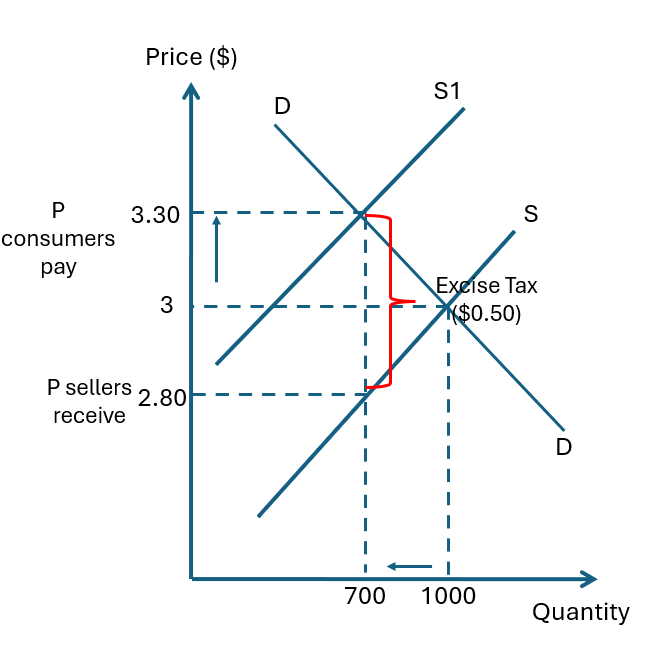
Original equilibrium: Price = $3, Quantity = 1000
Unit tax of $0.50 shifts supply curve upward by $0.50
New equilibrium: Price = $3.30, Quantity = 700
Fewer resources allocated to alcohol production
Both buyers and sellers are negatively affected
Buyers pay a higher price after tax
Sellers receive a lower price after paying tax to the government
Simplified Impact of Excise Tax
Feature | Before Tax | After Tax | Explanation |
|---|---|---|---|
Supply Curve | Original SS | Shifts UP by tax amount | Higher production cost for sellers |
Price (Consumers) | Lower | Higher | Sellers pass on some of the tax cost |
Price (Sellers)* | Higher | Lower (after paying tax to gov) | Sellers receive less net income per unit |
Quantity Traded | Higher | Lower | Higher price reduces demand, lower net profit reduces supply |
Resources | More | Less allocated to this good | Decreased production means fewer resources used |
Price sellers receive = Price consumers pay - Tax |
Practice Question 1:
A government imposes a tax on each pack of cigarettes, levied on sellers. Explain two ways this tax affects the cigarette market
Subsidy
Definition: A subsidy is a financial grant or support provided by the government to individuals or firms.
Purpose: To encourage specific behaviors, production, or consumption (e.g., farming, green energy).
Subsidy to Firms (Producers)
Effect on Sellers (Supply):
When a unit subsidy is given to firms, it's like a reduction in their cost for each unit sold, or an extra income per unit.
Example: If a farmer produces corn, and the government gives them for each bushel, their effective cost is lower, or their revenue is higher.
This decreases their cost of production (or increases profitability).
Key Impact: The Supply Curve (SS) shifts DOWNWARDS by the exact amount of the subsidy.
Why? Sellers are now willing to sell the same quantity at a lower market price because they get additional income from the government, or they will sell more at the old price.
Overall Market Impact:
Supply Increases: The SS curve shifts down/right.
Equilibrium Changes:
Price for Buyers (): Decreases. Consumers pay less.
Quantity Traded (Q): Increases. More of the good is bought/sold.
Price for Sellers (): The amount sellers keep (market price + subsidy) increases.
Resource Allocation: More resources are used to produce the subsidized good.
Simplified Impact of Subsidy to Firms
Feature | Before Subsidy | After Subsidy (given to firm) | Explanation |
|---|---|---|---|
Supply Curve | Original SS | Shifts DOWN by subsidy amount | Lower effective production cost / higher revenue for sellers |
Price (Consumers) | Higher | Lower | Firms pass on some of the subsidy benefit |
Price (Sellers)* | Lower | Higher (market price + subsidy from gov) | Firms receive more total income per unit |
Quantity Traded | Lower | Higher | Lower price attracts more buyers, higher profit encourages more supply |
Resources | Less | More allocated to this good | Increased production means more resources used |
*Price sellers receive = Market price consumers pay + Subsidy |
Practice Question 2:
The government offers a per solar panel subsidy to manufacturers. Describe the effect on the equilibrium price and quantity of solar panels.
Subsidy to Consumers
Effect on Buyers (Demand):
When a unit subsidy is given directly to consumers, it makes the good effectively cheaper for them to buy.
Example: If a public transport ticket costs , and the government gives commuters towards each ticket, the effective cost for the commuter is .
This increases the purchasing power of consumers for that specific good.
Key Impact: The Demand Curve (DD) shifts UPWARDS by the exact amount of the subsidy.
Why? Consumers are now willing to pay a higher market price for the same quantity because their effective personal cost is lower due to the government payment. Or, they will buy more at the old price.
Overall Market Impact:
Demand Increases: The DD curve shifts up/right.
Equilibrium Changes:
Price for Buyers (): The market price increases, but the effective price buyers pay (market price - subsidy) decreases.
Quantity Traded (Q): Increases. More of the good is bought/sold.
Price for Sellers (): The amount sellers receive increases.
Resource Allocation: More resources are used to produce the subsidized good.
Simplified Impact of Subsidy to Consumers
Feature | Before Subsidy | After Subsidy (given to consumer) | Explanation |
|---|---|---|---|
Demand Curve | Original DD | Shifts UP by subsidy amount | Consumers' effective cost is lower, increasing their willingness to buy |
Price (Consumers)* | Higher | Lower (market price - subsidy from gov) | Consumers pay less out of pocket due to government assistance |
Price (Sellers) | Lower | Higher | Increased demand leads to a higher market price for sellers |
Quantity Traded | Lower | Higher | Increased demand results in more goods being bought and sold |
Resources | Less | More allocated to this good | Increased production means more resources used |
*Price consumers pay = Market price sellers receive - Subsidy |
Practice Question 3:
The government gives a voucher to individuals to buy electric bicycles. How does this affect the electric bicycle market's price and quantity?