sensitivity analysis
The sensitivity analysis is just repeating the same analysis by removing the participants that got the drink perception wrong. You would then compare the results to the original analysis and see if it has changed (i.e. statistical significance changes or direction of effects changing).
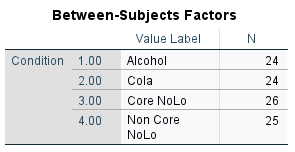
Removing participants that got drink perception wrong:
Non core NoLo condition: 3 deleted for thinking it is alcohol
Core NoLo: 4 deleted for thinking it is alcohol
Alcohol condition: 3 deleted for thinking they watched NoLo products
10 deleted total: 99 total participants
What do we use to indicate the effect size? I’m getting different guidelines (is 0.2 small or large)
ANCOVA OUTPUTS
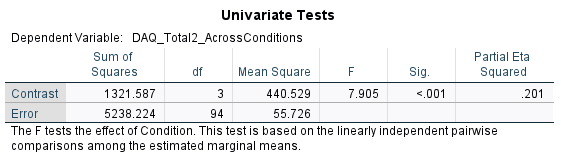
Univariate Analysis of Variance
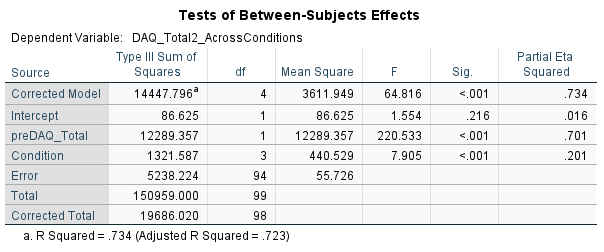
F(3,94)=7.91, p < .001
There is a significant difference in post DAQ [F(3,94)=7.91, p < .001] between the conditions while adjusting for baseline DAQ scores. The effect size for the condition is large.
Estimated Marginal Means
Condition
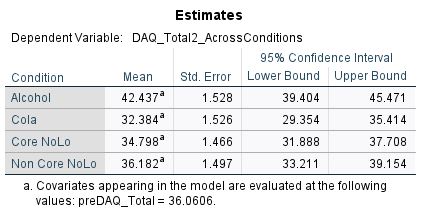
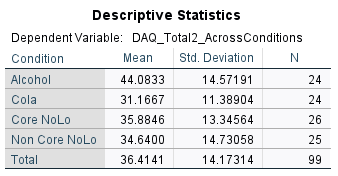
Comparing the estimated marginal means shows that the highest postDAQ scores were seen in the alcohol condition (mean = 42.44).
When excluding participants with incorrect drink perception, the post DAQ scores on average were lower in each condition.
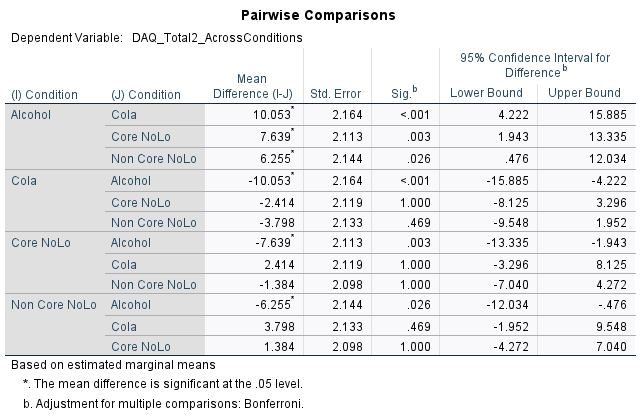
There is a significant difference between the alcohol condition and cola condition (p < .001). There is a significant difference between the alcohol condition and Core NoLo condition (p = .003). There is a significant difference between the alcohol condition and the non-core NoLo condition (p = .026). There are no significant differences between any of the other conditions.
There are still significant differences found between the alcohol condition and the other conditions. The p values are larger, but still significant.
A one-way ANCOVA was conducted to compare postDAQ total scores for four conditions whilst controlling for baseline DAQ scroes. There was a significant difference in postDAQ scores [F(3,94)=7.91, p < .001] between the conditions while adjusting for baseline DAQ scores. Post hoc tests showed there was a significant difference between the alcohol condition and cola condition (p < .001), the alcohol condition and Core NoLo condition (p = .003) as well as the alcohol condition and the non-core NoLo condition (p = .026).
Comparing the estimated marginal means shows that the highest postDAQ scores were seen in the alcohol condition (mean = 42.44).
Comparison:
Still significant difference in Post DAQ between the conditions when excluding and including those who incorrectly perceived the beverages whilst adjusting for baseline DAQ.
When excluding participants with incorrect drink perception, the post DAQ scores on average were lower in each condition
There are still significant differences found between the alcohol condition and the other conditions. The p values are larger, but still significant.