STATISTICS: Bivariate Analysis
Parametric and Non-parametric tests
Parametric test of means
1-sample t-test
1-sample Sign, 1-sample Wilcoxon
2-sample t-test
Non-parametric test of medians
Mann-Whitney U test
One-way ANOVA
Kruskal-Wallis
Bivariate Analysis
Bivariate analysis is a statistical method that involves the analysis of two variables to determine the empirical relationship between them.
It is used to find patterns, relationships, and associations between two variables. This can aid in making predictions and inferences.
Types of Bivariate Analysis
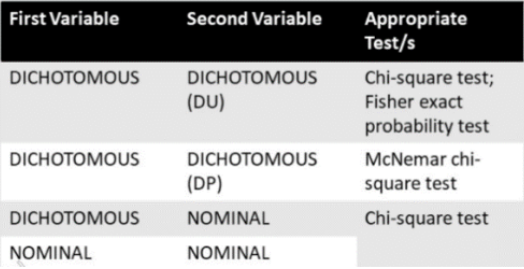
Categorical vs. Categorical: Analysis of relationships between two categorical variables. Common techniques include:
Cross-tabulation (Contingency Tables): Displays the frequency distribution of variables.
Chi-Square Test of Independence: Tests whether there is a significant association between two categorical variables.
Categorical vs. Continuous: Analysis of relationships between a categorical and a continuous variable. Common techniques include:
T-tests: Compare the means of a continuous variable between two groups.
ANOVA (Analysis of Variance): Compare the means of a continuous variable across multiple groups.
Continuous vs. Continuous: Analysis of relationships between two continuous variables. Common techniques include:
Correlation Coefficient: Measures the strength and direction of the relationship between two continuous variables (e.g., Pearson's r).
Scatter Plots: Visual representation showing the relationship between two continuous variables.
Simple Linear Regression: Models the linear relationship between two continuous variables.
Steps in Bivariate Analysis
Define the Variables: Identify the dependent and independent variables.
Select the Appropriate Technique: Based on the types of variables involved.
Visualize the Data: Use scatter plots, cross-tabulations, etc., to explore the relationship.
Compute Statistical Measures: Calculate correlation coefficients, regression parameters, or conduct hypothesis tests.
Interpret the Results: Determine the nature and strength of the relationship and assess its statistical significance.
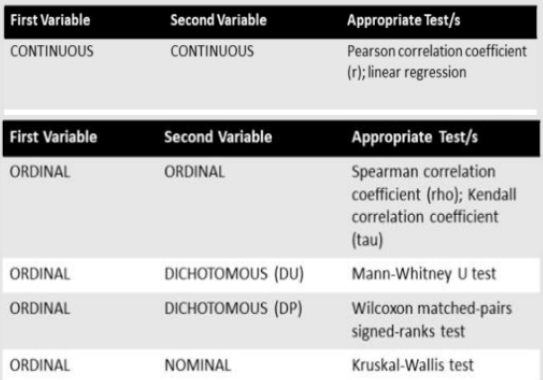
Choice of Appropriate Statistical Significance Test in Bivariate Analysis
(Analysis of One Independent Variable and One Dependent Variable)
Continuous & Other type of Data (Vice versa)
Variable’s Interpretation
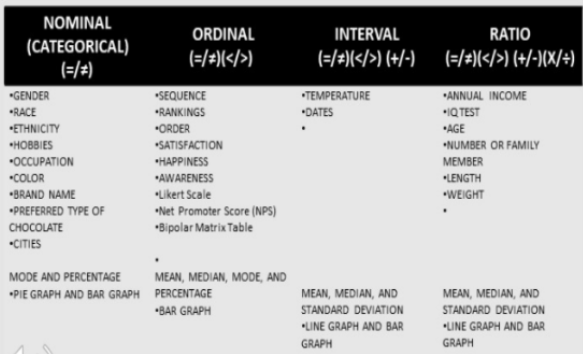
Key Concepts
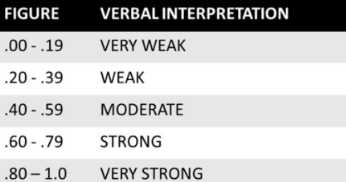
Correlation: Indicates the degree to which two variables move in relation to each other. Correlation coefficients range from -1 to 1, where:
1 indicates a perfect positive relationship.
-1 indicates a perfect negative relationship.
0 indicates no relationship.
Causation vs. Correlation: Correlation does not imply causation. A strong correlation between two variables does not mean one causes the other.
Scatter Plot: A graphical representation where each pair of values is represented by a point in the Cartesian plane. It helps in visualizing the relationship between two continuous variables.
Regression Analysis: A statistical method to model and analyze the relationships between variables. Simple linear regression is used for bivariate analysis to understand how the dependent variable changes as the independent variable changes.
Appropriate Test or Tests of Significance
Pearson Correlation Coefficient
Linear Regression
Spearman Correlation Coefficient (rho)
Kendall Correlation Coefficient (tau)
Mann-Whitney U test
Wilcoxon matched-pairs signed-ranked test
Kruskal-Wallis test
McNemar chi-square test
T-test
ANOVA (F-test)
Pearson’s Correlation Coefficient
the test statistics that measures the statistical relationship, or association, between two continuous variables.
Linear Regression
a basic and commonly used type of predictive analysis. The overall idea of regression is to examine two things:
does a set of predictor variables do a good job in predicting an outcome (dependent) variable?
Which variables are significant predictors of the outcome variable, and in what way do they indicated by the magnitude and sign of the beta estimates-impact the outcome variable?
TYPES OF LINEAR REGRESSION
Simple Linear Regression
Which variables are significant predictors of the outcome variable, and in what way do they indicated by the magnitude and sign of the beta estimates-impact the outcome variable?
Multiple Linear Regression
1 dependent variable (interval or ratio), 2+ independent variables (interval or ratio or dichotomous)
Logistic Regression
1 dependent variable (dichotomous), 2+ independent variable(s) (interval or ratio or dichotomous)
Ordinal Regression
1 dependent variable (ordinal), 1+ independent variable(s) (nominal or dichotomous)
Multinomial Regression
1 dependent variable (nominal), 1+ independent variable(s) (interval or ratio or dichotomous)
Discriminant Analysis
1 dependent variable (nominal), 1+ independent variable(s) (interval or ratio)
Spearman Correlation Coefficient (rho)
The Spearman rank- order correlation coefficient (Spearman's correlation, for short) is a nonparametric measure of the strength and direction of association that exists between two variables measured on at least an ordinal scale.
Interpretation is similar to that of Pearson’s, e.g. the closer is to the stronger the monotonic relationship.
Kendall Correlation Coefficient (tau)
Kendall's tau-b (Tb) correlation coefficient (Kendall's tau-b, for short) is a nonparametric measure of the strength and direction of association that exists between two variables measured on at least an ordinal scale.
Mann-Whitney U test
The Mann-Whitney U test is used to compare differences between two independent groups when the dependent variable is either ordinal or continuous, but not normally distributed.
Wilcoxon matched-pairs signed-ranks test
The Wilcoxon signed-rank test is the nonparametric test equivalent to the dependent t-test. As the Wilcoxon signed-rank test does not assume normality in the data, it can be used when this assumption has been violated and the use of the dependent t-test is inappropriate. It is used to compare two sets of scores that come from the same participants.
Kruskal-Wallis test
The Kruskal-Wallis H test (sometimes also called the "one-way ANOVA on ranks) is a rank-based nonparametric test that can be used to determine if there are statistically significant differences between two or more groups of an independent variable on a continuous or ordinal dependent variable. It is considered the nonparametric alternative to the one-way ANOVA, and an extension of the Mann-Whitney U test to allow the comparison of more than two independent groups.
McNemar Chi-Square test
The McNemar test is used to determine if there are differences on a dichotomous dependent variable between two related groups. It can be considered to be similar to the paired-samples t- test, but for a dichotomous rather than a continuous dependent variable. However, unlike the paired-samples t-test, it can be conceptualized to be properties of a testing two different repeated measure dichotomous variable, as is explained below.
Chi-Square test
The Chi Square statistic is commonly used for testing relationships between categorical variables. The null hypothesis of the Chi-Square test is that no relationship exists on the categorical variables in the population; they are independent.
T-test
A t-test is a statistical test that is used to compare the means of two groups.
TYPES OF T-TEST:
One-sample, two-sample, or paired t-test?
Paired t-test
Two-sample test (independent t-test)
One-sample t-test
One-tailed or two-tailed t-test?
Two-tailed t-test
One-tailed t-test
ANOVA (F-test)
The F-test is most often used when comparing statistical models that have been fitted to a data set, in order to identify the model that best fits the population from which the data were sampled.
ANOVA is a particular form of statistical hypothesis testing heavily used in the analysis of experimental data.
ANOVA is used in the analysis of comparative experiments those in which only the difference in outcomes is of interest.
The statistical significance of the experiment is determined by a ratio of two
variances.
Model Assumptions
Normality: Many bivariate tests (e.g., Pearson correlation, t-tests) assume that the data are normally distributed. This can be checked using normality tests or plots (e.g., Q-Q plot).
Linearity: Assumption that the relationship between variables is linear, which can be assessed using scatter plots or correlation coefficients.
Homoscedasticity: The variance of residuals should be constant across all levels of the independent variable. Check this assumption with residual plots.
Independence: Observations should be independent of each other. This is crucial for valid inferential statistics.
Interpreting Results
Effect Size: Beyond statistical significance, the strength of the relationship is important. For correlations, the effect size can be understood through the magnitude of the correlation coefficient.
Confidence Intervals: Provide a range within which the true value of the parameter lies with a certain level of confidence. For correlations, this helps in understanding the precision of the estimate.
p-Value: Indicates the probability that the observed relationship is due to chance. A p-value less than 0.05 is typically considered statistically significant.
Applications
Business and Economics: Analyzing the relationship between sales and marketing expenditure, or price and demand.
Healthcare: Studying the relationship between patient age and recovery time, or smoking and lung cancer incidence.
Social Sciences: Investigating the relationship between education level and income, or social media use and mental health.
Challenges and Consideration
Outliers: Can significantly affect the results of bivariate analysis.
Non-linearity: Relationships may not always be linear, requiring different analytical techniques.
Confounding Variables: Other variables might influence the relationship, requiring multivariate analysis for better understanding.
Ethical Considerations
Bias and Fairness: Ensure that the analysis is free from biases. Consider the impact of the findings and avoid reinforcing stereotypes or inequalities.
Transparency: Report all methods and findings transparently, including any assumptions, limitations, and the context of the data.