Human Population Dynamics and Sustainability
Human Population Growth and Its Dynamics
Overpopulation
Global human population has seen significant growth historically:
1975: 5.6 billion
1994: 5.6 billion
2017: 7.6 billion
Projected:
2030: 8.6 billion
2050: 9.8 billion
2100: 11.2 billion
Carrying Capacity- The maximum number of individuals an environment can sustain.
Thomas Malthus (1798) posited that populations would exceed Earth’s carrying capacity due to limited resources.
Current debates among scientists regarding human adaptability through innovation and technology.
Factors Driving Population Change
Demography- Study of populations, fertility, life expectancy, age structure, and migration.
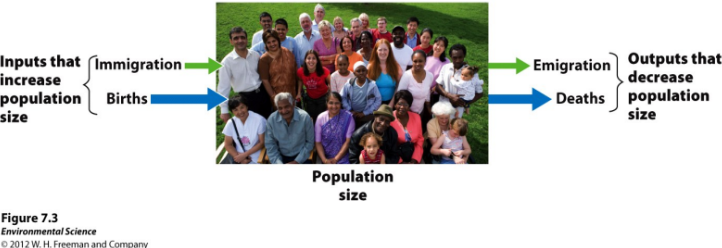
Changes in Population Size
Immigration- Movement of people into a country increases population.
Emigration- Movement of people out of a country decreases population.
Key Demographic Metrics:
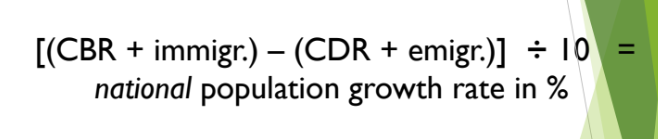
Crude Birth Rate (CBR)- Number of births per 1000 individuals per year.
Crude Death Rate (CDR)- Number of deaths per 1000 individuals per year.
Population Growth Rate Calculation- (CBR - CDR) / 10
Doubling Time: Time taken for a population to double:
Example: If the growth rate is 2%, doubling time = 70 / growth rate = 35 years.
rule of 70
Fertility
Total Fertility Rate (TFR): Average number of children born per woman.
Replacement Level Fertility: Rate needed to maintain current population size
Typically slightly above 2 due to mortality rates.
Also known as 0 population growth
Developed nations: TFR ≤ 2.1
Developing nations: TFR > 2.1 needed to offset higher mortality.
Life Expectancy
Life Expectancy- The average lifespan of individuals in a given year and location
Linked to healthcare quality as it is higher in countries with better health care
Infant Mortality Rate: Deaths of children under 1 year per 1000 live births.
Child Mortality Rate: Deaths of children under 5 years.
Life expectancy is a good indicator of resource consumption rates and environmental impacts, as the higher the population, the more resources will be consumed, leading to impacts on the surrounding environment.
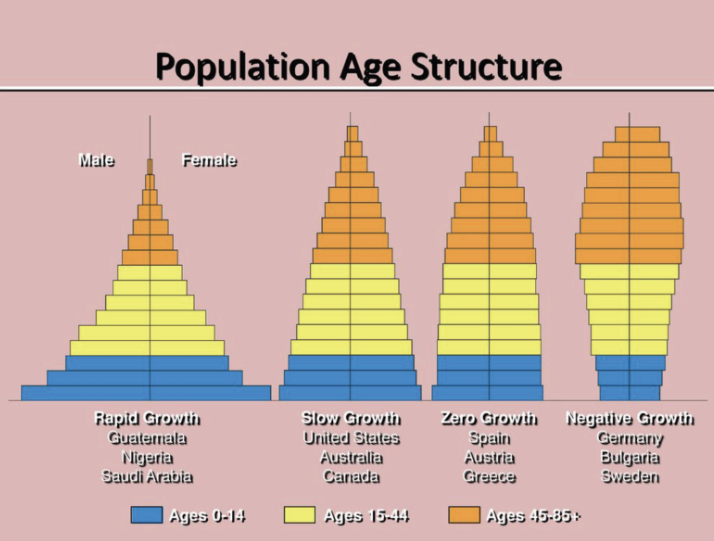
Age Structure
Age structure- diagrams that represent a country’s age distribution amongst genders
Migration
Migration influences population dynamics significantly:
Causes include conflict, natural disasters, and economic opportunities.
Net Migration Rate: Difference between immigrants and emigrants per 1000 people.
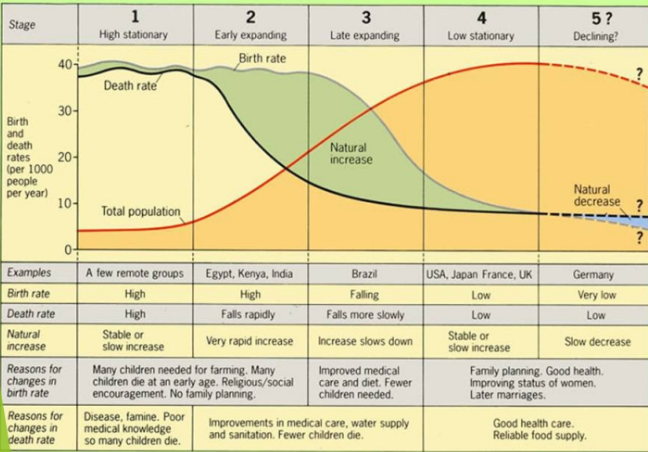
The Demographic Transition Model
Describes transitions in population growth alongside economic development:
Stage 1 (High Stationary): High birth and death rates result in stable population.
Slow population growth because there are high birth rates and high death rates that offset each other.
Stage 2 (Early Expanding): High birth rates, declining death rates lead to rapid growth.
Rapid population growth because birth rates remain high but death rates decline due to better sanitation, clean drinking water, increased access to food and goods, and access to health care.
Stage 3 (Late Expanding): Birth rates decline as the economy and education improve.
Stable population growth as the economy and educational system improve and people have fewer children.
Stage 4 (Low Stationary): Low birth and death rates stabilize population.
Declining population growth because the relatively high level of affluence and economic development encourages women to delay having children.
Potential Stage 5 (Declining): Population may decline due to very low birth rates.
not always included on graphs
Family Planning and Its Impact
Family planning techniques, including birth control, help regulate birth rates.
Education levels in men and women are correlated with TFR.
Higher education leads to lower TFR
Ecological Impact of Population and Affluence
IPAT Equation:
I (Impact) = P (Population) × A (Affluence) × T (Technology)
Highlights how human lifestyles affect environmental change.
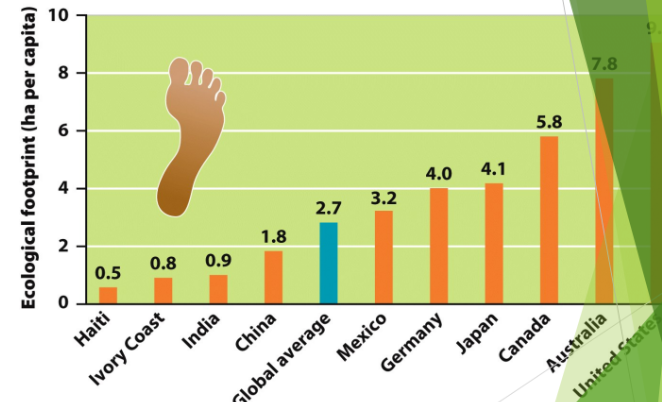
Ecological Footprints
Affluence: having a lot of wealth such as money, goods, or property. It is created by economic opportunity.
Gross domestic product (GDP)- the value of all products and services produced in a year in that country.
GDP is made up of consumer spending, investments, government spending, and exports minus imports.
Urbanization and Resource Consumption
Urban populations, while comprising half of the global populace, consume three-fourths of the resources.
Sustainable Development
The balance between development and environmental health is crucial as unsustainable practices can exacerbate poverty and resource depletion.
Sustainable development aims to improve living standards without compromising future resource availability.
Review Questions
What factors determine the carrying capacity of the environment?
Food supply and resources compared to the population and its consumption rate.
Distinguish immigration and emigration.
Immigration is people moving into a country, while emigration is people moving out.
Define crude birth rate
Crude Birth Rate is the number of births for every 1000 people per year.
What are the main factors influencing population growth?
population size
birth plans
fertility
life expectancy
age structure
In which phase does population decline?
The population declines in stage 4 (or 5).