Western Blot Diary 20th Nov 2024
In the lab today we worked on the Bradford Assay and preparing our standards and pipetting onto a well plate to read the absorbance readings on a plate reader
Why is Bradford assay related to our dissertation?
we need to determine the concentration of the proteins
The Bradford assay is a widely used, colorimetric protein quantification method based on the binding of a dye, Coomassie Brilliant Blue G-250, to proteins. This assay is simple, fast, and effective for estimating the concentration of proteins in a solution.
ChatGPT
In this procedure we have to prepare the standards which we will place for the standard curve. To create the standards we used serial dilutions and created this table below. However we first created the stock solution of BSA.
Materials we used during the practical :
Bovine Serum Albumin (BSA) powder
An appropriate buffer = phosphate-buffered saline, PBS
Micropipettes and tips.
Volumetric flasks or tubes. Documented
BSA STOCK SOLUTION PROCEDURE:
Calculate the Mass of BSA Required:
Desired concentration = 10 mg/mL.
Total volume = 100 mL.
FORMULA TO CALCULATE BSA WEIGHT
Example: Mass of BSA required (mg) = Desired concentration (mg/mL)× Volume (mL)
Example: Mass of BSA = 10 mg/mL × 100 mL = 1000 mg OR (1 g) BSA Mass
However. In our lab we did: MASS = 10 mg/mL x 2 mL
Therefore the mass we need in this practical was: = 20 mg of BSA powder
Weigh the BSA:
We Used a precision balance to measure 0.02 g of BSA powder accurately which is the same as 20 mg of BSA powder.
Dissolve the BSA:
We Added the weighed BSA to a container with approximately 80–90 mL of PBS buffer.
We Mixed thoroughly using a magnetic stirrer and by gentle shaking until the BSA is completely dissolved.
Adjust the Final Volume:
We Transfer the solution to a 100 mL volumetric flask
Then Added remaining PBS buffer to bring the total volume to 100 mL on the volumetric flask.
Mix Again:
Ensure the solution is homogeneous meaning evenly distributed throughout the liquid by stirring or gently inverting the flask.
If not homogenous in a Bradford assay, an uneven solution can result in incorrect protein concentration readings.
PREPARING STANDARD CURVE KNOWN CONCENTRATIONS
Once we prepared our stock solution it is time to prepare dilute our stock solutions into known concentraions for the standard curve
Use the following formula to calculate dilutions: C1 x V1 = C2 x V2
C1 = 10mg/mL (stock concentration)
C2 = Desired concentration (in mg/mL) (e.g 0.05 mg/mL)
V2 = 1 mL (final volume)
We have to Solve for V1:
Here was our example dilution table for a stock solution of 10 mg/mL and 1 mL final volume
IMPORTANT
We multiply (C2 x V2) then we divide by the final volume (V2) to find V1
C1 is implied through the table as 10 mg/mL
To find diluent volume we need to do a calculation
Therefore we will need to do FINAL VOLUME - STOCK VOLUME = DILUENT VOLUME
The diluent volume, this will be the remaining PBS buffer to dilute the BSA stock volume
Final Concentration (mg/mL) (C2) | Stock Volume (V1) (µL) | Diluent Volume (µL) | Final Volume (µL) (V2) |
0.05 | (0.05×1000)/10 = 5 µL | 1000 − 5 = 995 (µL) | 1000 |
0.1 | (0.1×1000)/10 = 10 µL | 1000−10 = 990 (µL) | 1000 |
0.2 | (0.2×1000)/10 = 20 µL | 1000−20 = 980 (µL) | 1000 |
0.3 | (0.3×1000)/10 = 30 µL | 1000−30 = 970 (µL) | 1000 |
0.4 | (0.4×1000)/10 = 40 µL | 1000−40 = 960 (µL) | 1000 |
0.5 | (0.5×1000)/10 = 50 µL | 1000−50 = 950 (µL) | 1000 |
0.6 | (0.6×1000)/10 = 60 µL | 1000−60 = 940 (µL) | 1000 |
0.8 | (0.8×1000)/10 = 80 µL | 1000−80 = 920 (µL) | 1000 |
1.0 | (1.0×1000)/10 = 100 µL | 1000−100 = 900 (µL) | 1000 |
1.2 | (1.2×1000)/10 = 120 µL | 1000−120 = 880 (µL) | 1000 |
1.4 | (1.4×1000)/10 = 140 µL | 1000−140 = 860 (µL) | 1000 |
MICROPLATE PROCEDURE
The next step once we finished with our standards was to pipette them onto a 96 well-plate.

We pipetted 10 µL of EACH STANDARD in triplicate onto the well plate
Then added 200 µL of Bradford Plus Assay Reagent into the well plate with the standard
Unknown Protein Samples
These unknown proteins concentrations was prepared by Dr. Caprifico
These proteins were kept in freezer at -20 degrees to ensure that the proteins do not denatured because it wont be able to react with the Bradford assay to give the colimetirc change.
Pipette Technique
We learned the importance of using the pipette and how to hold it correctly
We made sure every sample was dispensed in the corner of the well to avoid droplets on the side wall
This is to make sure all the sample can mix and react with the reagenets and able to give a clear reading on the plate reader at the final stage
Avoiding cross contamination with the tips of the pipettes.
Any cross contamination will relsut in coulr chamnge happening too early which. e.g. contaminating the Bradford assay can result in early colour change which can give poor readings in the plate reader in the end stage.
Also poor contamination control can cause wasategfe or reagent whihc costs more money to buy for the staff at the university
PLATE READER FINAL STAGE
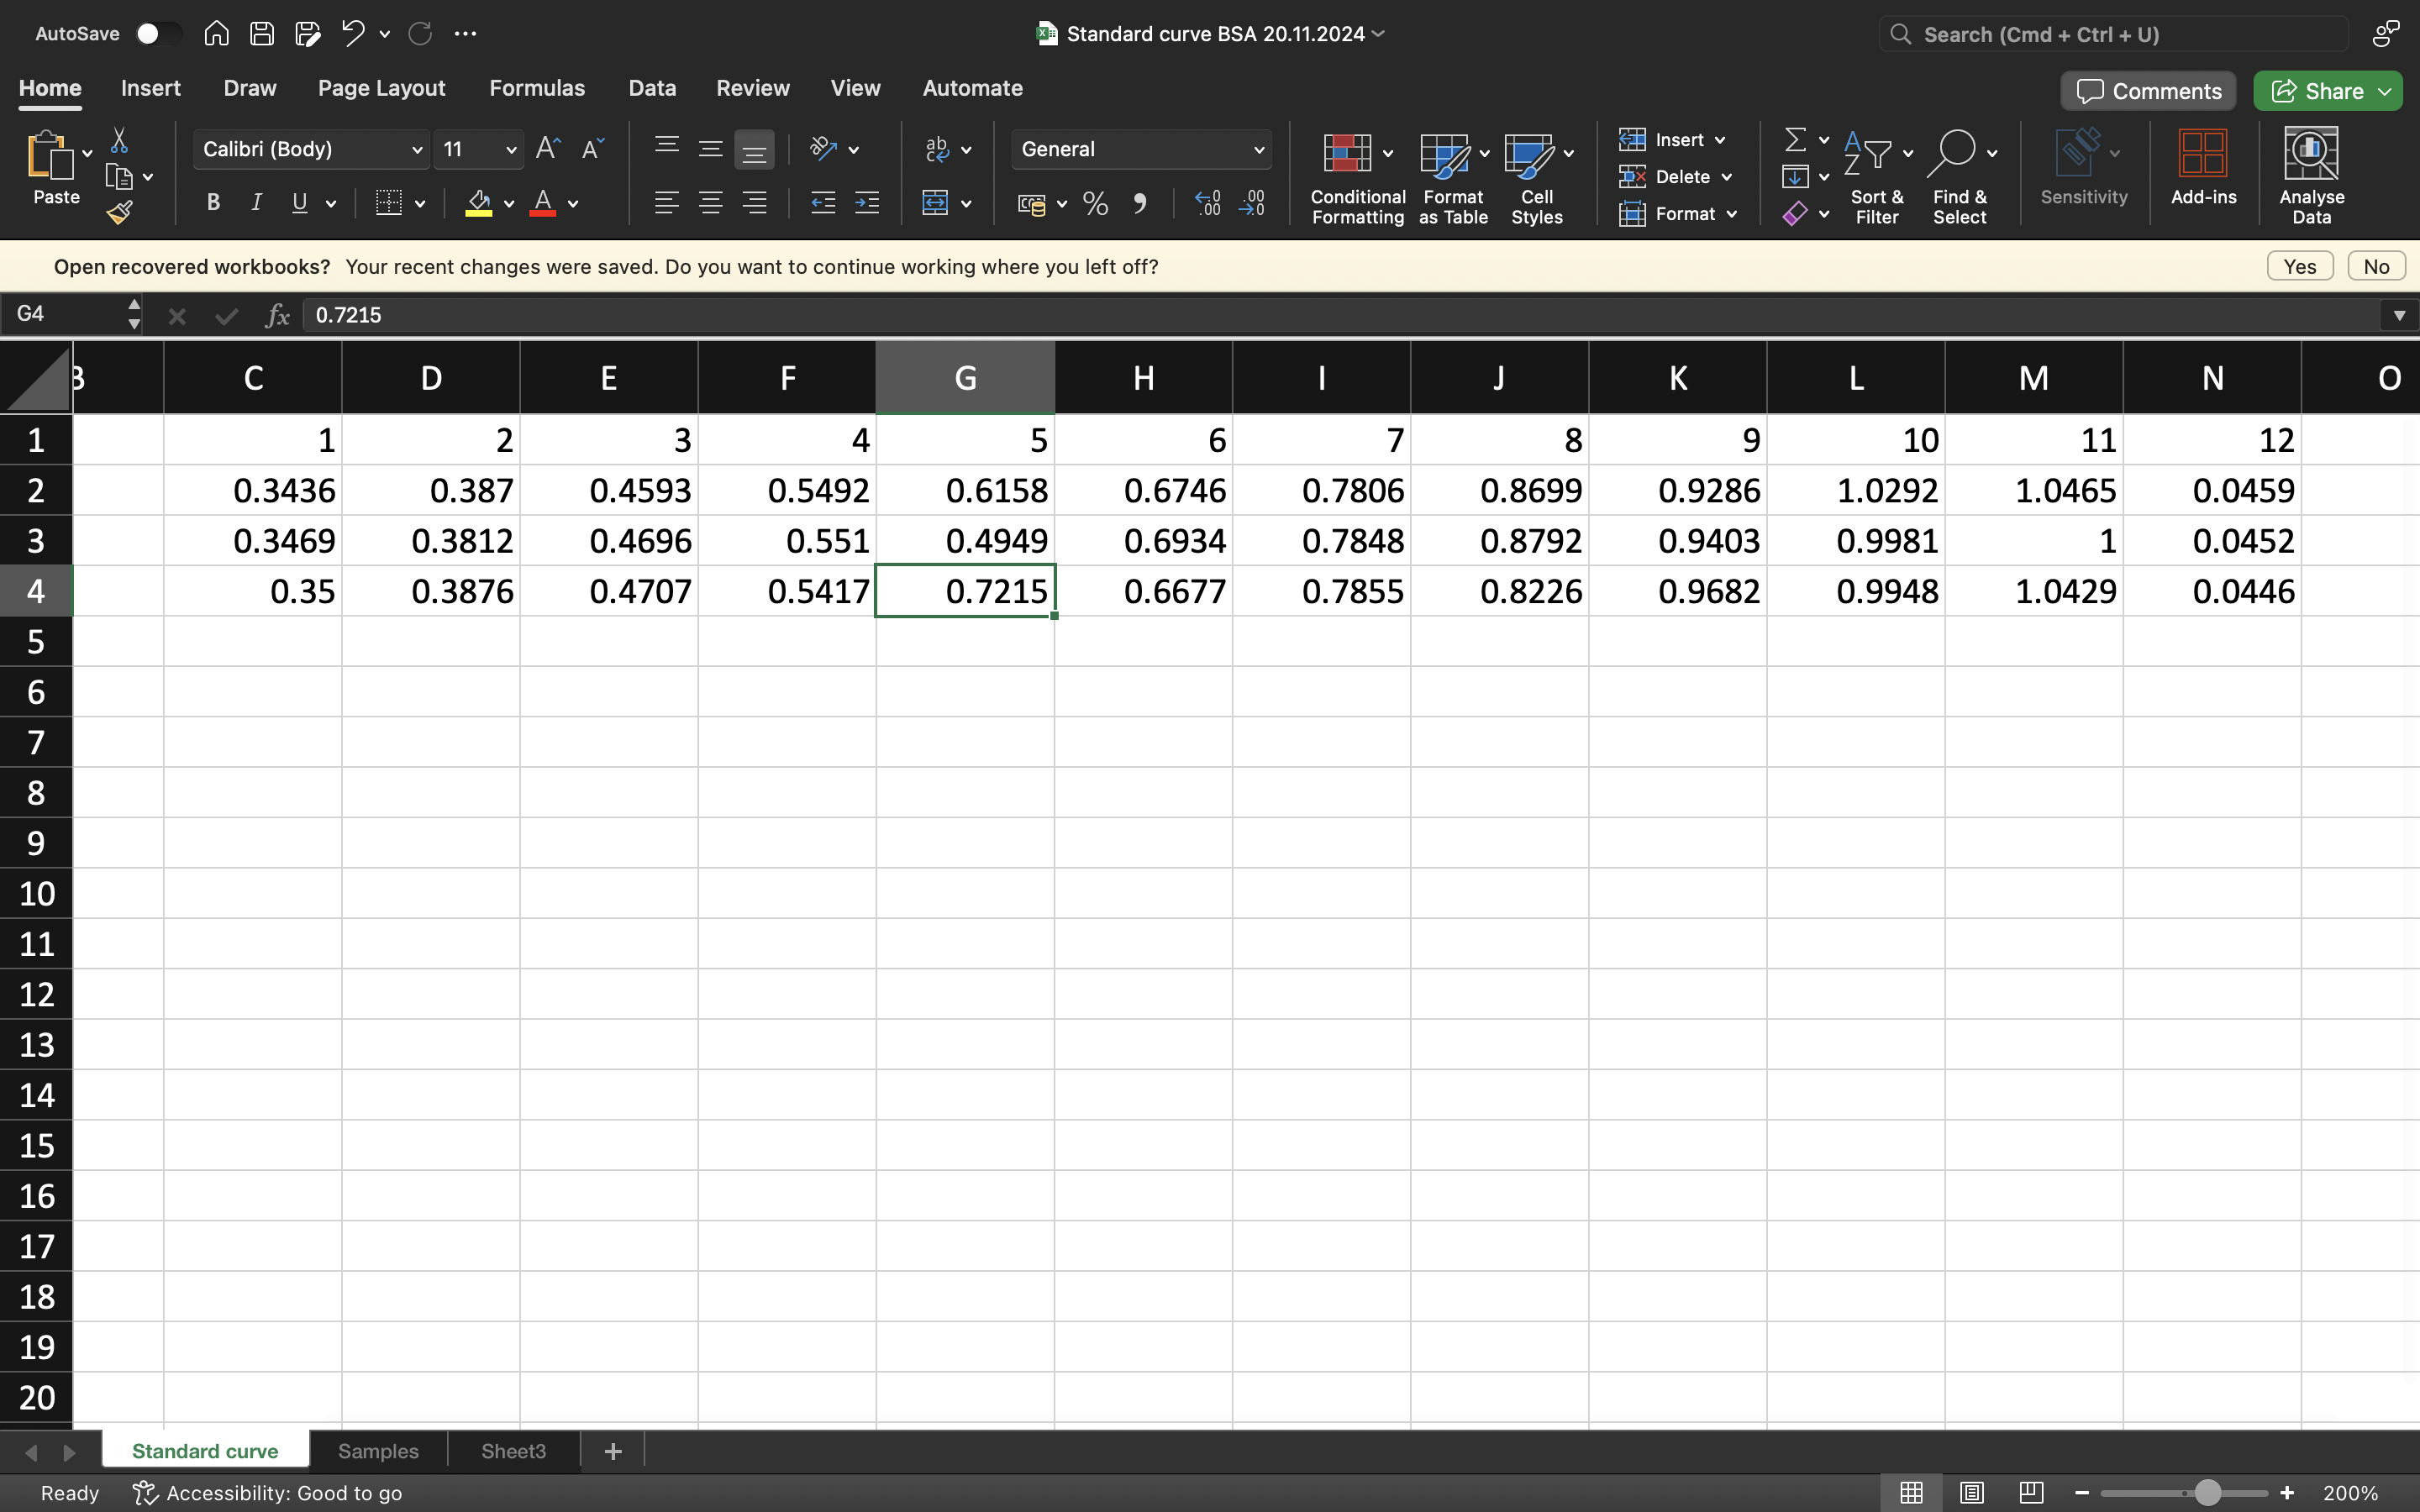
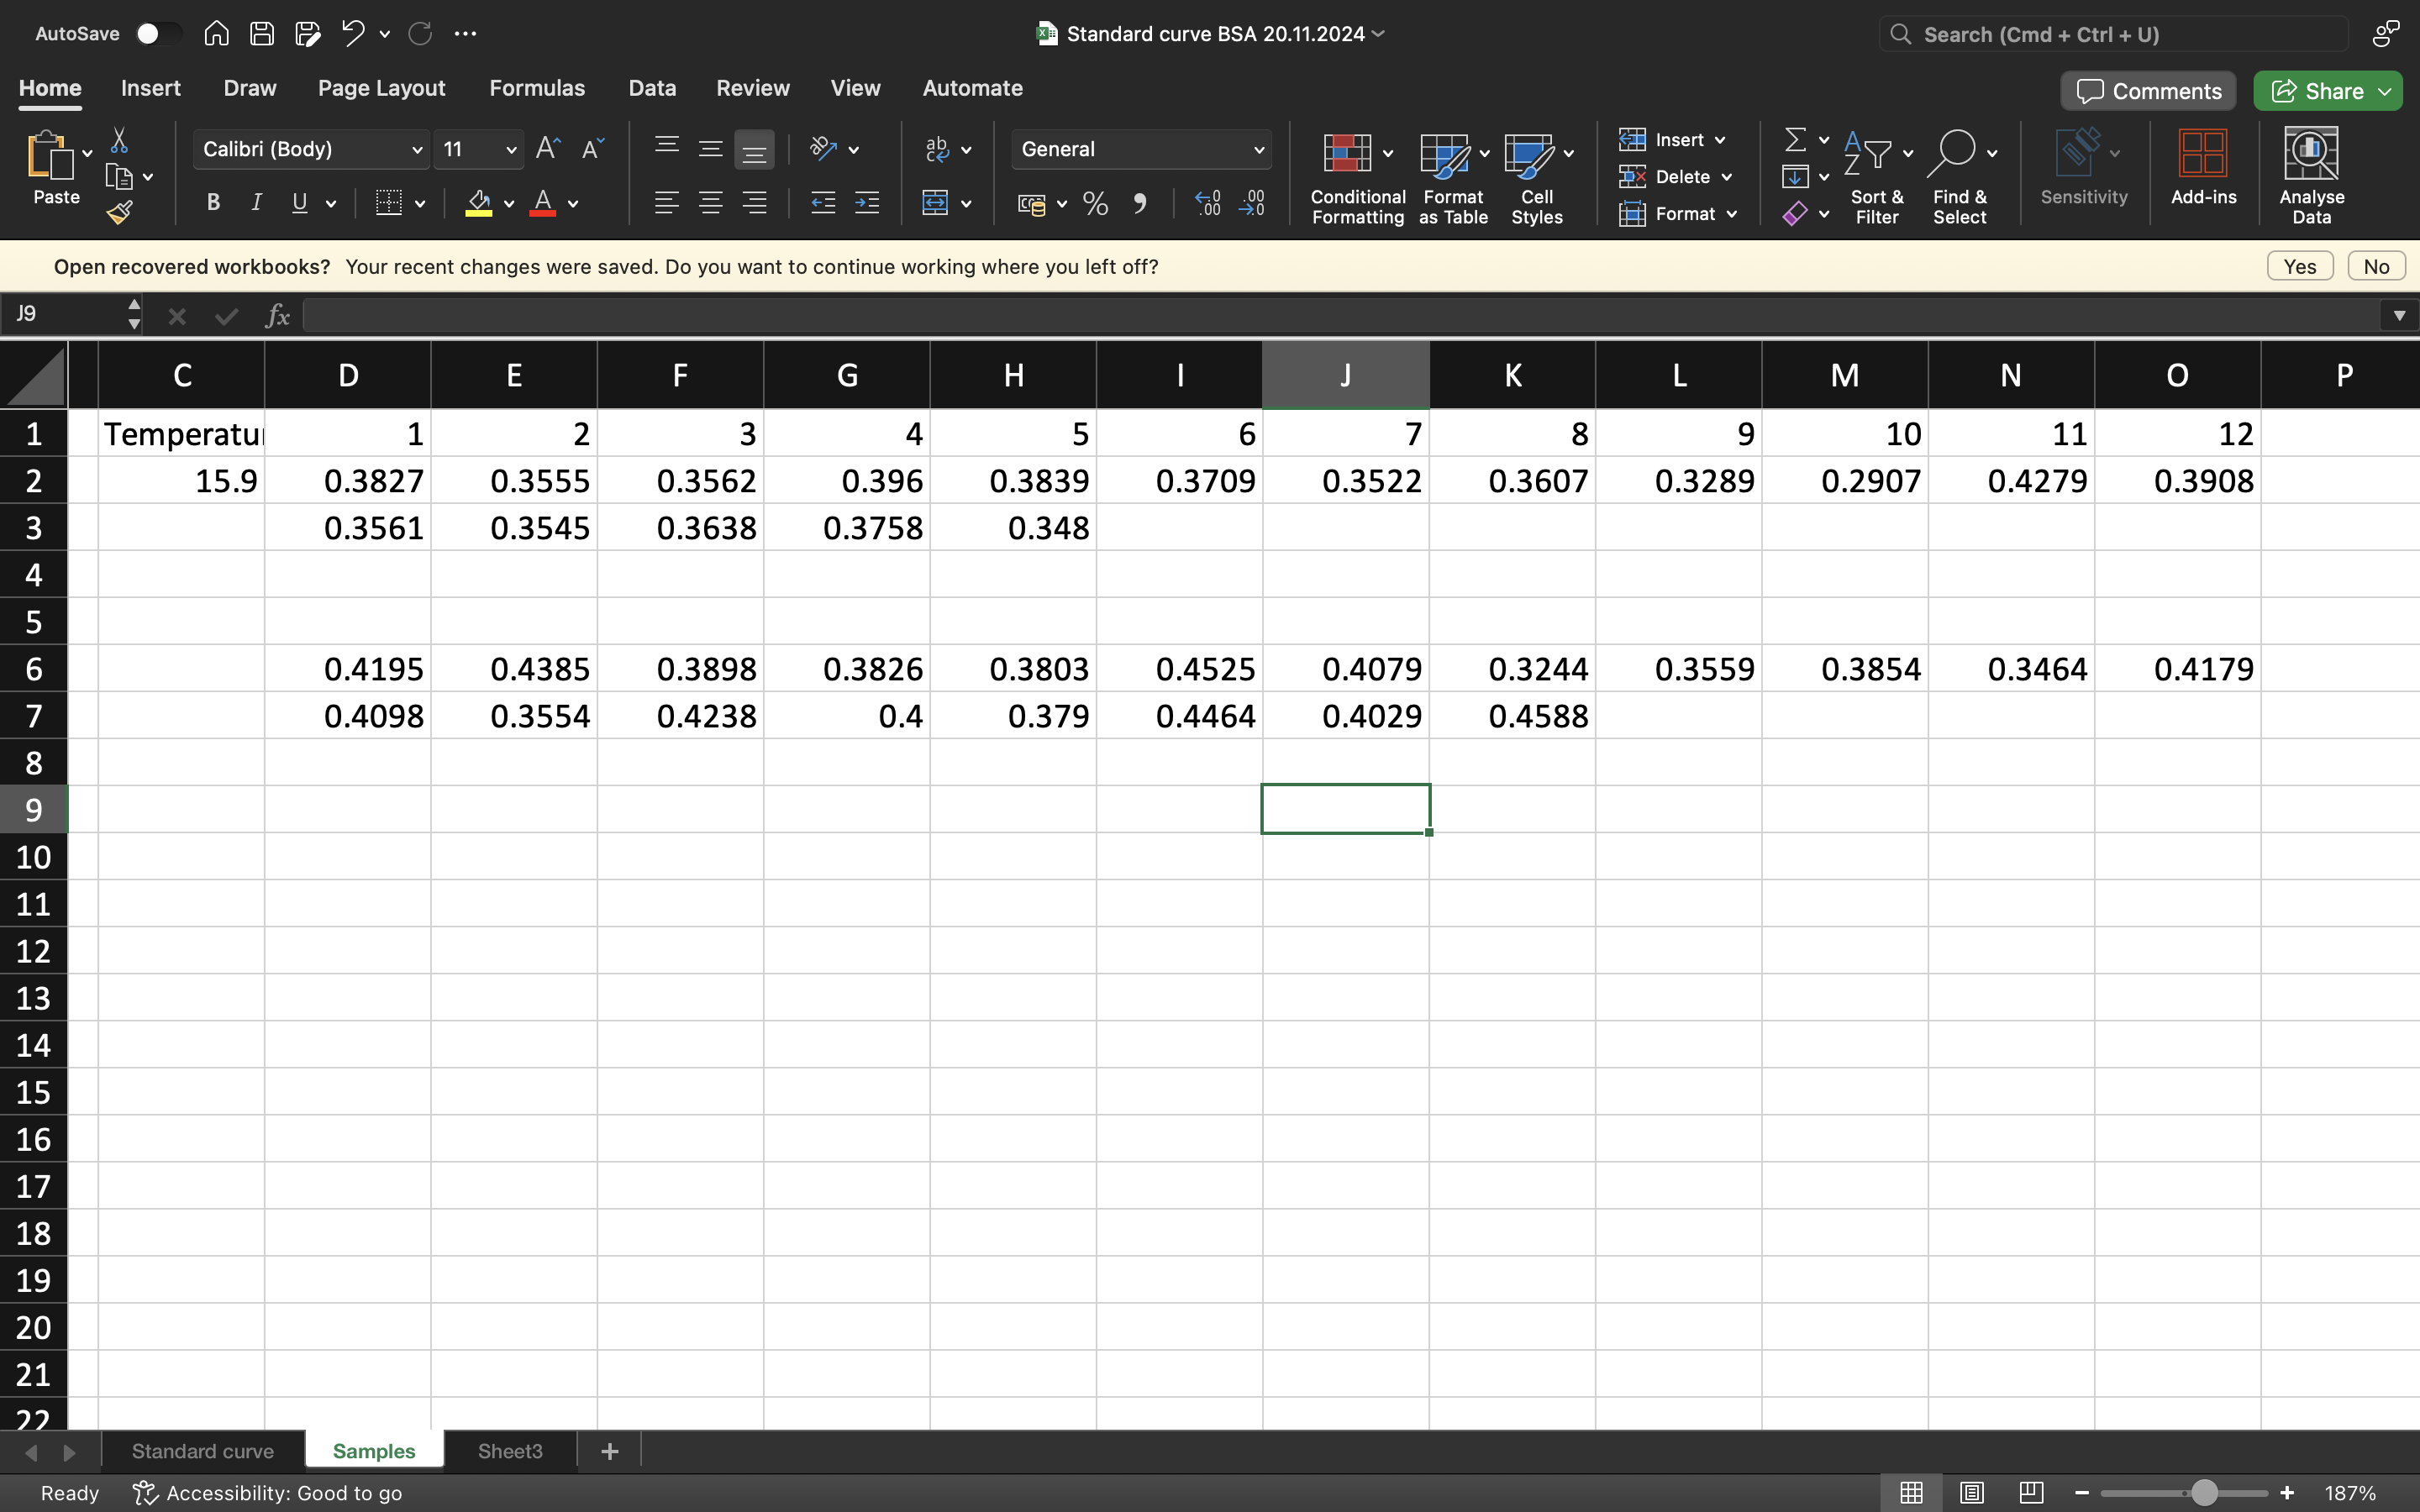
Finally after completing the standards and our proteins which have all been reacting with the Bradford assay and 10 mins incubation, we can use a plate reader to gather the absorbance data and create a standard curve on Excel.

EXCEL RESULTS