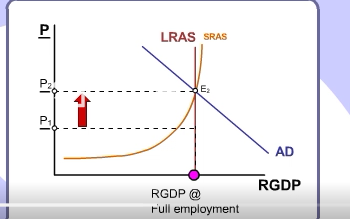
Long run AD/AS equilibrium
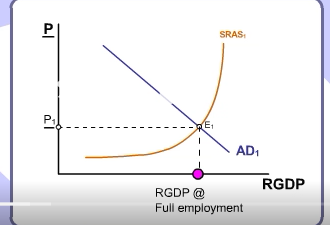
Full employment
on the right most edge of the AS curve is full capacity, and is the maximum amount of production possible in any given period.
Full capacity and full employment are not the same
Full capacity refers to all factors of production in an economy being used efficiently, while full employment indicates that all available labor resources are being utilized, but it does not necessarily mean that all resources are being used at their maximum potential.
full employment is the highest level of real GDP an economy can maintain without an increase in prices. cyclical unemployment is zero, but structural and frictional are still present.
Those that are cyclically unemployed are out of work due to fluctuations in RGDP, because if it is below full capacity, firms are producing less goods and services, thus there are less workers.
those that are structurally unemployed are out of work due to changes in the economy that create a mismatch between the skills of the workforce and the needs of employers, often resulting from technological advancements or shifts in consumer demand.
Frictional unemployment, on the other hand, occurs when individuals are temporarily unemployed while transitioning between jobs or entering the workforce for the first time, reflecting the normal labor market dynamics.
A reason that structural unemployment causes price increases is that as certain industries decline, the workers who are unable to find new jobs in emerging sectors may lead to a decrease in overall labor supply, which in turn can push wages higher for the remaining jobs, contributing to inflationary pressures.
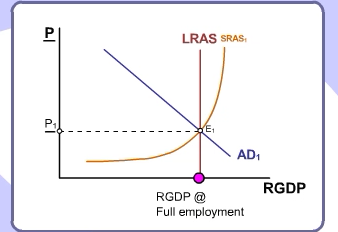
Long run AS
In the long-run, the AS is a vertical line at the full employment level of real GDP because it reflects the economy's maximum sustainable output, where all resources are utilized efficiently without generating inflation. It is also the lowest level of unemployment that can be sustained. Also called the NRU
If unemployment falls below that level, there is inflation.
This curve has no regard for price level.
When the AD curve is added, the equilibrium price level can be found.
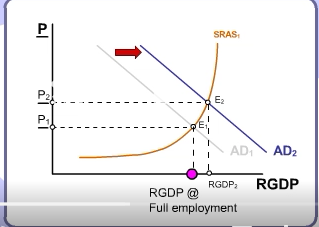
Changes in LRAS
An economy in long-run equilibrium is also in short-run equilibrium. So you can leave a point on the horizontal axis (in place of the LRAS line), and make a short-run AS curve.
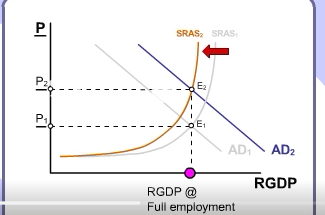
Suppose any factor that affects the AD curve were to occur, it would shift the AD curve either to the right or left, leading to a new equilibrium price level and output in the short run, before ultimately returning to the long-run equilibrium determined by the LRAS, through natural economic processes.
Process of the whole thing:
The LRAS curve can shift due to the same changes that bows the PPC out (a more educated workforce, more workforce, more capital equipment, decreased trade barriers and new tech).
This curve does not show inflation or RGDP growth, but is a “snapshot“ of the economy at a specific point in time, indicating the potential output and price level that the economy can sustain in the long run.