Financial Statement Analysis Notes
Learning Objectives
Understanding the financial statement analysis is crucial for evaluating a company’s performance. The goals of this analysis can be summarized in several key learning objectives:
LO1: Understand and explain the process of financial analysis.
LO2: Identify common contexts for financial statement analysis, emphasizing the need for awareness of context.
LO3: Recognize the importance of understanding the business when analyzing financial statements.
LO4: Identify types of information utilized in financial statement analysis and their sources.
LO5: Explain various perspectives used in the analysis, which includes retrospective, prospective, trend, and cross-sectional analysis.
LO6: Identify and interpret different metrics, including common-size analysis and ratio analysis.
LO7: Calculate and interpret liquidity, activity, solvency, profitability, and equity ratios.
LO8: Understand some limitations of ratio analysis.
LO9: Describe commonly used non-IFRS financial measures and other performance indicators.
Definition of Financial Statement Analysis
Financial statement analysis is the systematic process of evaluating a company’s financial health based on its financial statements, which include:
Statement of Financial Position
Statement of Income
Statement of Cash Flows
Statement of Changes in Equity
Notes to Financial Statements
This analysis aims to signal aspects like financial health, cash flows, and operating efficiency, helping stakeholders make informed decisions.
Steps in Statement Analysis
The process for analyzing financial statements consists of several essential steps:
Purpose and Context: Define why the analysis is being carried out and the context surrounding it.
Collect Information: Gather requisite information needed for analysis.
Analysis: Conduct common-size analyses and calculate various ratios or metrics.
Interpretation: Analyze and interpret the collected metrics to derive meaningful insights.
Conclusions and Recommendations: Draw conclusions based on analysis and suggest actionable recommendations.
Context for Statement Analysis
The context of the analysis is vital and can differ based on the analyst’s objectives:
Investment Analyst: Evaluates for buying or investing decisions.
Commercial Lender: Assesses creditworthiness and compliance with covenants.
Credit Department: Determines customer credit terms.
Companies: Looking at acquisitions or partnerships.
Pension Funds: Seeking ongoing investment opportunities.
Understanding the Business
To effectively analyze financial statements, an analyst must grasp several aspects of the business:
Operational Activities: Understand the primary operations and how they function.
Economic Conditions: Recognize the underlying economic factors and risks pertinent to the industry.
Strategy: Identify whether the company aims to be a low-cost provider or follows a differentiation strategy.
Key Success Factors: Focus on critical factors that impact the company’s success and health.
Finding Relevant Information
Analysts should utilize the following sources of information for effective financial analysis:
Annual report descriptions of the business and management discussion and analysis (MD&A).
Financial statements, paying attention to the auditor’s report and significant accounting policies noted in the financial statement notes.
Financial Statement Analysis Perspectives
Prospective Analysis: This forward-looking analysis aims to predict future outcomes, making it particularly valuable for lenders assessing potential loans. However, inherent unpredictability poses a challenge.
Retrospective Analysis: It leverages historical data to forecast future scenarios and includes trend and cross-sectional analysis, though it may be less reliable under changing economic conditions.
Trend Analysis vs. Cross-Sectional Analysis: Trend analysis looks at the same company's results over time to identify patterns, while cross-sectional analysis compares results across multiple companies within the same industry.
Financial Data Utilization
When conducting analysis:
Financial data should stem from actual financial statements.
A minimum of two years of data may be necessary for accurate comparative analysis.
Common-Size Analysis
This method converts financial statement values into percentages, facilitating easier comparisons. For example, a common-size income statement expresses each line item as a percentage of total revenues.
Ratio Analysis
Ratio analysis is crucial for comparing a company's performance over time or against industry peers, allowing for meaningful comparisons even across different sizes of companies. Common categories include liquidity, activity, solvency, profitability, and equity analysis ratios.
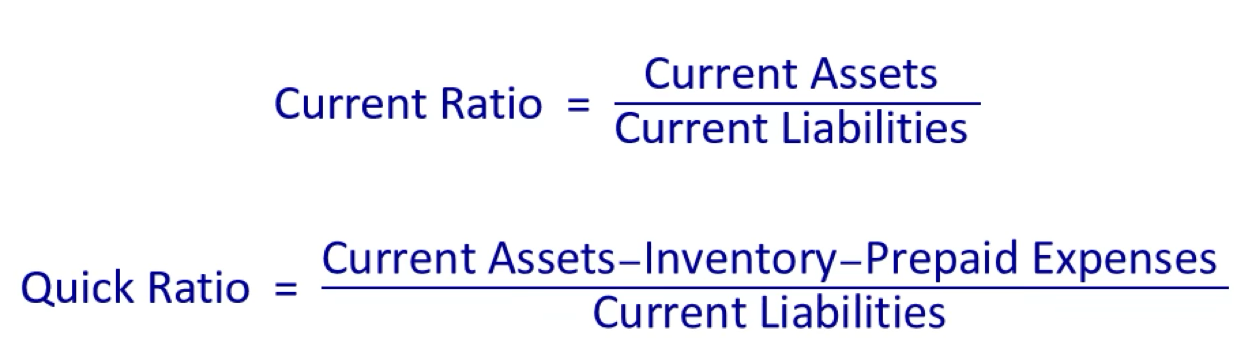
Liquidity Ratios
Measure a company’s ability to convert assets into cash. Key ratios include:
Activity Ratios
Provide insights into operational efficiency, including:
Accounts Receivable Turnover
Inventory Turnover
Accounts Payable Turnover
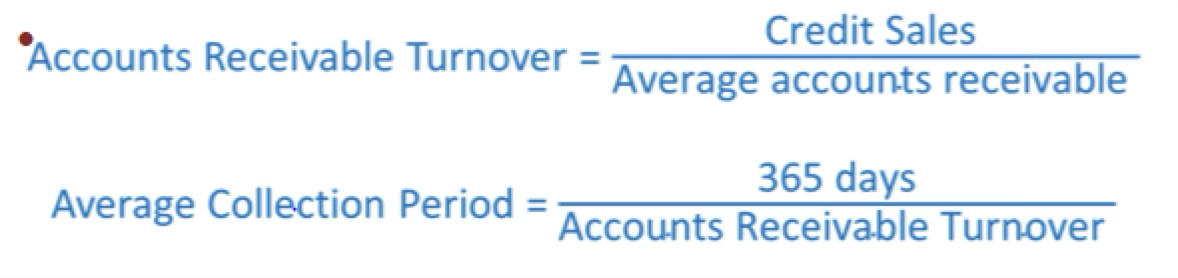
Sometimes necessary to assume all sales are credit sales
Should be compared to company’s credit terms
Large sales at end of reporting period may distort turnove

Tells you how fast inventory is sold, or
How many days, on average, does it take to sell inventory

Provides information about the company’s payable policy
Cost of goods sold can sometimes replace credit purchases
Alternately, can adjust COGS for the change in inventory levels and determine purchases.
Solvency Ratios
Measure long-term financial stability, including:

Measures the amount of debt a company has relative to its shareholders’ equity

This measures the total portion of financing represented by debt

Measures the company’s ability to cover interest expense from earnings
This ratio provides comfort to lenders that the company can pay the interest on debt
Profitability Ratios
Assess overall performance through measures such as Gross Margin, Profit Margin, Return on Assets (ROA), and Return on Equity (ROE).

Measures the profit remaining after product costs available to cover other operating costs

Measures net profit earned on each $1 in sales

Measures the return on the resources provided by the investors

Measures the return on the assets that are used by the company
Earnings Per Share - two types: Basic vs Diluted

Diluted Earnings per Share:
The amount that earnings per share would become if all of the dilutive convertible securities were converted to common shares

Compares the price per share on the stock market with the company’s earnings per share
Companies with high growth expectations or low levels of risk will have higher P/E multiples
Dividend Payout:

Measures the portion of income paid out as dividends

Measures the dividends an investor will receive relative to the price per share
The dividend payout ratio can also indicate a company's strategy, as a higher ratio may suggest a focus on returning profits to shareholders, while a lower ratio might indicate reinvestment in growth opportunities.
Limitations of Ratio Analysis
Accounting Policies: Different companies use various accounting policies that may skew ratio comparisons.
Potential Manipulations: Creative accounting may distort ratios.
Seasonality: Certain businesses may experience seasonal fluctuations that impact comparisons.
Non-IFRS Financial Measures
Examples include free cash flow, EBITDA, and net debt. Cautions include the lack of standard definitions/operators and potential inconsistencies across companies.
This comprehensive understanding of financial statement analysis equips analysts and stakeholders to make informed assessments of a company’s financial health and performance.