AP GOV CHAPTER 4 - CONGRESS
📚 AP GOV CHAPTER 4 — CONGRESS
Detailed Notes + Pictures/Graphs + What They Mean
🏛 4.1 — Congress and Its Powers
Congress
Congress is the Legislative Branch of the federal government. It is created by Article I of the Constitution.
Congress is bicameral, which means it has two chambers:
House of Representatives
Senate
Congress's main jobs include:
Making laws
Controlling government spending
Representing citizens and states
Checking the executive branch through oversight
Using its constitutional powers to influence national policy
👥 A Tale of Two Congresspeople
What the picture is showing:
The PowerPoint compares María Salazar and Yadira Caraveo, who were both members of the 118th Congress.
Salazar was a Republican from Florida.
Caraveo was a Democrat from Colorado.
Both are daughters of Hispanic immigrants.
Both had experience outside of Washington.
Both worked on issues involving immigration and domestic policy.
⭐ Why this matters for AP Gov:
This connects to representation.
Members of Congress can have:
Different political parties
Different backgrounds
Different opinions
Different states and districts
Even though they are different, they are both responsible for representing their constituents.
🏠 House of Representatives vs. Senate
House | Senate |
|---|---|
435 voting members | 100 members |
2-year terms | 6-year terms |
Members represent districts | Senators represent entire states |
Representation based on population | Every state gets 2 senators |
More structured rules | More flexible debate |
More directly affected by public opinion | Longer terms provide more stability |
Important number:
435 = total voting members of the House
100 = total senators
Easy way to remember:
House = population
Senate = states
⚖ Powers of Congress
Expressed/Enumerated Powers
These are powers specifically written in the Constitution.
Examples:
Tax
Borrow money
Regulate interstate commerce
Declare war
Coin money
Establish post offices
Implied Powers
These are powers that are not directly written, but are reasonably connected to Congress's expressed powers.
They come from the:
Necessary and Proper Clause
Also called the Elastic Clause.
It allows Congress to make laws necessary and proper for carrying out its constitutional responsibilities.
⚔ Checks and Balances
Congress can check the other branches.
Congress can:
Override a presidential veto with a 2/3 vote in both chambers
Impeach federal officials
Confirm or reject presidential nominations through the Senate
Approve treaties through the Senate
Conduct investigations and oversight
Control government spending
Impeachment
House of Representatives → impeaches
Senate → holds the impeachment trial
A 2/3 vote in the Senate is needed to convict and remove an official.
🗺 4.2 — Apportionment and Redistricting
Apportionment
Apportionment is the process of dividing the 435 House seats among the states based on population.
The Census happens every 10 years.
Population changes can cause states to:
Gain House seats
Lose House seats
Stay the same
🗺 2020 Census Apportionment

Share
What this map shows:
The map shows which states gained or lost House seats after the 2020 Census.
Dark blue = gained 2 seats
Striped blue = gained 1 seat
Gray = no change
Orange = lost 1 seat
For example:
Texas gained seats.
Florida gained a seat.
California lost seats.
New York lost seats.
Pennsylvania lost seats.
⭐ What you need to understand:
Population movement changes political representation.
Remember:
Census → Apportionment → Redistricting
The census counts the population.
Apportionment determines how many House seats each state gets.
Redistricting redraws the district boundaries inside states.
✏ Redistricting
Redistricting means redrawing congressional district boundaries.
States usually redraw districts after the census because population changes can make the old districts unequal.
🦎 Gerrymandering

Share
Gerrymandering
Gerrymandering is drawing voting district boundaries in a way that gives an advantage to a particular group.
Partisan Gerrymandering
Partisan gerrymandering means drawing districts to help one political party.
The weird-looking district in the picture is an example of how districts can be drawn into unusual shapes to benefit a political party.
⭐ Why it matters:
Gerrymandering can create districts that are very safe for one party.
This can contribute to the incumbency advantage because an incumbent may have an easier time winning reelection.
👥 Racial Gerrymandering

Share
Racial Gerrymandering
This involves drawing district boundaries with the goal of increasing the likelihood that members of a racial or ethnic minority can elect candidates they support.
Majority-Minority District
A majority-minority district is a district where voters from a racial or ethnic minority group make up the electoral majority.
⚖ Shaw v. Reno (1993)

Share
Shaw v. Reno
Shaw v. Reno (1993) is an important Supreme Court case about racial gerrymandering.
Remember:
Shaw v. Reno → Racial Gerrymandering
The case placed constitutional limits on the use of race when drawing congressional districts.
🗳 Incumbency Advantage
An incumbent is someone who already holds political office.
Incumbents often have advantages when running for reelection.
Why?
They usually have:
Name recognition
Experience
Campaign connections
Media attention
Relationships with constituents
Casework experience
Casework
Casework means helping individual constituents with problems involving the government.
Franking Privilege
The franking privilege allows members of Congress to send official mail to constituents without paying normal postage.
🏛 4.3 — Congressional Leadership
House Leadership
Speaker of the House
The Speaker of the House:
Leads the House
Helps set the legislative agenda
Controls important House procedures
Is usually the most powerful member of the House
Majority Leader
Helps organize the majority party and its legislative goals.
Minority Leader
Leads the minority party.
Whips
Whips:
Count votes
Communicate with party members
Encourage members to support the party's position
📋 Congressional Committees
Committees allow Congress to divide up its huge workload.
There are several types.
Standing Committee
A permanent committee that focuses on a specific policy area.
Examples:
Agriculture
Armed Services
Budget
Judiciary
Veterans Affairs
Foreign Affairs
Joint Committee
Contains members from both the House and Senate.
Conference Committee
Created when the House and Senate pass different versions of the same bill.
Its job is to help create a version that both chambers can agree on.
Select Committee
Usually temporary and created for a specific purpose, such as an investigation.
📋 Standing Committees

Share
What this table means:
Congress has many different committees that specialize in different areas.
For example:
House
Agriculture
Appropriations
Armed Services
Budget
Judiciary
Transportation and Infrastructure
Ways and Means
Senate
Agriculture
Appropriations
Armed Services
Budget
Finance
Foreign Relations
Judiciary
Veterans Affairs
⭐ Why committees matter:
Congress has hundreds of members and deals with thousands of issues.
Committees allow members to specialize in certain topics.
📝 4.4 — How a Bill Becomes a Law
Basic process:
1. Bill is introduced
A member of Congress introduces a bill.
↓
2. Bill goes to committee
The committee studies the bill.
↓
3. Committee action
Members may hold hearings, make changes, and decide whether to move the bill forward.
↓
4. Floor debate and vote
The House or Senate debates and votes.
↓
5. Other chamber considers it
The other chamber goes through a similar process.
↓
6. Differences are resolved
If the House and Senate passed different versions, they may use a conference committee.
↓
7. President
The president can:
Sign it
Veto it
Take no action
🗣 Filibuster
A filibuster is extended debate in the Senate used to delay or prevent action on a bill.
Cloture
Cloture is the procedure used to end a filibuster.
Important number:
60 senators
Under the Senate rule discussed in the PowerPoint, 60 votes are needed for cloture.
Easy memory:
Filibuster = keep talking/delay
Cloture = stop the debate
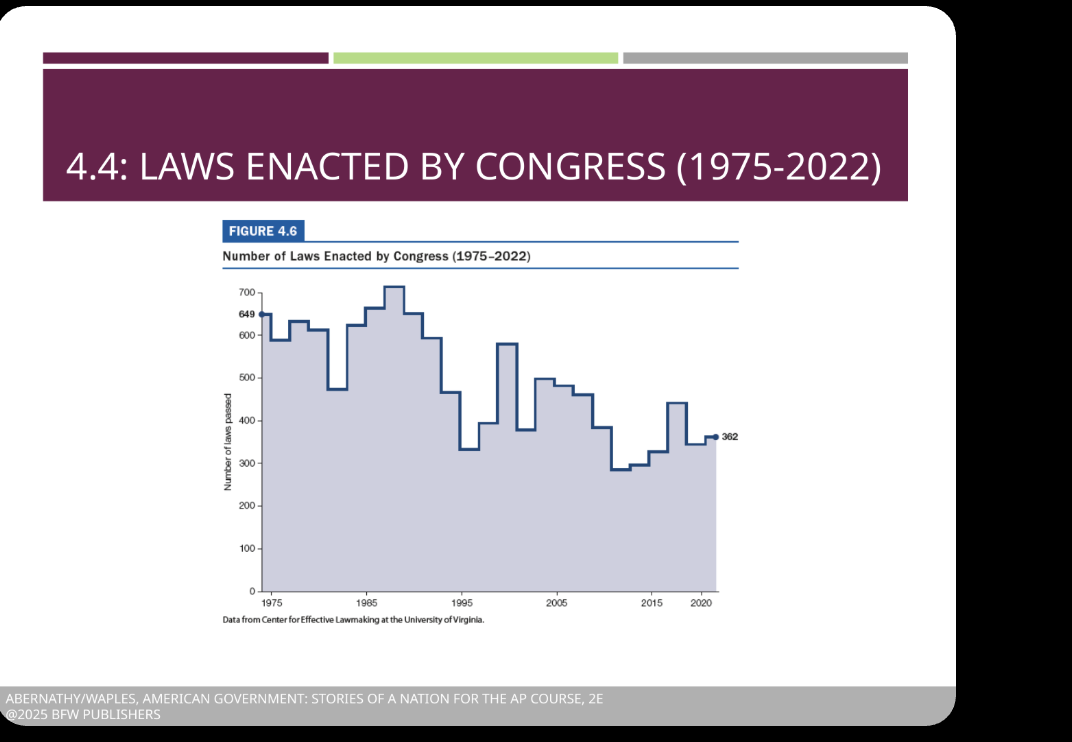
📉 Laws Enacted by Congress
Share
What the graph shows:
The graph shows the number of laws enacted by Congress from 1975–2022.
The number changes a lot over time.
The graph generally shows that Congress has enacted fewer laws in some recent periods compared with some earlier periods.
⭐ Why this matters:
Congress does not always pass laws easily.
Factors such as:
Partisanship
Political disagreements
Divided government
Filibusters
Different views in the House and Senate
can make lawmaking harder.
AP Gov connection:
Gridlock = difficulty passing legislation because of political disagreement.
💰 4.5 — Federal Budget
Fiscal Year
The federal government's fiscal year runs from:
October 1 → September 30
Mandatory Spending
Mandatory spending is spending required by existing laws.
Examples include major entitlement programs such as Social Security.
Congress has less short-term flexibility over mandatory spending because changing it often requires changing existing laws.
Discretionary Spending
Discretionary spending is spending that Congress decides on through the annual appropriations process.
📈 Federal Budget Graph

Share
How to read this graph:
The graph shows the federal budget balance as a percentage of GDP.
Above zero:
Surplus
The government is bringing in more revenue than it spends.
Below zero:
Deficit
The government is spending more money than it receives.
The graph shows that the federal government has experienced many deficits over time.
It also shows a particularly large deficit around 2020 and continued projected deficits.
💵 Deficit vs. Debt
This is VERY important.
Deficit
A deficit happens when:
Government spending > Government revenue
It describes a shortfall during a particular period.
Debt
Debt is the total amount the government owes from accumulated borrowing over time.
Easy way to remember:
Deficit = yearly shortfall
Debt = accumulated total
👵 Social Security

Share
The picture shows Ida May Fuller, the first person to receive a Social Security benefit.
Her first check was $22.54 in January 1940.
Social Security
Social Security is an entitlement program.
It is funded primarily through payroll taxes.
The PowerPoint discusses concerns about the future of Social Security as the number of people receiving benefits changes compared with the number of workers paying into the system.
Options discussed in the PowerPoint:
Raise payroll taxes
Raise the age for collecting benefits
Change/privatize the system through investments
⭐ AP Gov connection:
Social Security is connected to:
Mandatory spending + entitlement programs + federal budget debates
🥧 Federal Spending

Share
2022 Federal Budget
According to the PowerPoint:
66% = Mandatory spending
26% = Discretionary spending
8% = Net interest
What the pie chart shows:
The largest part of the federal budget is mandatory spending.
That is important because mandatory spending is difficult to reduce quickly.
Congress would generally need to change the laws that create or control these programs.
⭐ Test tip:
If you see this chart and are asked:
"Which category is the largest?"
➡ Mandatory spending
🏛 4.6 — Representation
Members of Congress have to decide how closely they should follow their constituents.
There are three major models.
👥 Delegate
A delegate votes based on what their constituents want.
Easy way:
Delegate = "I represent what YOU want."
🧠 Trustee
A trustee uses their own judgment to decide what they believe is best.
Easy way:
Trustee = "I use my own judgment."
⚖ Politico
A politico combines the delegate and trustee approaches.
They may:
Listen to constituents
Use their own judgment
Consider their political party
Consider other political pressures
Easy way:
Politico = balances different pressures.
👤 Descriptive vs. Substantive Representation
Descriptive Representation
This focuses on who the representatives are.
For example:
Race
Ethnicity
Gender
Background
The Diversity in Congress graph is connected to this concept.
Substantive Representation
This focuses on what representatives actually do for their constituents.
Easy memory:
Descriptive = WHO they are
Substantive = WHAT they do
🟥 Partisanship
Partisanship means strong loyalty to a political party.
Members may vote with their party on many issues.
🚧 Gridlock
Gridlock happens when political disagreement makes it difficult for Congress to pass legislation.
Gridlock can be caused by:
Partisan disagreement
Polarization
Divided government
House/Senate disagreements
Senate procedures such as the filibuster
Easy memory:
Gridlock = government gets "stuck."
⭐ CHAPTER 4 — MOST IMPORTANT THINGS TO MEMORIZE
Numbers
435 → House members
100 → Senators
2 years → House term
6 years → Senate term
10 years → Census
60 → Votes needed for cloture under the Senate rule discussed
2/3 → Needed in both chambers to override a presidential veto
Important Terms
Bicameral → Two chambers
Apportionment → Dividing House seats among states
Redistricting → Redrawing district boundaries
Gerrymandering → Drawing districts to create an advantage
Partisan gerrymandering → Helps a political party
Racial gerrymandering → Race is heavily considered in drawing districts
Incumbent → Person currently holding office
Casework → Helping constituents with government problems
Filibuster → Extended Senate debate used to delay/block action
Cloture → Procedure to end a filibuster
Standing committee → Permanent committee
Joint committee → House + Senate members
Conference committee → Resolves differences between House/Senate bills
Select committee → Temporary/special committee
Mandatory spending → Required by existing laws
Discretionary spending → Congress decides through appropriations
Deficit → Spending is greater than revenue
Surplus → Revenue is greater than spending
Debt → Accumulated amount owed
Delegate → Follows constituents
Trustee → Uses own judgment
Politico → Balances different approaches
Descriptive representation → Who representatives are
Substantive representation → What representatives do
Gridlock → Government gets stuck because of disagreement
⚖ COURT CASES TO KNOW
Baker v. Carr (1962)
➡ Connected to representation/apportionment and redistricting
Shaw v. Reno (1993)
➡ Connected to racial gerrymandering
⭐ Biggest visual connections to remember
Diversity graph → Descriptive representation
Census map → Apportionment
Weird district picture → Partisan gerrymandering
North Carolina district map → Racial gerrymandering
Committee table → Congressional committees
Laws graph → Lawmaking/gridlock
Budget graph → Surplus vs. deficit
Social Security picture → Entitlement/mandatory spending
Pie chart → Mandatory vs. discretionary spending