Summary Problem - Segment Reporting
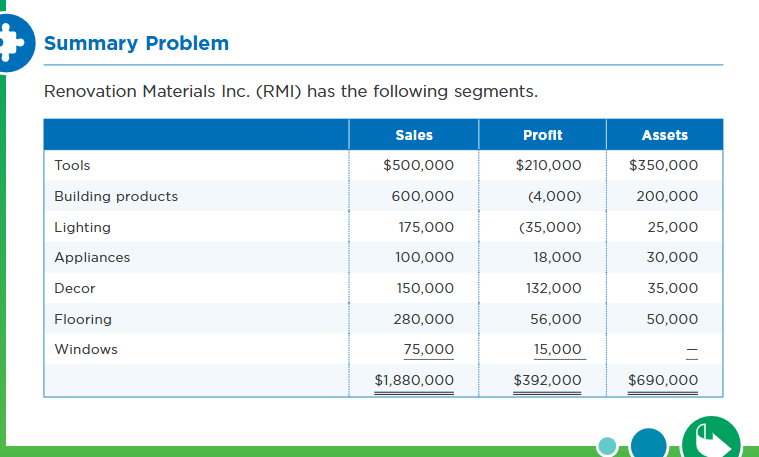

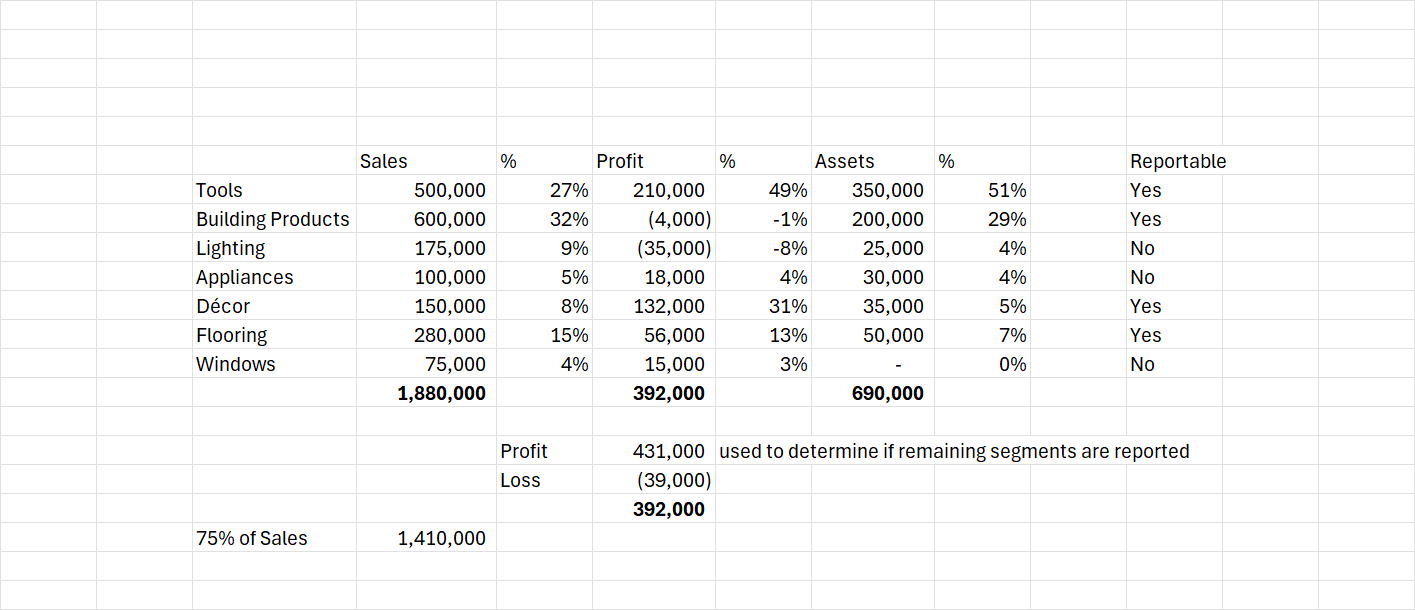
Sales | % | Profit | % | Assets | % | Reportable | ||||||
Tools | 500,000 | 27% | 210,000 | 49% | 350,000 | 51% | Yes | |||||
Building Products | 600,000 | 32% | (4,000) | -1% | 200,000 | 29% | Yes | |||||
Lighting | 175,000 | 9% | (35,000) | -8% | 25,000 | 4% | No | |||||
Appliances | 100,000 | 5% | 18,000 | 4% | 30,000 | 4% | No | |||||
Décor | 150,000 | 8% | 132,000 | 31% | 35,000 | 5% | Yes | |||||
Flooring | 280,000 | 15% | 56,000 | 13% | 50,000 | 7% | Yes | |||||
Windows | 75,000 | 4% | 15,000 | 3% | - | 0% | No | |||||
1,880,000 | 392,000 | 690,000 | ||||||||||
Profit | 431,000 | used to determine if remaining segments are reported | ||||||||||
Loss | (39,000) | |||||||||||
392,000 | ||||||||||||
75% of Sales | 1,410,000 | |||||||||||
 | ||||||||||||