Genetics, populations, evolution and ecosystems
Inheritance key terms:
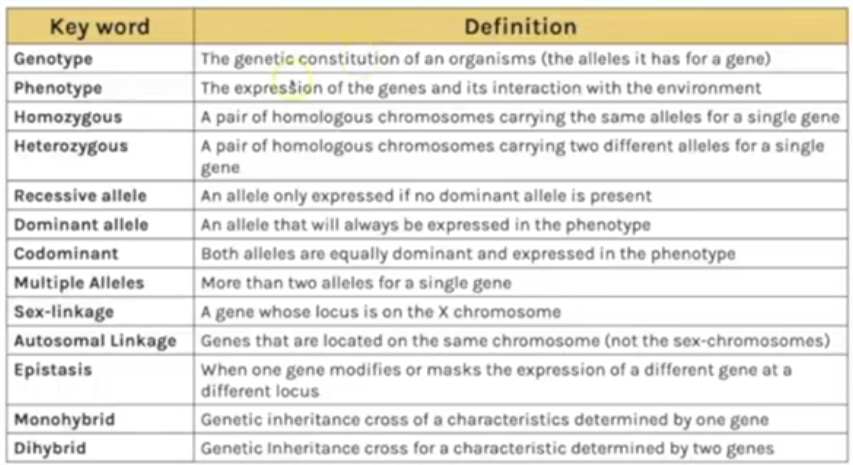
autosomal linkage = when 2 genes located on same chromosome (not the sex chromosomes) - means that alleles for each gene linked on same chromosome will be inherited together = impacts predicted gametes e.g. RY or ry not RY, Ry, rY or ry
crossing over in meiosis - results in new combinations of gametes meaning predicted gametes in punnet square may differ
homologous pair of chromosomes after DNA replication - chromatids cross over during meiosis - 4 possible chromosomes in each gamete
Hardy weinberg principle - used to predict allele frequency within a population
gene pool = all the alleles of all the genes within a population at one time
population = all the individuals of one species in one area at one time that can interbreed to make fertile offspring
allele frequency = the proportion of an allele within the gene pool
p2 + 2pq +q2 = 1
p + q = 1
p = frequency of dominant allele
q = frequency of recessive allele
pq = frequency of heterozygous genotype
p2 = frequency of homozygous dominant genotype
q2 = frequency of homozygous recessive genotype
variation
individuals within a population may show a wide range of variation in phenotype - due to genetic and environmental factors
primary source of genetic variation is mutation
meiosis (crossing over etc.) and random fertilization of gametes also introduces genetic variation
predation, disease and competition for means of survival result in differential survival and reproduction (natural selection)
organisms with phenotypes providing selective advantages are likely to produce more offspring and pass on their favourable alleles to next generation - effect of this is differential reproductive success on allele frequencies within gene pool
types of selection
disruptive - when individuals which contain alleles coding for either extreme trait are more likely to survive and pass on their alleles = allele frequency changes over many generations and more individuals possess allele for either extreme trait and middling trait allele becomes less frequent - continued disruptive selection leads to speciation
stabalising
directional
speciation = creation of new species - occurs when one original population becomes reproductively isolated - meaning there are now 2 populations of same species but they cannot breed together - can result in accumulation of differences in their gene pools to the extent that the two populations would be unable to interbreed to make fertile offspring = classed as 2 different species
populations can be reproductively isolated either geographically (allopatric)(e.g. will develop different beneficial alleles for new environment so then can’t reproduce) or because of changes in reproductive mechanisms (sympatric) (differences in behaviour e.g. becomes fertile at different times of year, different courtship ritual etc. = no reproduction = no gene flow etc.)
genetic drift = change in allele frequency within population between generations - always be genetic drift from one generation to the next but continual substantial genetic drift results in evolution - smaller population = bigger impact allele frequency changes have = evolution more rapid
Populations key terms
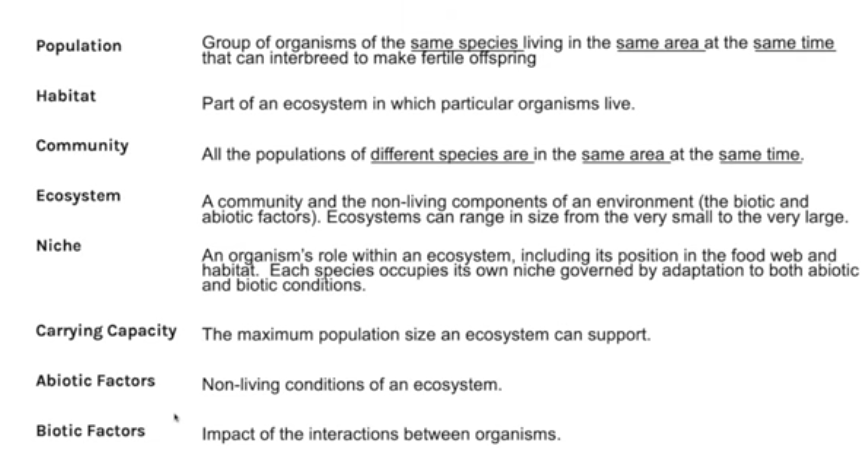
Abiotic factors can affect size of different populations - factors can range from temperature, oxygen/co2 concentration, light intensity, pH, soil conditions etc.
plants and animals are adapted to abiotic factors within ecosystem - adaptations develop through process of natural selection over many generations
less harsh abiotic factors e.g. plenty of water = large range of species and larger population sizes
biotic factors:
living components of ecosystem interacting together (e.g. competition and predation) also affect population size
interspecific competition = where members of different species are in competition for same resource that is in limited supply e.g. habitat, food, water - individual better adapted to environment is more likely to succeed in competition
intraspecific = members of same species are in competition for resources and mate - competition for mate links to courtship rituals - fitter individuals have more energy to perform more impressive courtship ritual or have fur/feathers in better conditions to attract mate
predator prey relationships - interaction between predator and prey in food web shown in predator prey graph which always follows same pattern - size of predator and prey fluctuate, always more prey than predators, size of population will always change in prey and then predators (lag time)
sampling
more time efficient and more accurate
must do random sampling in uniform areas to eliminate bias and take a large sample (30+)
line transects examine change over distance
slow moving/non mobile = sample use quadrats - if uniform distribution use random, if uneven distribution use line transect
mobile organisms = use mark release recapture
random:
lie 2 tapemeasures at right angle to create gridded area
use random number generator to generate 2 coordinates
place quadrat and collect data
repeat at least 30 times and calculate mean
line transect:
e.g. rocky shores, across river
belt transect = quadrat placed at every position along tape measure
interrupted belt transect = quadrat placed at uniform intervals along tape measure e.g. every 5m
place tapemeasure at right angle to shoreline
place quadrat every 5m
collect data
repeat by placing another 30 transects along beach at right angle to shoreline
mark release recapture
initial sample of population in question is captured
individuals are marked and number caught is recorded - mark must be weather resistant, and not harm animal (non-toxic, must not increase chances of predation or reduce chance of reproduction)
those marked individuals are released and left for a period of time to allow them to randomly disperse throughout habitat
second sample captured
total number captured in second sample, and number recaptured is recorded
size of population estimated:
estimate total pop = (number of organisms initially caught x number of organisms in second sample)/number of animals recaptured
more times repeated = more reliable result
assumes population size is constant (no birth/death/migration) and that animals always redistribute evenly (may all be near food in reality) = inaccurate? and unrealistic
succession = change in ecological community over time
primary succession:
pioneer species colonise bare rock/sand - e.g. lichen - are adapted to survive in harsh abiotic factors
through death and decomposition they change abiotic factors to become less harsh and form a thin layer of soil humus
mosses/smaller plants now able to survive in that area and they further increase depth and nutrient content of soil - pattern continues and as abiotic factors continue to be less harsh, larger plants can survive and change environment further
each new species may change environment in a way that it becomes less suitable for previous species - each existing species is outcompetetd by a new species colonising
changes organisms produce in their abiotic environment can result in a less hostile environment and increases biodiversity
final stage of succession = climax community - dominated by trees
secondary succession = succession disrupted and plants destroyed so succession starts again but soil already created so doesn’t start from bare rock stage
species richness and number of organisms increase (biodiversity) with succession and larger plants and animals will start to colonise area
conservation of habitats
destruction of habitats (usually due to human activity) results in loss of food and habitat for organisms and can lead to extinction
to conserve habitats succession is managed:
by maintaining earlier stages in succession and preventing climax community, a greater variety of habitats are conserved and therefore a greater range of species
needs to be management though between conflict between human needs and conservation in order to maintain sustainability of natural resources