STAT Unit 4
4.1
Population - entire group you want to study
Sample - Smaller group taken from the population to study
Sample Mean () - average from sample
Population Mean (μ) - average for whole population
Convenience Sample
taking data that’s easy to reach
asking friends or family or first 10 customers
Problem High Bias - does not represent everyone fairly
Voluntary Response
people choose to respond
Problem High Bias - only people with strong opinions tend to answer
Simple Random Sample
lowers bias
every individual has a equal chance of being chosen
Steps
Label everyone
Use a random number generator or draw names
Select without repeats
4.2
Stratified Random Sample
split population in groups (strata) that share something in common (homogenous)
then randomly sample from each group
“Sample some from all groups”
reduces variability
split population - label a group 1 to N - use a random number generator to select # numbers with no repeats - select those corresponding to these numbers - repeat for each group
Steps
Split population into homogenous groups
Number individuals within each group ( 1 to N)
Use a random number generator to select people - NO REPEATS
repeat for each group
4.3
Cluster Sample
split population into heterogenous groups (clusters)
randomly select a few entire clusters
mini populations of the whole
Ex - choose 1-2 floors and survey every room on those floors
“Sample all from some groups”
Systematic Random Sample
Label everyone 1-N
Choose a random starting point
Pick every kth person (every 10th person) until sample is complete
Stratified reduces variability + ensures groups are represented
Cluster quick + easy to collect data, good when groups are mixed
Systematic spreads sample evenly through population
4.4
Types of Bias
Under coverage
Some groups in the population are less likely to be chosen or not represented.
Calling only landlines (misses people with only cell phones).
Nonresponse
People are selected for the sample but don’t respond.
Sending an email survey and most people don’t reply.
Response Bias
Occurs when the survey design or wording influences responses, or people lie.
A firefighter in uniform asks about cutting fire funding; people might lie.
How to Reduce Bias
Use random selection to include everyone equally.
Follow up with nonrespondents (phone calls, reminders).
Keep surveys anonymous to reduce pressure or lying.
Use neutral wording (avoid emotional or leading questions).
4.5
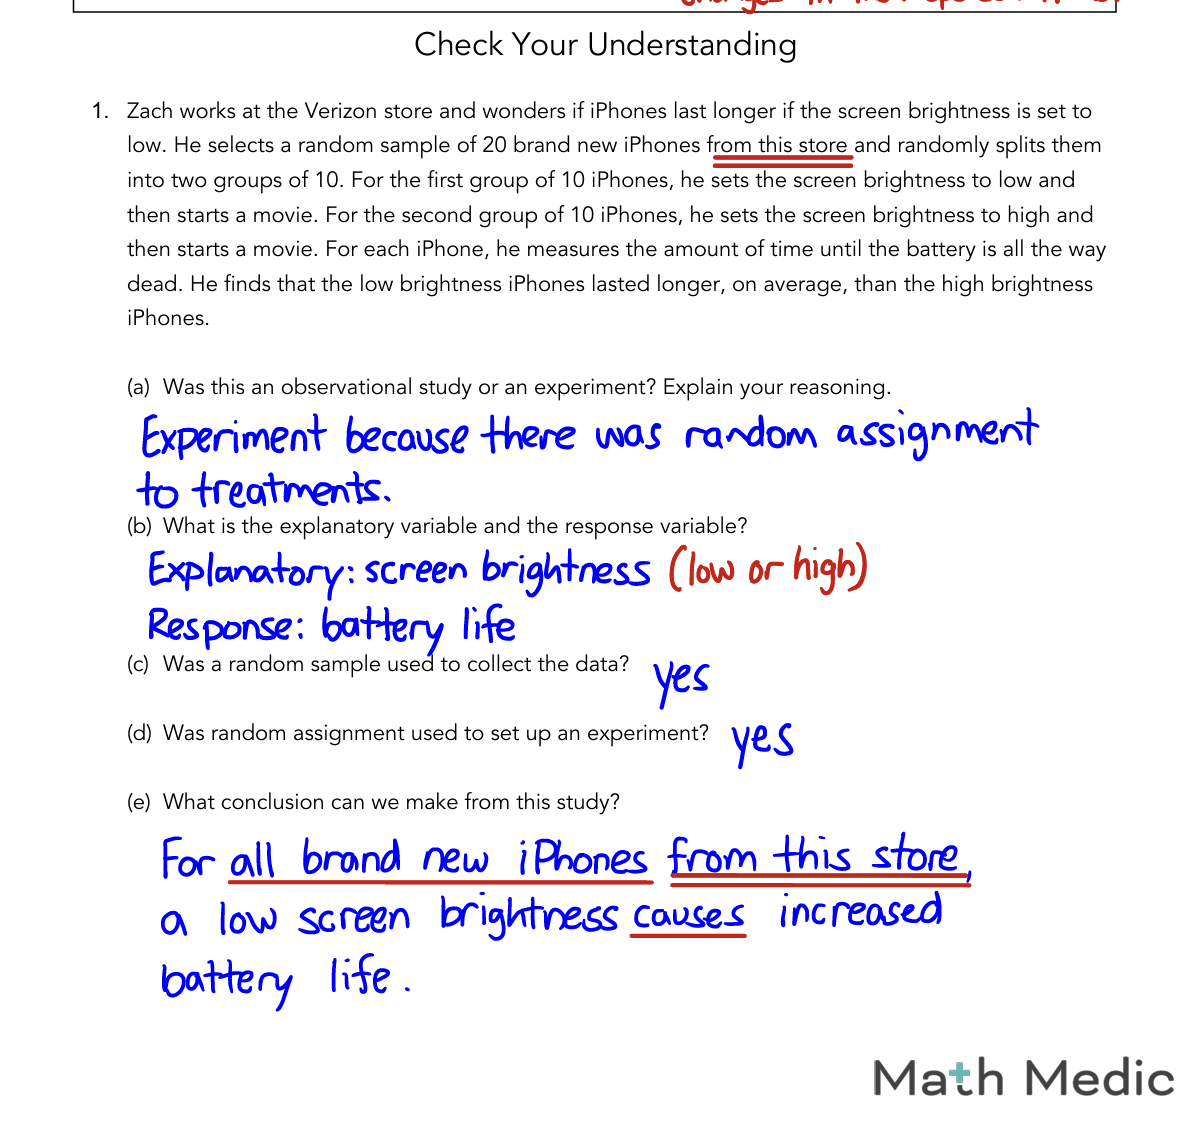
Explanatory variable - the cause/what you change
Response variable - effect/outcome measured
Confounding Variable - hidden variable that effects both
related to explanatory variable
also, effects response variable
messes up results
Ex motivation - impacts SAT score (response variable)
Observational Study - researchers just observe - no treatment given
correlation
Experiment - researchers impose treatment
shows causation or cause-and-effect
Experimental Units (Subjects) - who the experiment is being done on
Control Group - group that does not get treatment, used as a benchmark to compare the effects of the treatment on the experimental group.
consistent results
Placebo - fake treatment given to compare effects
Steps to Design a Good Experiment
Randomly Assign them to groups
One group gets treatment
Other group gets no treatment = control group
Compare results
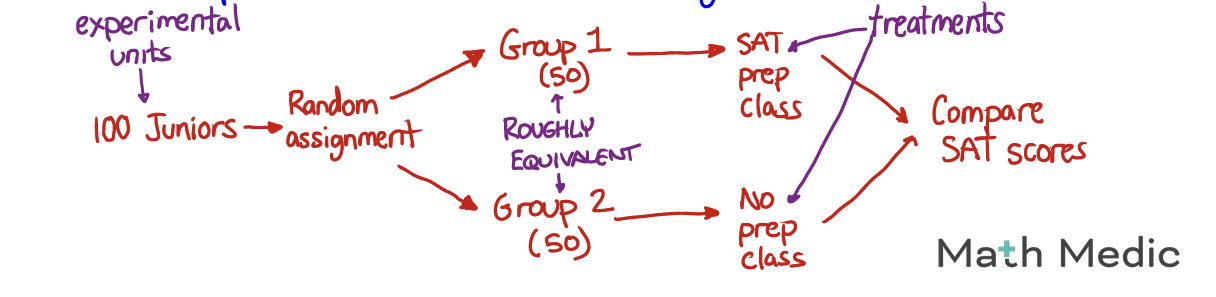
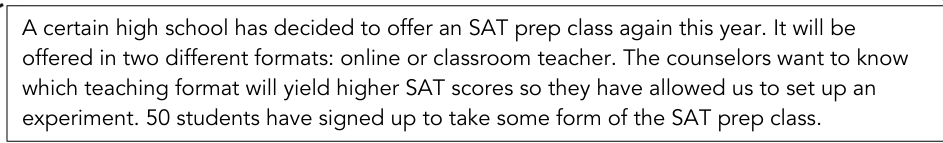
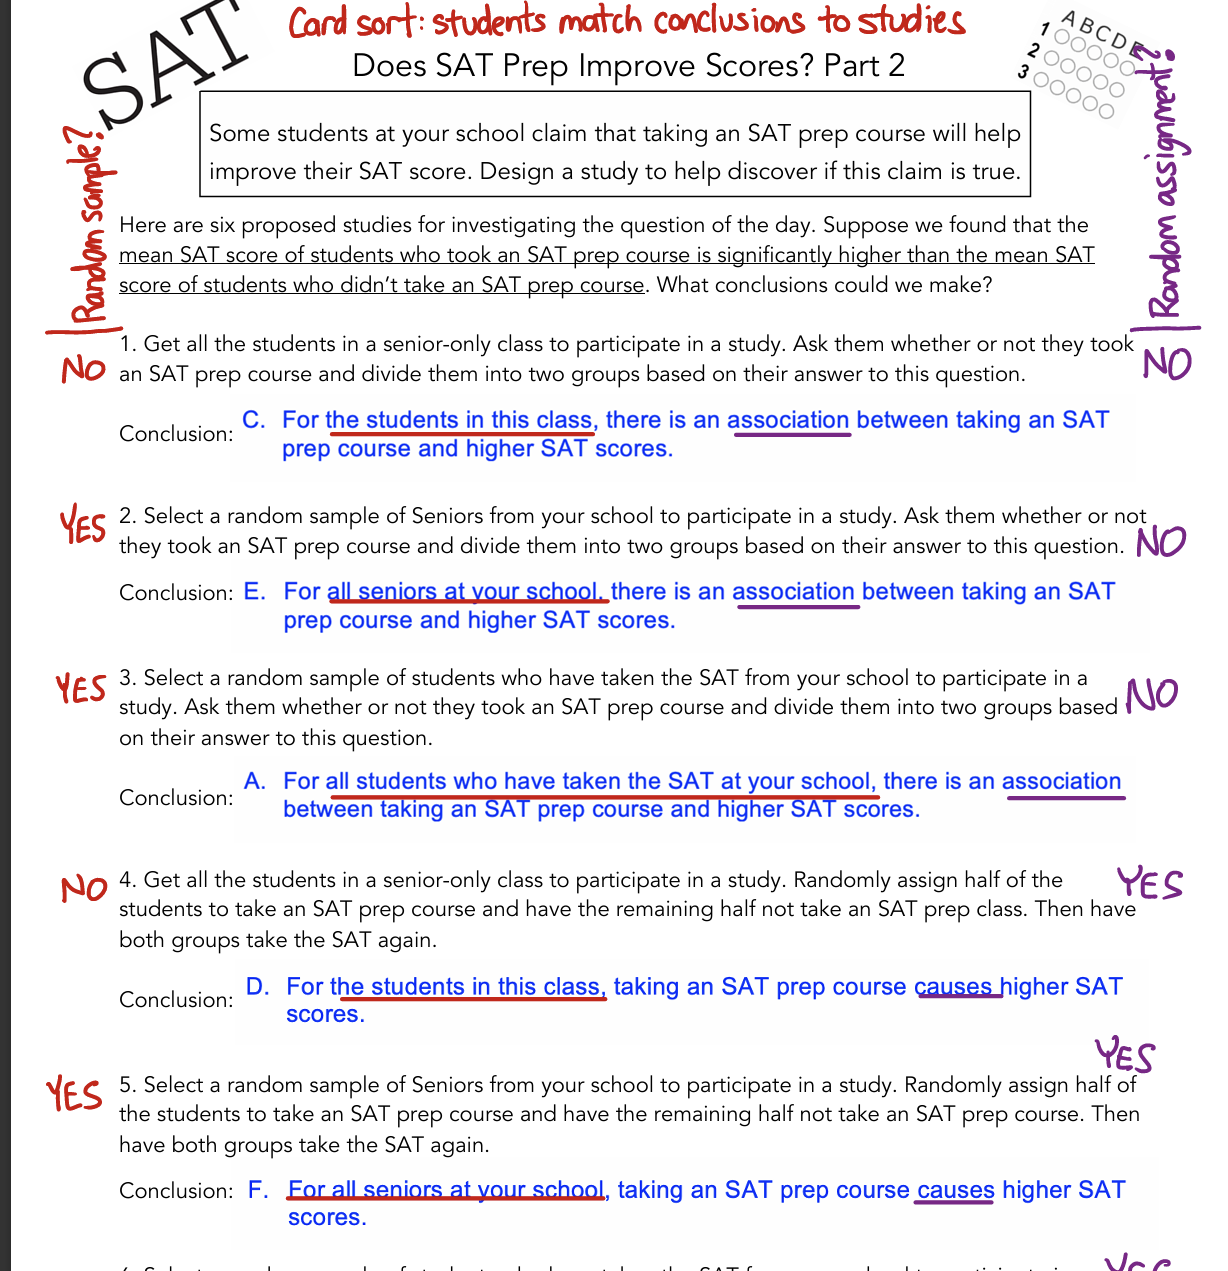
Example - Does SAT prep (class) improve SAT scores?
4.6
Treatment - what is being done
Random Assignment - randomly putting subjects into groups (random number generator)
Label 2. Randomize 3. Assign
Blinding - subjects and/or researchers don’t know who gets what
reduces bias
Single Blind - subjects don’t know - researchers know
Double Blind - subjects and researchers don’t know
best way to avoid bias
4 Parts of a Good Experiment (CRRC)
Comparison use 2 or more groups (to compare treatments)
Random Assignment randomly assign subjects to groups (makes groups fair)
Replication enough subjects in each group (reliable)
Control (control group) keep other variables same
Example Problems
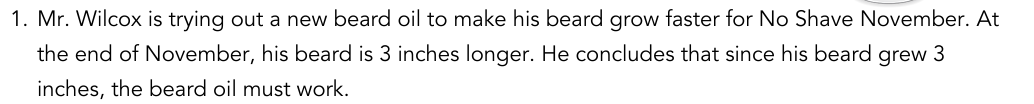
What is wrong with this experiment?
He only tested for a month, and there is no control variable so we don’t know if his beard grew without the oil.
What could be done to improve this experiment?
Measure beard growth for a month with no oil (control group)
Measure beard for 7 months - replication
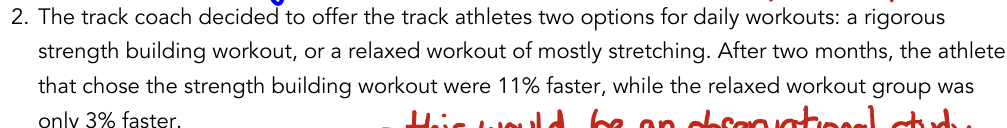
What is wrong with this experiment?
Athletes were able to choose which treatment they wanted, this makes it more of a observational study. (not randomized)
How could you randomly assign the subjects?
Number athletes 1–120 → randomly pick 60 → Strength group
Remaining 60 → Relaxed group
What is the benefit of using random assignment?
we can determine if the strength workout actually worked (caused faster times)
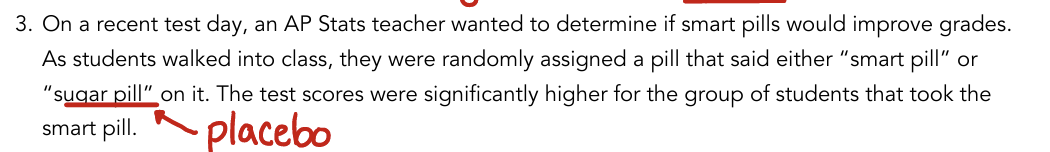
What is wrong with this experiment?
The students knew what pill (treatment) they were taking.
What could be done to improve this experiment?
no labels on the pills - single blind
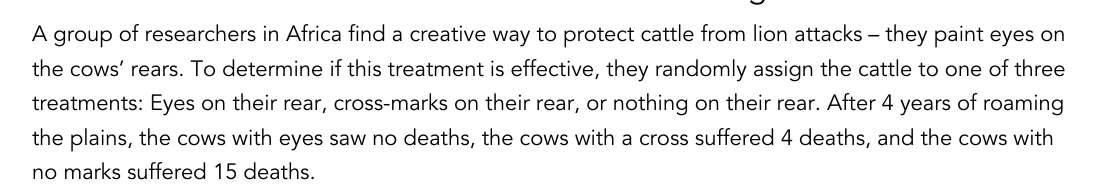
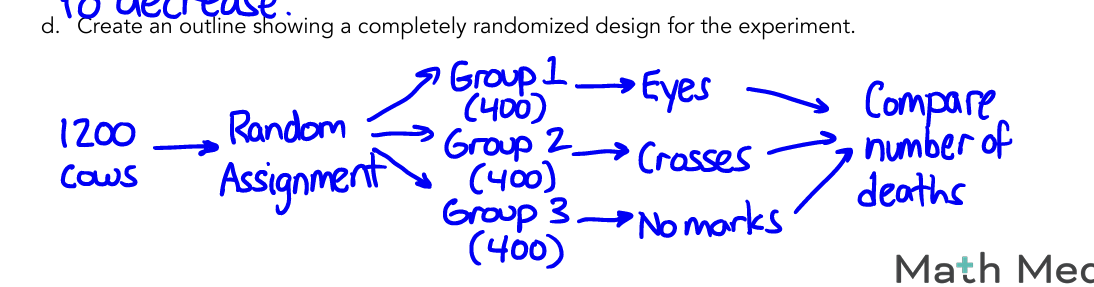
there’s 1200 cows in total
4.7
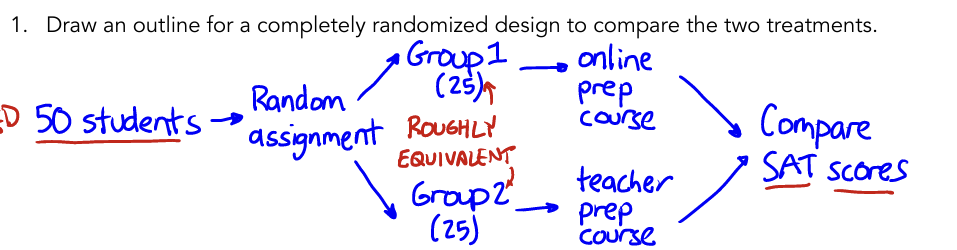
Completely Randomized Design
all subjects are randomly assigned to treatment groups
no grouping/blocking beforehand
When to use
when subjects are similar - no obvious differences
Examples
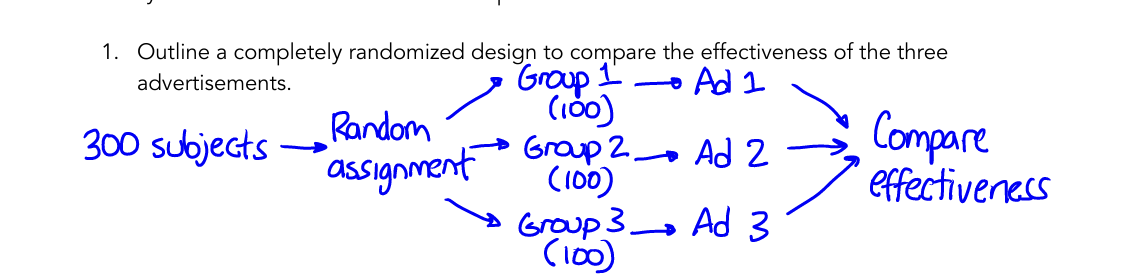
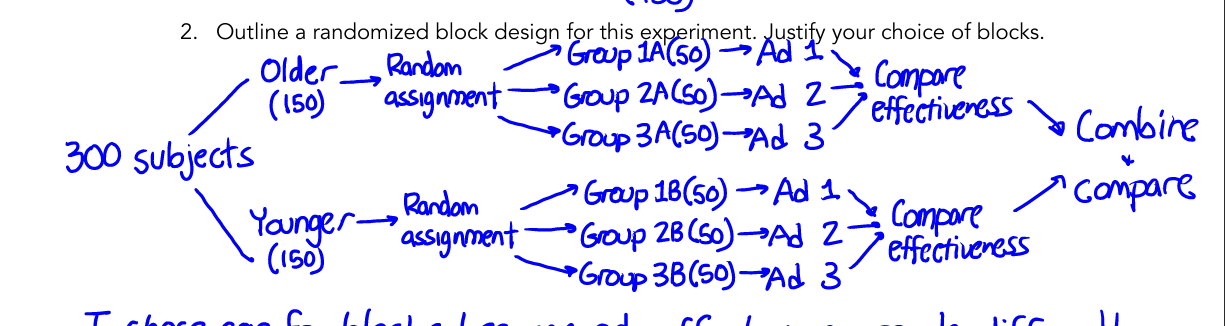
Randomized Block Design
subjects are first grouped by a variable that may affect the response variable (block), then randomly assigned to treatments within each block.
controls confounding variable - reduces variability
When to use
when you think groups differ that affects results
age, gender, skill level
Examples
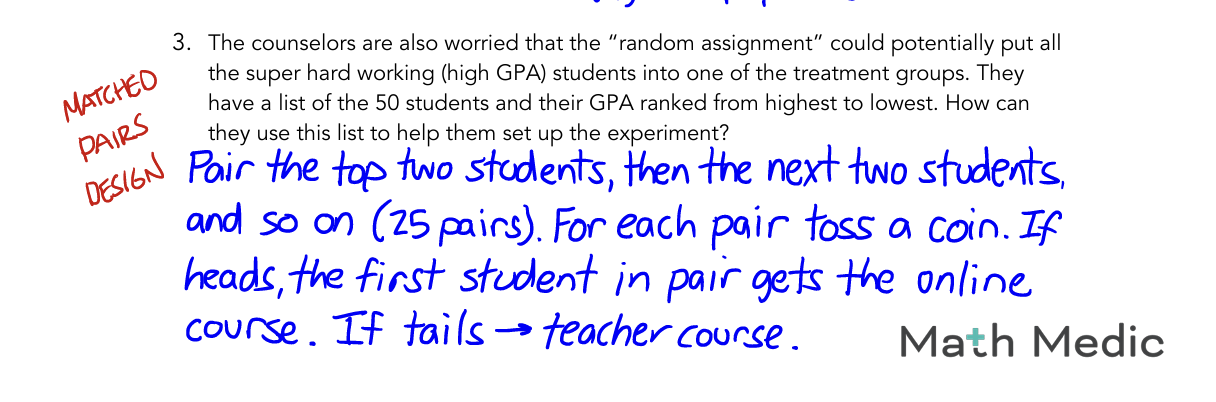
Matched Pairs Design
each block has 2 subjects, or each subject gets 2 treatments
reduces variability
two-sampled paired - pair similar subjects randomly assign to each treatment
repeated measures - one person gets both treatments in random order
Examples
4.8
Stimulation - a way to model what could happen by random chance
repeated random trials to model chance
Statistical Significance
a result is statistically significant if it is unlikely to happen by chance alone
less than < 5% by chance
If a difference is statistically significant
we have evidence that the treatment caused the effect, not just random chance
Steps to Test Statistical Significance Using Simulation
Step | What you do | Example |
|---|---|---|
1. Start with experiment data | Compute difference between groups | Ad A − Ad B = 4% |
2. Assume no real difference (null hypothesis) | Shuffle or randomly assign outcomes | Randomly mix click results |
3. Run many trials | Repeat 50–100 simulations | Each time record difference |
4. Compare | See how often a result equal to or bigger than actual result appears by chance | 42 out of 100 simulations ≥ 4% |
5. Decide significance | If < 5%, significant | 42% → NOT significant |
Interpreting Results
If p-value < 5%
unlikely due to chance
statistically significant
evidence treatment worked
If p-value 5%
could be due to chance
not statistically significant
no strong evidence that treatment worked
5. Example: Yelp A/B Ad Test
Group | Clicked | Conversion Rate |
|---|---|---|
Ad A | 21/50 | 42% |
Ad B | 19/50 | 38% |
Difference = 4%
Simulation shows 42% of random trials gave a difference ≥ 4%.
✅ Conclusion:
42% > 5% → Not statistically significant
The difference could easily happen by chance
6. Example: John vs Jennifer Study (Gender Bias Experiment)
Measured mean rating difference:
xˉJohn−xˉJenn=1.26\bar{x}_{John} - \bar{x}_{Jenn} = 1.26xˉJohn−xˉJenn=1.26
Simulation showed 6.7% of random assignments gave a difference ≥ 1.26.
✅ Conclusion:
6.7% > 5% → Not statistically significant
The result could be due to random assignment
Some evidence of bias, but not strong
Term | Definition |
|---|---|
Null Hypothesis (H0H_0H0) | Assumes no difference or no treatment effect |
Observed Difference | The difference from the real experiment |
Simulation | Repeated random trials to model chance |
p-value | Probability results are due to chance |
Statistically Significant | p-value < 5% |
4.9
When we finish study we want to know 2 things
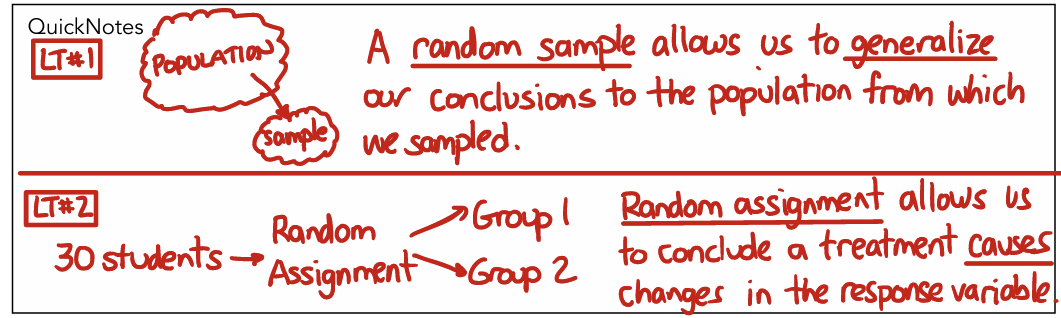
can we generalize to a population? - does it apply to more people (RS)
can we show cause-and-effect? - did treatment cause results (RA)
Examples
Term | Meaning |
|---|---|
Random Sample | People are randomly chosen from a population → lets us generalize |
Random Assignment | People randomly put into groups → allows cause & effect |
Association | Two things are related but one didn’t necessarily cause the other |
Causation | One thing caused a change in another (requires experiment) |