MO6
Resource Markets - Demand and Supply at Work in Labor Markets
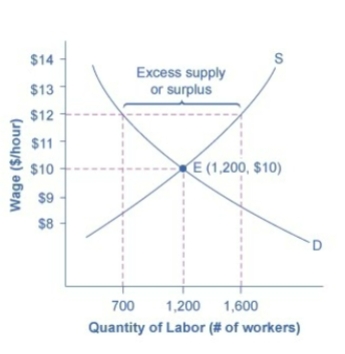
→ Supply and Demand
Law of Demand:
Higher salary/wage = decrease in quantity of labor demanded by employer
Lower salary/wage = increase in quantity of labor demanded by employer
Law of Supply:
higher price for labor = higher quantity of labor supplied
lower price for labor = lower quantity supplied
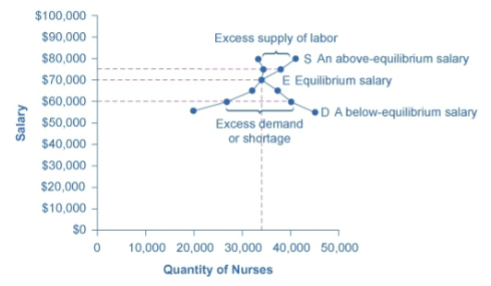
In a surplus, employers will offer lower wages
In a shortage, employers will offer higher wages to attract
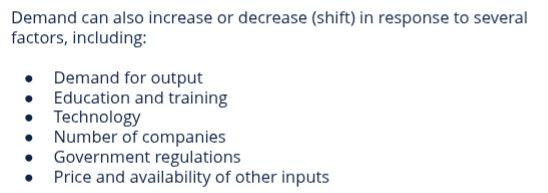
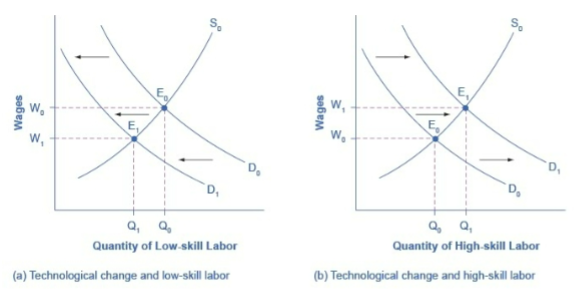
→ Shifts in Labor Demand
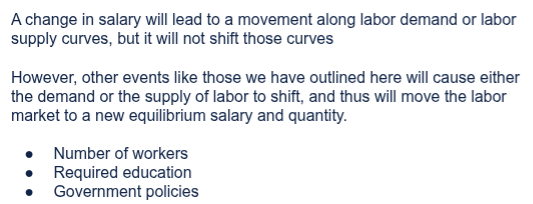
wage increases = quantity of labor decreases
wage decreases = quantity of labor decreases
demand increase = demand for labor increases (right shift)
demand decreases = demand for labor decreases (left shift)
→ Changes in Wages
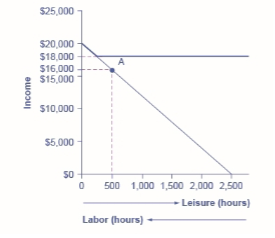
→ Shifts in Labor Supply
higher the price = greater the quantity supplied
lower the price = less quantity supplied
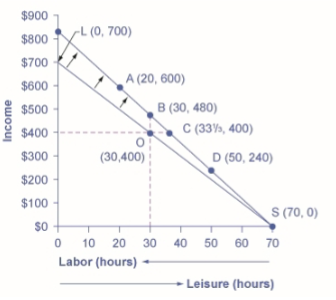
the higher the wage, the more labor is willing to work and forego leisure activities
→ Minimum Wage
Minimum Wage: price floor that makes it illegal for an employer to pay employees less than a certain hourly rate
Resource Markets - Demand and Supply in Financial Markets
→ Supply and Demand for Money
supply financial capital (i.e., savings) - supply side of financial market (will receive rate of return)
demand financial capital (i.e., borrowing) - demand side of financial market (will pay the rate of return)
rate of return - interest
interest rate increases = quantity borrowed reduces
higher price increases quantity supplied (law of supply)
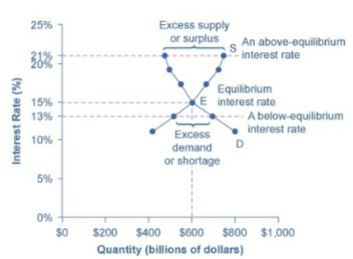
→ Equilibrium Interest Rate
interest rate above equilibrium = excess supply (surplus)
interest rate below equilibrium = excess demand (shortage)
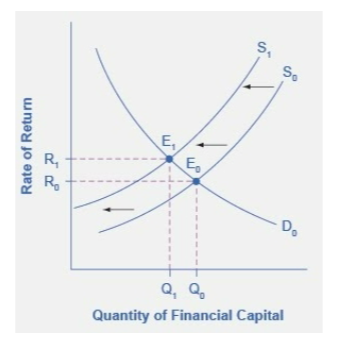
→ Shifts of Money Demand and Supply
intertemporal decision making: when to consume goods (now or future)
quantity demanded of financial capital will shift right if they have greater confidence that they will be able to repay in the future
Rate of return is positive
Risk is negative
As risk increases, the rate of return will also increases. This increase in risk increases the supply of financial capital.
→ Changes in Interest Rate
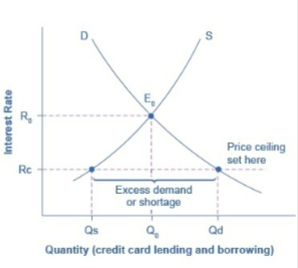
→ Understanding Usury Laws
Usury Laws: upper limit on the interest rate that lenders can charge (in many cases these upper limits are well above the market interest rate)
Resource Markets - The Market System as an Efficient Mechanism for Information
→ Price Signals
Pricing changes serves as a mechanism for
transmitting information regarding the relationship between supply and demand
Increase in price signals to consumers that there is a shortage
flexible prices help reach equilibrium so price controls can be counterproductive
→ Applying Supply and Demand
demand and supply model can explain the existing levels of prices, wages, and rates of return
Government Policies to Reduce Inequality
→ Redistribution Programs
Redistribution: taking income from people with higher income and providing income to people with lower income
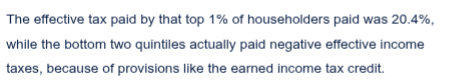
Federal Income Tax is a progressive tax system: the rich pay a higher percent in income taxes than the poor funds the programs

effective income tax: total taxes paid / total income
→ Ladder of Opportunity
Economic inequality is determined by the circumstances a child grows up in
Ladder of Opportunity: each child has a reasonable opportunity to attain an economic niche in society based on their interests, desires, talents, and efforts
estate tax: a tax imposed on the value of an inheritance
→ Equity vs. Efficiency
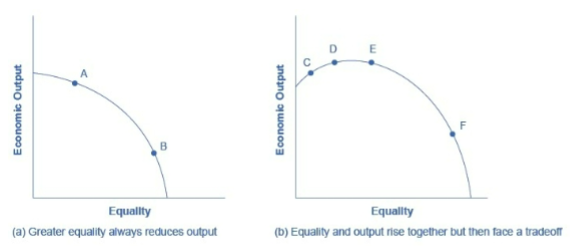
A. for high level of economic output, must accept a high degree of inequality
B. for high level of equality, must accept lower level of output
The Poverty Line and The Poverty Trap
→ Defining Poverty
Poverty is measured by the number of people who fall below a certain level of income—called the poverty line
The U.S. poverty line in 2015 ranged from $11,790 for a single individual to $25,240 for a household of four people
income inequality compares the share of the total income (or
wealth) in society that different groups receive
→ Poverty Over Time
poverty line is based on cash income
In no year in the last four decades has the poverty rate been less than 11% of the U.S. population.
In recent years, the poverty rate appears to have peaked at
15.9% in 2011 before dropping to 14.5% in 2013.
→ Poverty Trap
Definition: When people are provided with food, shelter, healthcare, income, and other necessities, assistance may reduce their incentive to work.
→ Basic Income
Economists call the situation in which a person who experiences no net gain for working a poverty trap
→ Reducing the Poverty Trap
instead of reducing government payments by $1 for every $1 earned, the government would reduce payments by some smaller amount instead
→ Phase-Out Programs
Issues:
enacting such a program may still reduce the incentive to work
anti-poverty program costs more money
may be preferable in the long run to spend more money on a
program that retains a greater incentive to work, rather than spending less money on a program that nearly eliminates any gains from working
The Safety Net and Income Inequality
→ The Safety Net
Definition: programs to assist those below the poverty line and those who have incomes just above the poverty line (near-poor)
some protection for those who find themselves without jobs or income
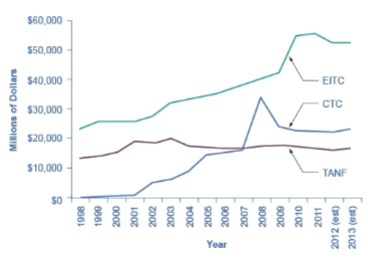
Under TANF, the federal government gives a fixed amount of money to each state which can be used for almost any antipoverty
program
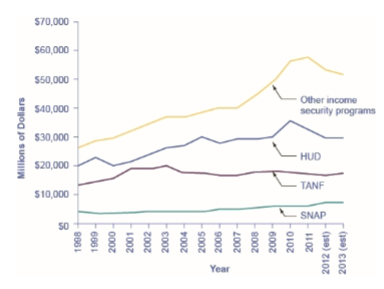
→ Income Security Programs
Supplemental Nutrition Assistance Program (SNAP) (food stamps) - each month poor people receive a card like a debit card that they can use to buy food
SNAP can contribute to the poverty trap. For every $100 earned, the government assumes that a family can spend $30 more for food, and thus reduces its eligibility for food aid by $30
income security programs that it funds through departments such as Health and Human Services, Agriculture, and Housing and Urban Development (HUD)
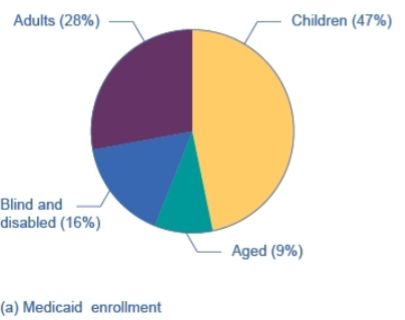
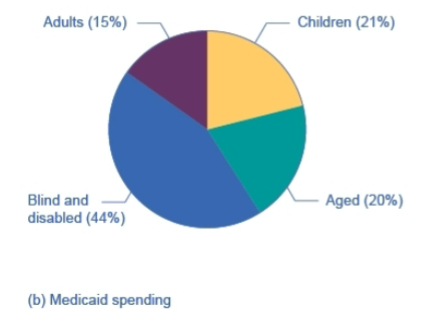
Medicaid: joint health insurance program between both the states and the federal government (for low income)
→ Measuring Income Inequality