Reabrook, Perry and Tame
Below are three examples of river basins with similar and differing features, to help analyse and support factors that influence flooding.
size and shape of drainage basin - both quantitative and qualitative
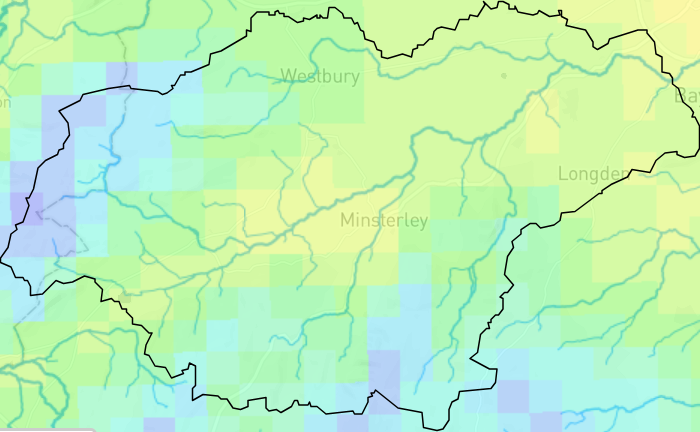
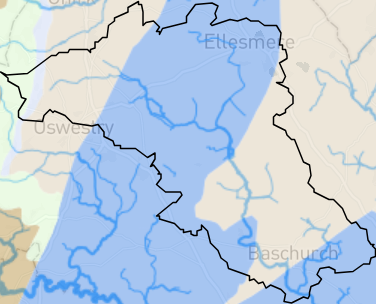
Reabrook
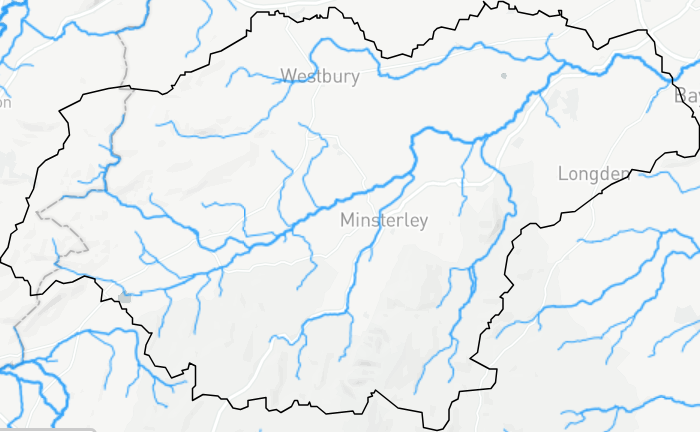
178km²
Inherits a more circular, but still fairly elongated shape.
This contributes to a more rapid flow of water than in the Perry, as water from the peripheries of the basin has less distance to travel.
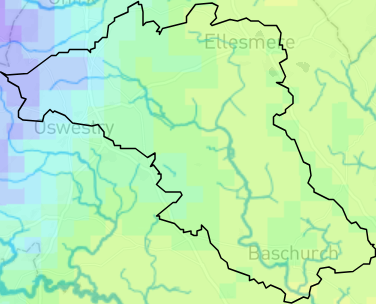
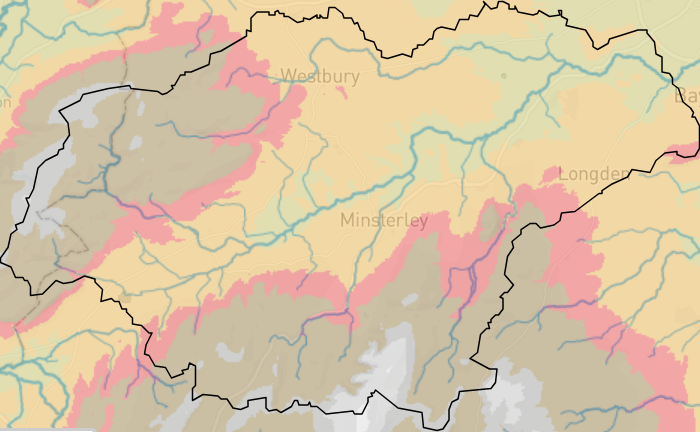
Perry
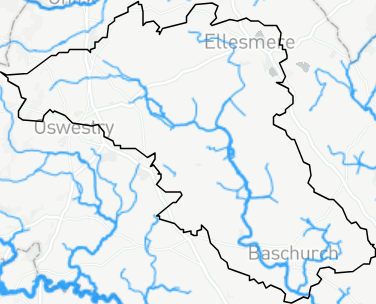
180.8km²
Has a fairly narrow and elongated shape.
This means water takes longer to reach the channel from the furthest peripheries, resulting in a slower flow of water than in the Reabrook.
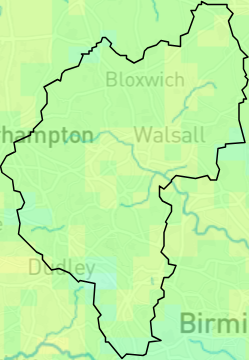
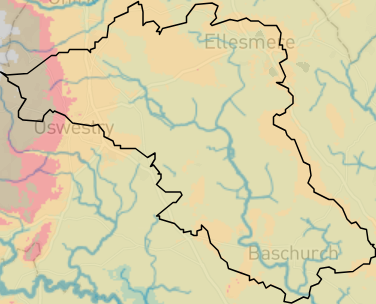
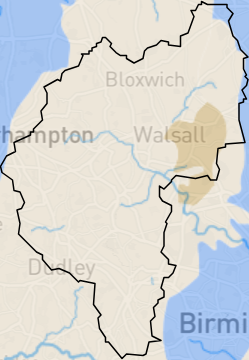
Tame
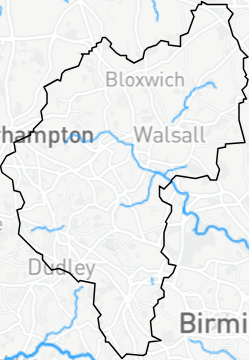
169km²
Whilst rather elongated, this is a negligible factor as it is almost an entirely urbanised catchment just below the confluence of its upper branches.
average annual rainfall
The basins are all relatively close to each other, and therefore receive a similar input.
Reabrook
800.00mm
Has the highest average annual rainfall, which may result in more water reaching the river channel faster, as the input is greater. However, the differences are quite small, so this factor is likely negligible.
Perry
789.00mm
Tame
764.00mm
flow characteristics - highs/lows/variation - flashy/subdued
These graphs use logarithmic scales in the y-axis. This allows us to compare flow rates more easily, by making the ranges simpler to visualise.
Reabrook
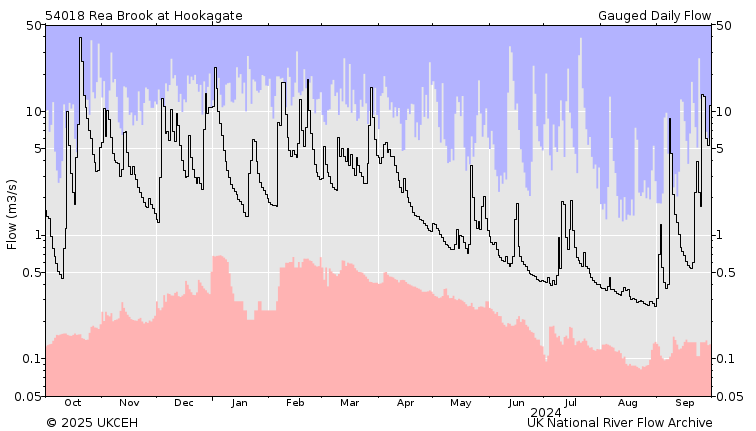
Has a large range in flow, resulting in a flashy flood hydrograph. This is demonstrated in the hydrograph below:
The steep rising limb, short lag time, and high peak discharge all contribute to flooding, as water reaches the channel quicker due to a range of factors in this case study such as the more circular basin.
Perry
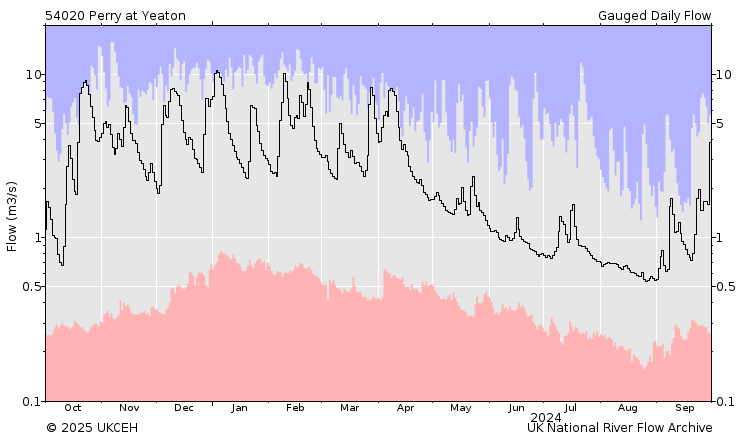
Has a small range in flow, of around 0.5-10Q. This results in the most subdued flood hydrograph. This is demonstrated in the hydrograph below:
The flat rising limb, longer lag time, and low peak discharge show that due to a range of factors in this case study, water is reaching the channel slower.
Tame
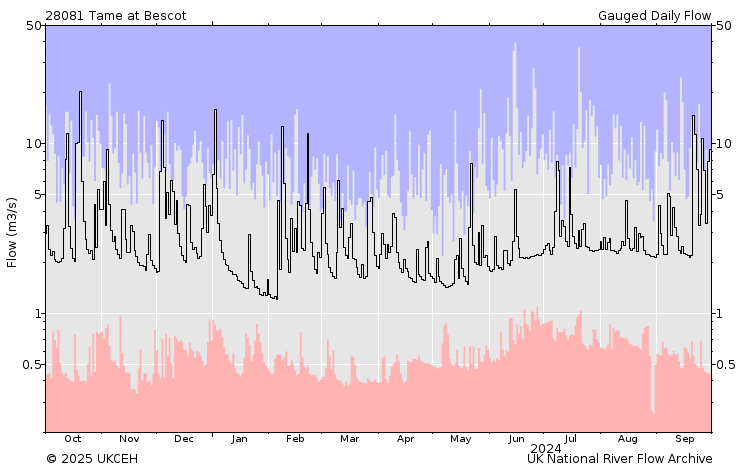
Has a frequently fluctuating flow rate. It has a smaller range in flow but is still very flashy due to the rapid changes.
Again, this is due to urbanisation through the introduction of large areas of impermeable surfaces speeding up the flow (expanded on later in the case study).
relief
Reabrook
Has the largest range in altitude of 449.20mAOD.
This causes a faster lateral flow of water due to gravity and the force of weight, seeing less water infiltrate into the soil.
This results in water reaching the channel faster and in larger volumes.
Perry
Flatter than the Reabrook, with a range of 303.90mAOD.
This is an important factor determining the low peak discharge into the channel, as water is moving slower at a flatter incline, meaning it has more time to infiltrate into the soil.
This results in water reaching the channel slower, and in a lower volume.
Tame
Flattest with a range of 163.40mAOD.
It’s better to focus on the flatness of the Perry in comparison with the Reabrook, because urbanisation is by far the leading factor in determining the Tame’s flashy hydrograph.
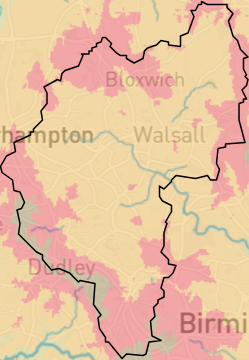
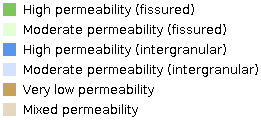
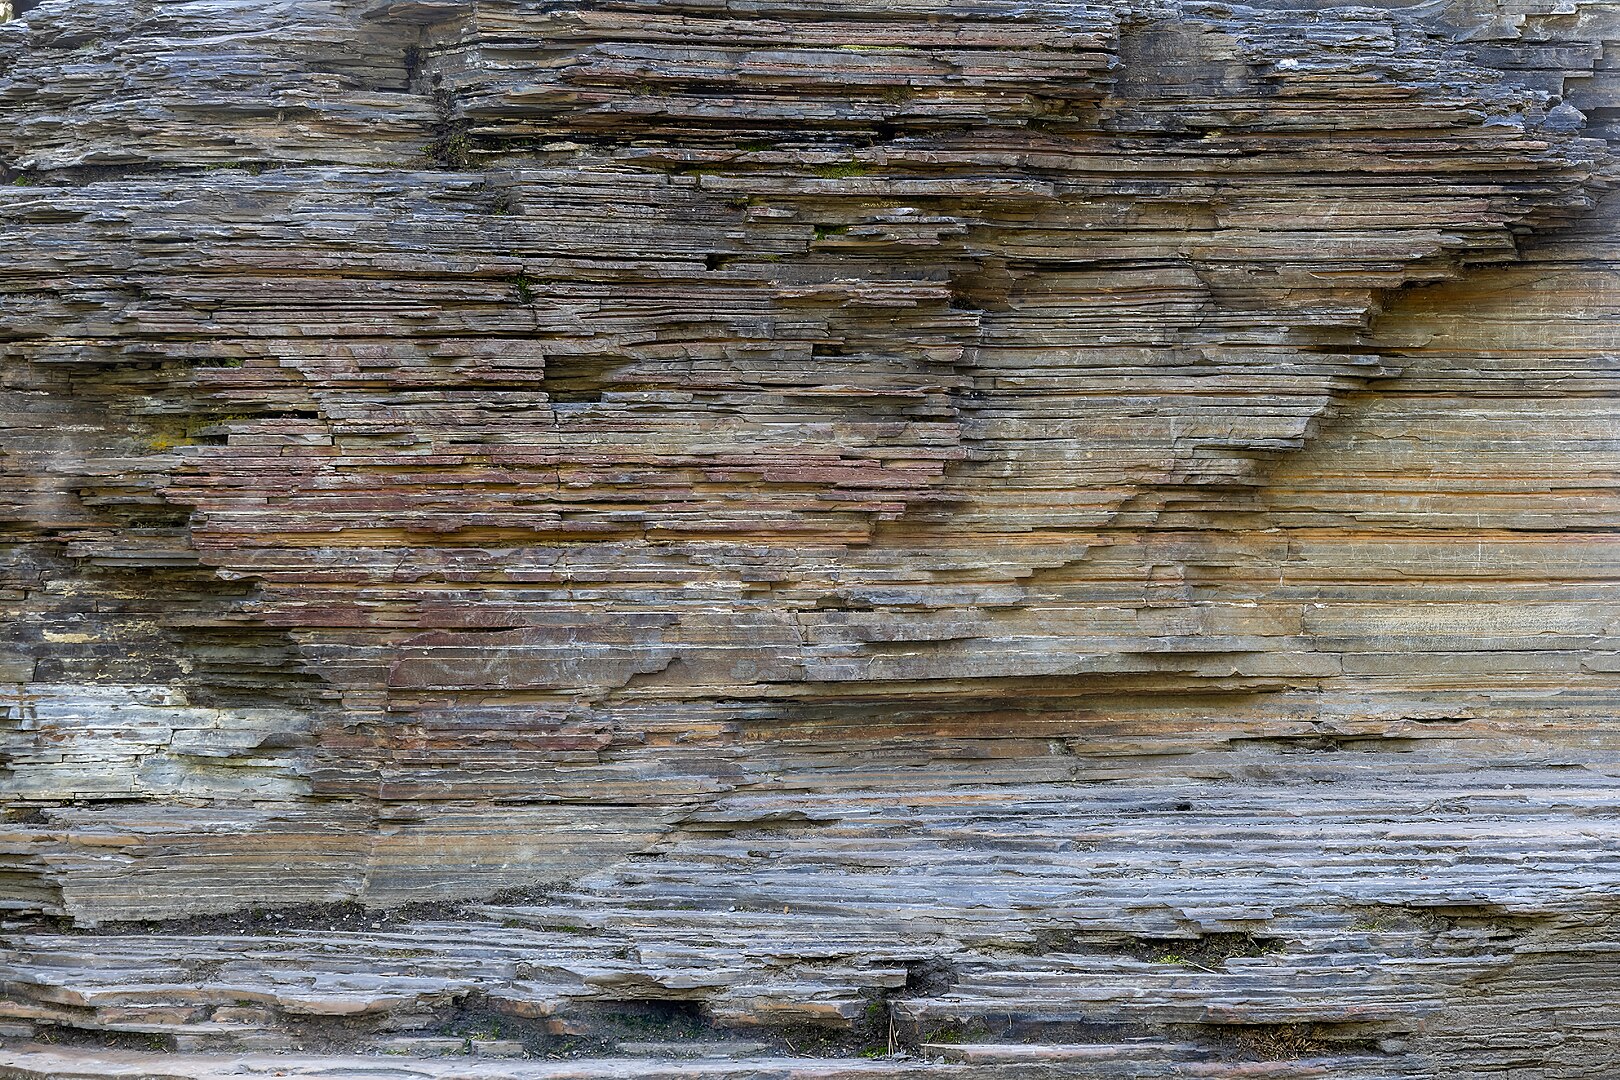
bedrock - types and % of different permeabilities
high permeability bedrock
moderate permeability bedrock
very low permeability bedrock
mixed permeability bedrock
Reabrook
Mostly made up of octavian shale, which is highly impermeable.
As such, water cannot permeate into most of the rock in the basin, and cannot percolate through into the groundwater storage.
This increased the speed of the flow of water to the channel by reducing gradual downward flow and increasing lateral flow by gravity.
This contributes towards its steeper rising limb and shorter lag time.
2.77%
0%
65.22%
32.01%
Perry
The Perry is mostly made of red sandstone, which is highly permeable.
As such, water can permeate into most of the rock in the basin, and can percolate through into the groundwater storage.
This slows the flow of water to the channel by increasing gradual downward flow, and slowing lateral flow by gravity.
This contributes to the its longer flatter rising limb and longer lag time.
56.35%
2.27%
0%
41.38%
Tame
1.39%
0%
6.24%
92.37%
soil - superficial deposits
generally high permeability superficial deposits
generally low permeability superficial deposits
mixed permeability superficial deposits
Reabrook
4.40%
0%
56.37%
Perry
28.60%
10.18%
59.25%
Tame
1.51%
0%
51.35%
drainage density
Reabrook
Has a higher drainage density because it is impermeable and steep.
Perry
Has a lower drainage density because it is permeable and flatter.
Tame
Has the lowest drainage density because much of the basin is built up for residencies.