Nursing Implications in Dysrhythmias
Course Information and Supplemental Resources
NUR 4402: Nursing Implications in Dysrhythmias is taught by Candice Williams, MSN, RN, NPD-BC, ACM-RN. For success in this course, students are encouraged to utilize the following resources:
EKG Textbook: An open-resource textbook titled An EKG Interpretation Primer is available at
https://nursesinternational.org/ekg/.EKG Practice Packet: A practice packet (specifically version SUM26) is provided. It is strongly recommended to print this document for manual practice.
Measurement Spreadsheet: A specific "Measurement - Interpretation spreadsheet" is available for students to track data during EKG practice.
Cardiac Anatomy and Physiology Review
Heart Chambers and Structure
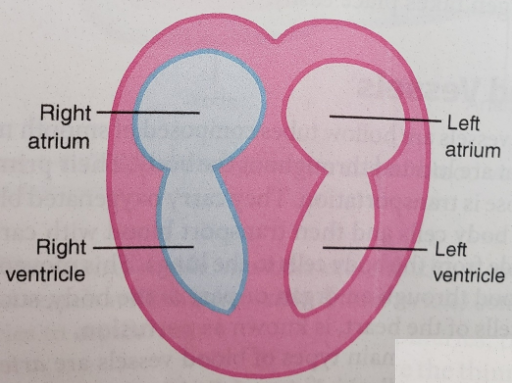
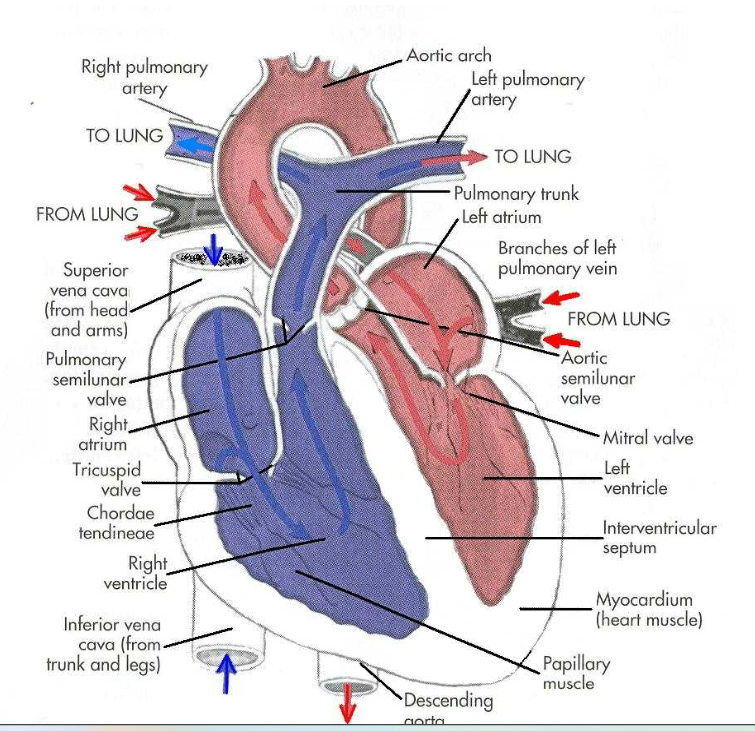
The heart consists of four chambers divided by a septum:
Atria: Right Atrium and Left Atrium. The interatrial septum divides these two chambers.
Ventricles: Right Ventricle and Left Ventricle. The interventricular septum divides these two chambers.
Layers of the Heart Muscle
Endocardium: The innermost layer of tissue that lines the heart chambers.
Myocardium: The middle, muscular layer responsible for the pumping action.
Epicardium: The outermost layer of the heart wall.
Heart Valves
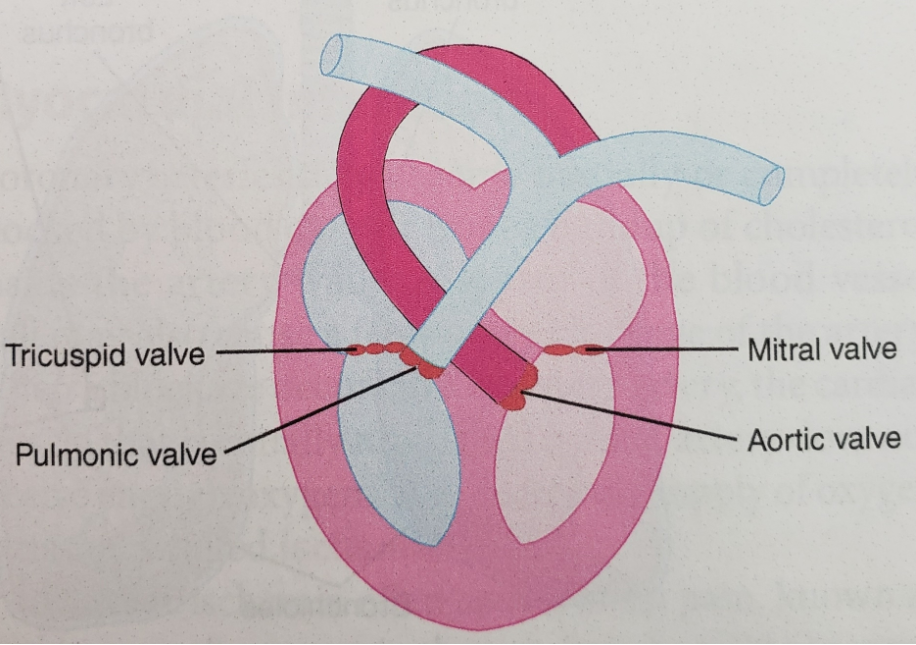
The heart contains four valves that ensure unidirectional blood flow:
Atrioventricular Valves:
Tricuspid Valve: Located between the right atrium and right ventricle.
Mitral Valve: Located between the left atrium and left ventricle.
Semilunar Valves:
Pulmonic Valve: Located between the right ventricle and the pulmonary artery.
Aortic Valve: Located between the left ventricle and the aorta.
Respiratory and Vascular Integration
Pulmonary Circulation
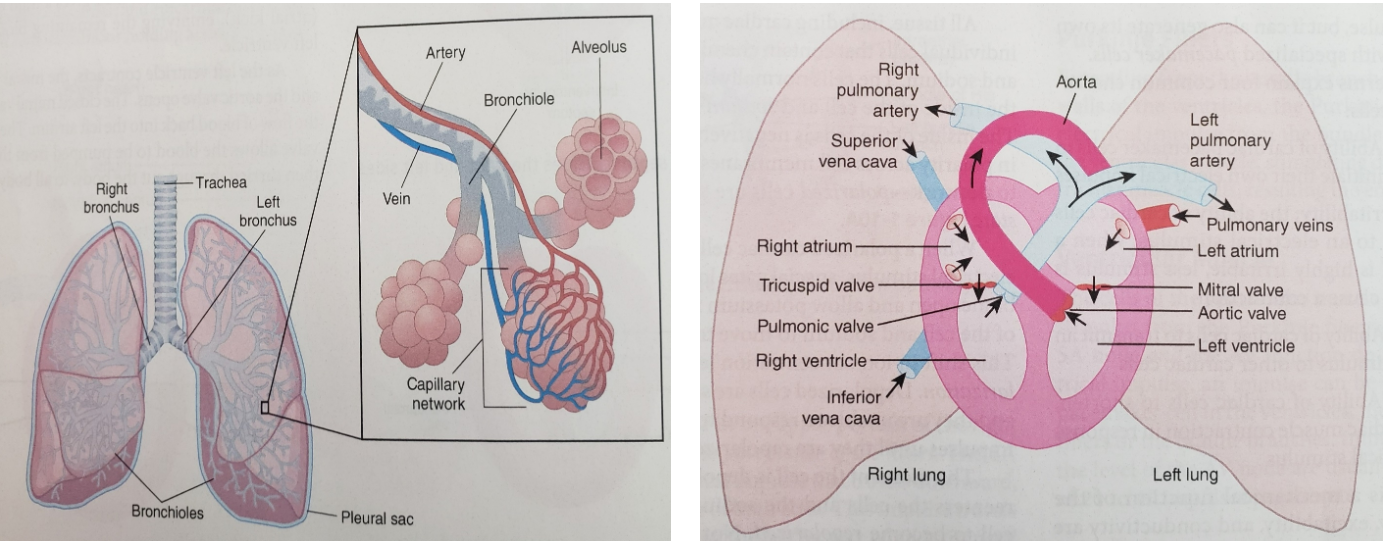
The heart and lungs work in tandem for gas exchange. Key structures include:
Trachea and Bronchi (Right and Left).
Bronchioles and Alveoli: The site of gas exchange surrounded by capillary networks.
Blood Vessels:
Superior Vena Cava and Inferior Vena Cava: Return deoxygenated blood to the right atrium.
Pulmonary Arteries (Right/Left): Carry deoxygenated blood to the lungs.
Pulmonary Veins: Return oxygenated blood to the left atrium.
Aorta: Distributes oxygenated blood to the body via the aortic arch and descending aorta.
Coronary Arteries
These vessels supply the myocardium itself with blood:
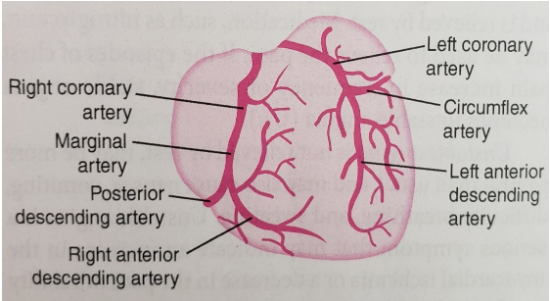
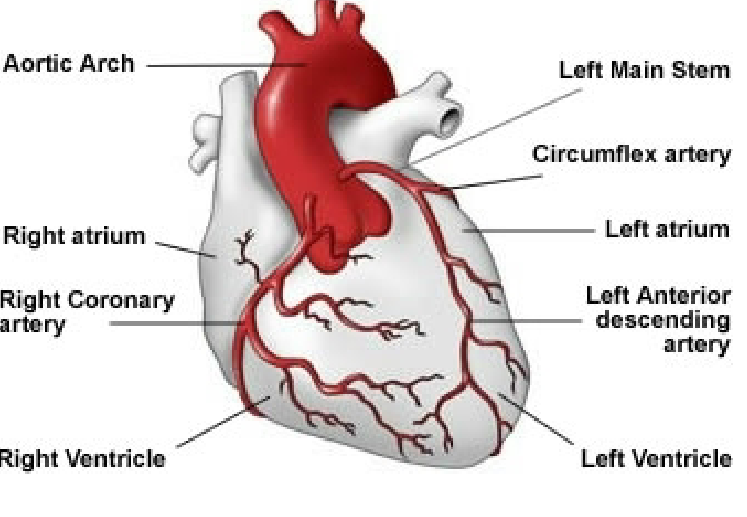
Right Coronary Artery (RCA): Includes the Marginal artery and the Posterior Descending Artery (PDA).
Left Coronary Artery (LCA): Includes the Left Anterior Descending (LAD) and the Circumflex artery (CM).
Hemodynamics: Cardiac Output
Cardiac Output (CO) is the amount of blood pumped by the left ventricle in one minute.
Normal Range: to .
Formula:
Stroke Volume (SV): The amount of blood pumped from the left ventricle per contraction (average is approximately ).
Heart Rate (HR): The number of heartbeats per minute.
Numeric Examples of CO Calculation:
()
()
()
()
Note: Nurses must monitor for signs and symptoms of Decreased Cardiac Output, which indicates the body's metabolic demands are not being met.
Electrophysiology of the Heart
Cardiac muscle cells possess four unique characteristics:
Automaticity: The ability to spontaneously generate an electrical impulse.
Excitability: The ability to respond to an electrical stimulus.
Conductivity: The ability to transmit an electrical impulse to other cells.
Contractility: The ability to shorten and contract in response to an electrical stimulus.
Electrical States
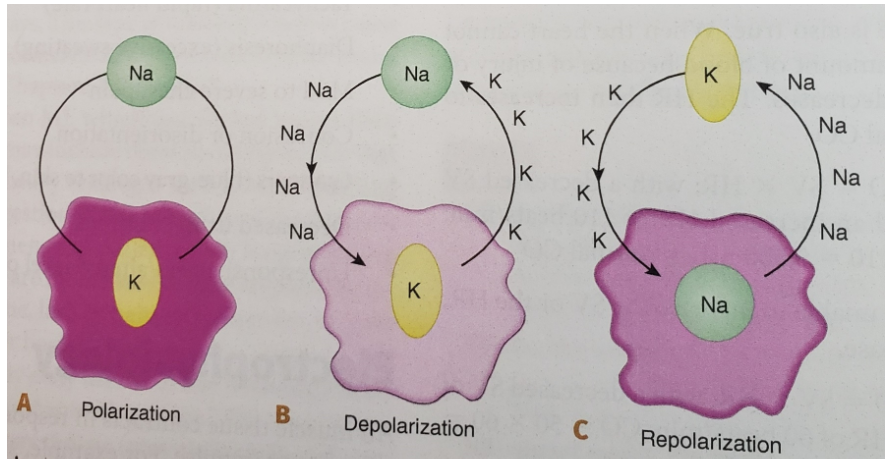
Polarization: The resting state; charges are balanced across the cell membrane (Na+ outside, K+ inside).
Depolarization: The stimulation phase; Na+ rushes into the cell, triggering contraction.
Repolarization: The recovery phase; K+ leaves the cell/charges reset, allowing the heart to fill again.
Electrical Conduction Pathways
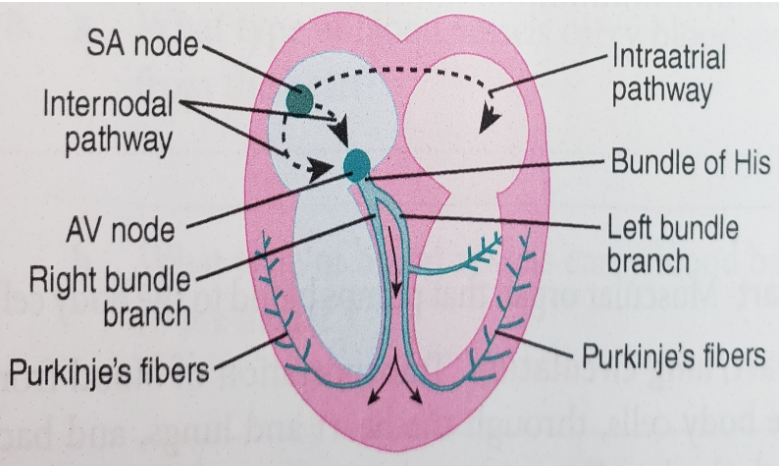
Pacemaker Sites and Heart Rates
Sinoatrial (SA) Node: The primary pacemaker ().
Atrioventricular (AV) Node: Secondary pacemaker ().
Bundle of His
Bundle Branches
Purkinje Fibers / Ventricular Muscle: Final backup pacemaker ().
Autonomic Nervous System (ANS) Influence
Sympathetic Nervous System: Increases heart rate and contractility.
Parasympathetic Nervous System: Decreases heart rate via the Vagus nerve.
Monitoring and Telemetry Setup
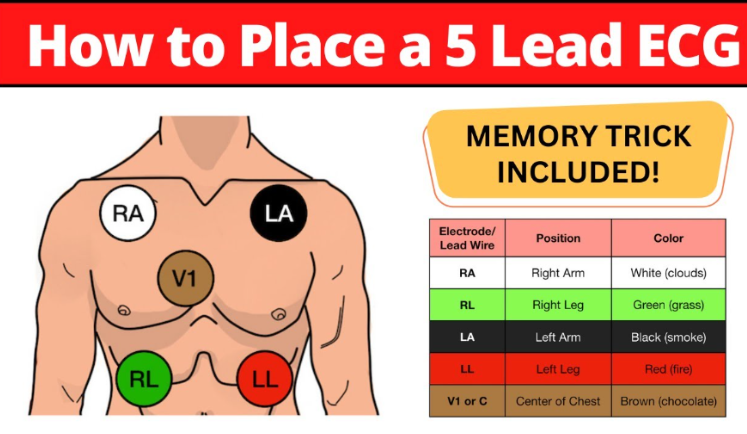
Electrode Placement Memory Trick
To ensure correct lead placement, use the following mnemonic:
White (Right Arm): "Clouds over Grass" (White over Green).
Green (Right Leg): Underneath White.
Black (Left Arm): "Smoke over Fire" (Black over Red).
Red (Left Leg): Underneath Black.
Brown (V1): "Chocolate in my Heart" (Center/precordial).
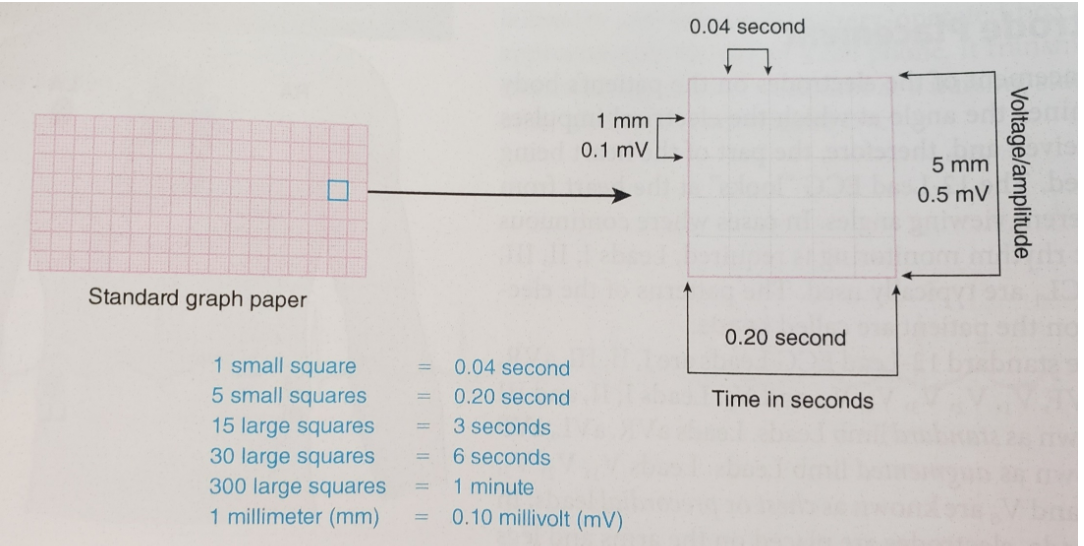
EKG Graph Paper Standards
X-axis (Time):
Y-axis (Voltage/Amplitude):
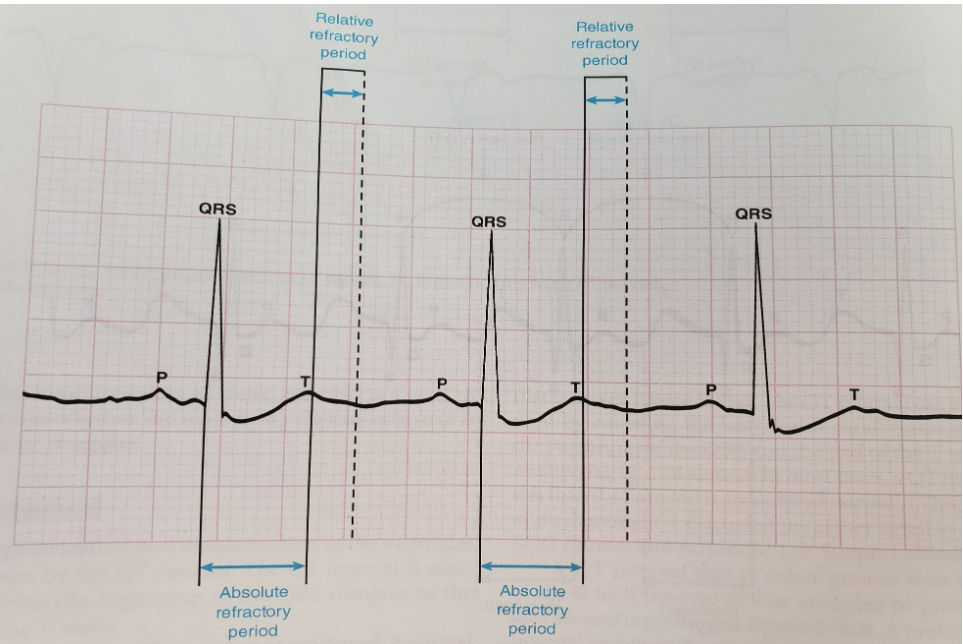
ECG Complex Components and Intervals
Baseline: The isoelectric line where no electrical activity is recorded.
P wave: Represents atrial depolarization.
PR interval: The time for an impulse to travel from the SA node to the AV node. Normal range: .
QRS complex: Represents ventricular depolarization. Normal range: .
ST Segment: The interval between ventricular depolarization and repolarization.
T wave: Represents ventricular repolarization.
QT interval: Represents the total time for ventricular depolarization and repolarization.
Normal: Less than half of the R-R interval.
Prolonged: More than half of the R-R interval or > 0.44\,seconds.
Refractory Periods
Refractory periods represent the time required for cardiac cells to recover their polarized state so they can be stimulated again.
Absolute Refractory Period: The timeframe from the beginning of the QRS complex to the first half of the T wave. During this time, cardiac cells cannot be stimulated to conduct another impulse, regardless of strength.
Relative Refractory Period: The timeframe from the midpoint of the T wave to the end of the T wave. During this time, some cells have repolarized enough that a strong stimulus could trigger an abnormal, slow impulse. This is a vulnerable period for dysrhythmias.
Systematic Process for Rhythm Interpretation
Nurses should observe a consistent process for every EKG strip:
Rhythm: Assess regularity by measuring P-to-P and R-to-R intervals.
Measurements: Document PR interval, QRS complex, and QT interval. Use UTD (Unable to Determine) if measurements cannot be established.
Complex Formation: Evaluate P waves (present, absent, inverted, hidden) and T waves.
Rate: Calculate Atrial and Ventricular rates.
Interpretation: Identify the rhythm.
Treatment: Determine nursing interventions based on findings.
Methods for Calculating Heart Rate
1. Six-Second Strip Method
Used for both regular and irregular rhythms. Count the number of R-waves in a 6-second strip (30 large squares) and multiply by 10.
Example: .
2. Large Square Division Method (R-R Interval)
Used for regular rhythms only. Divide 300 by the number of large squares between two consecutive R-waves.
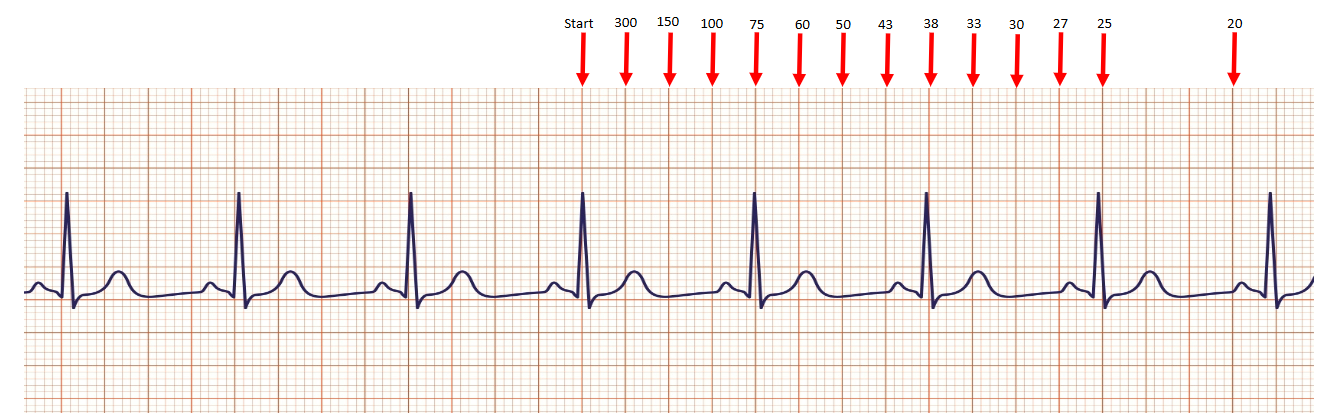
3. Small Square Division Method
Used for very fast rhythms. Divide 1500 by the number of small squares between consecutive R-waves.
Analysis of Specific Rhythms
Sinus Rhythms
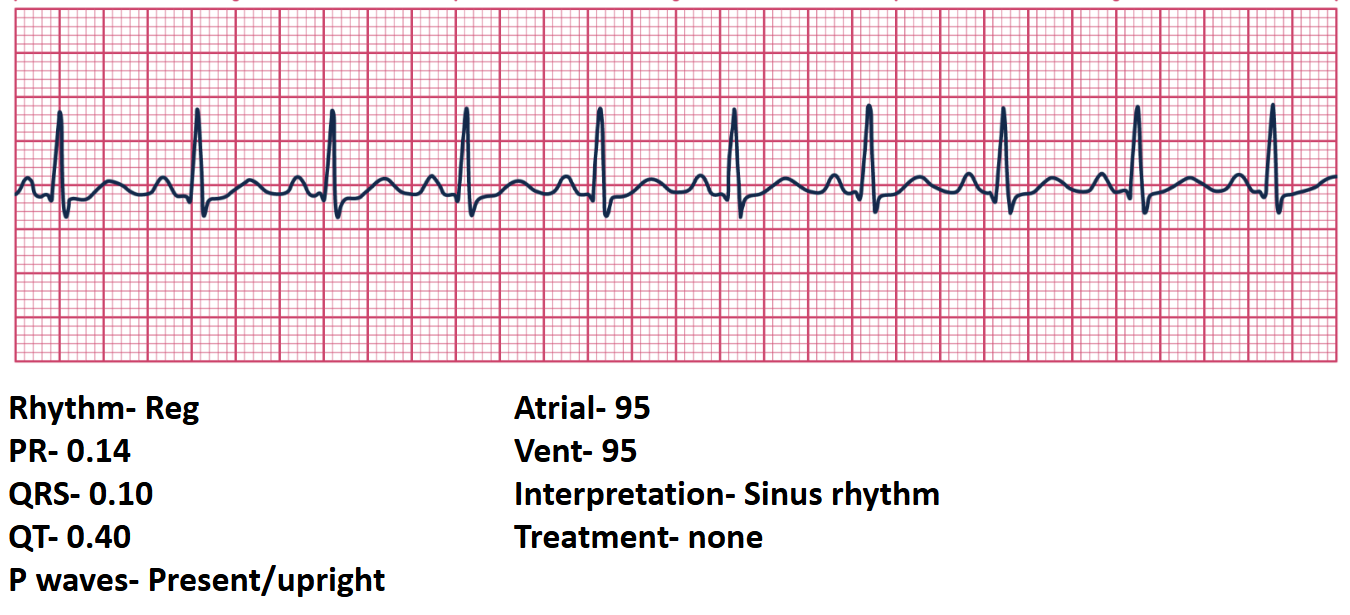
Sinus Rhythm: Regular rhythm; PR , QRS ; Rate . Treatment: None.
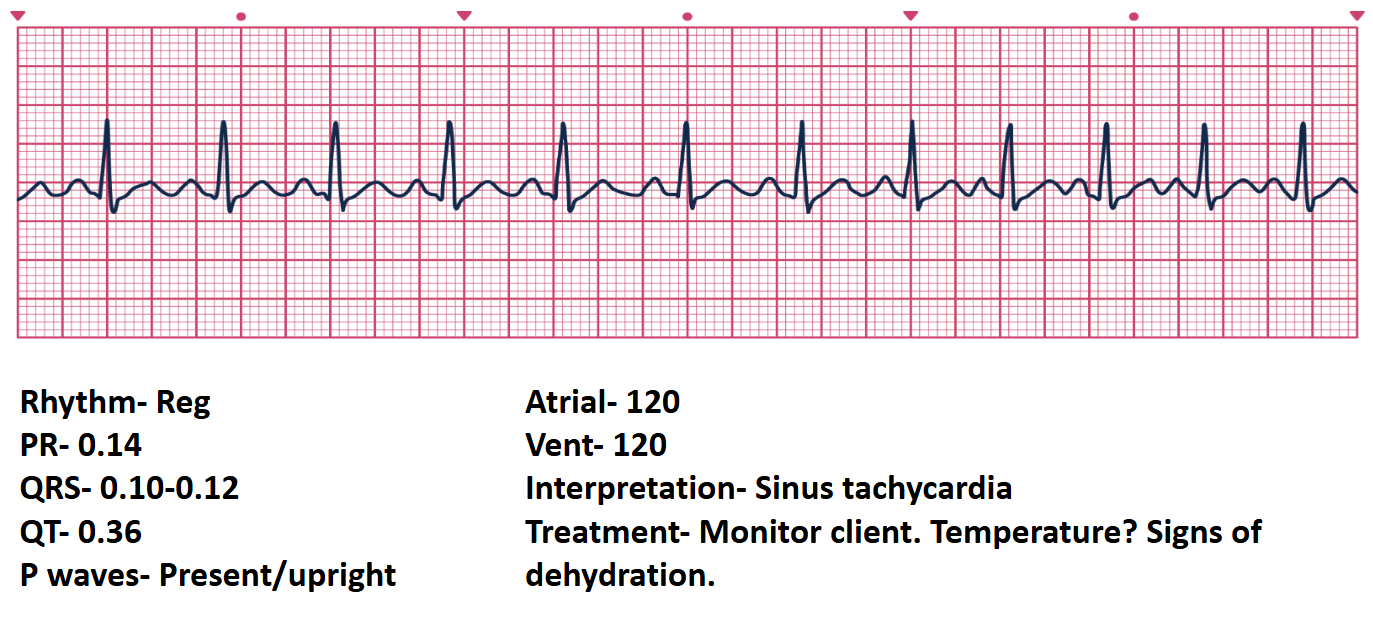
Sinus Tachycardia: Regular rhythm; Rate > 100\,bpm (e.g., ). Treatment: Monitor; assess for causes like fever or dehydration.
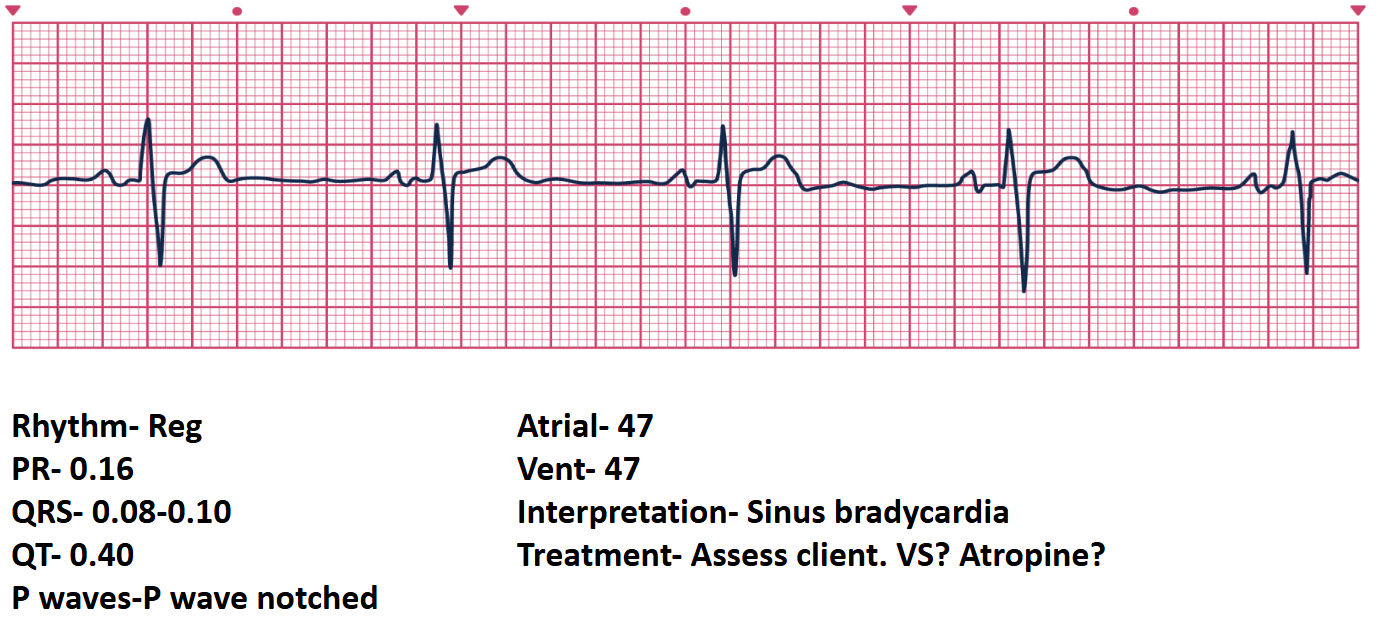
Sinus Bradycardia: Regular rhythm; Rate < 60\,bpm (e.g., ). Note: P waves may be notched. Treatment: Assess vital signs; consider Atropine if symptomatic.
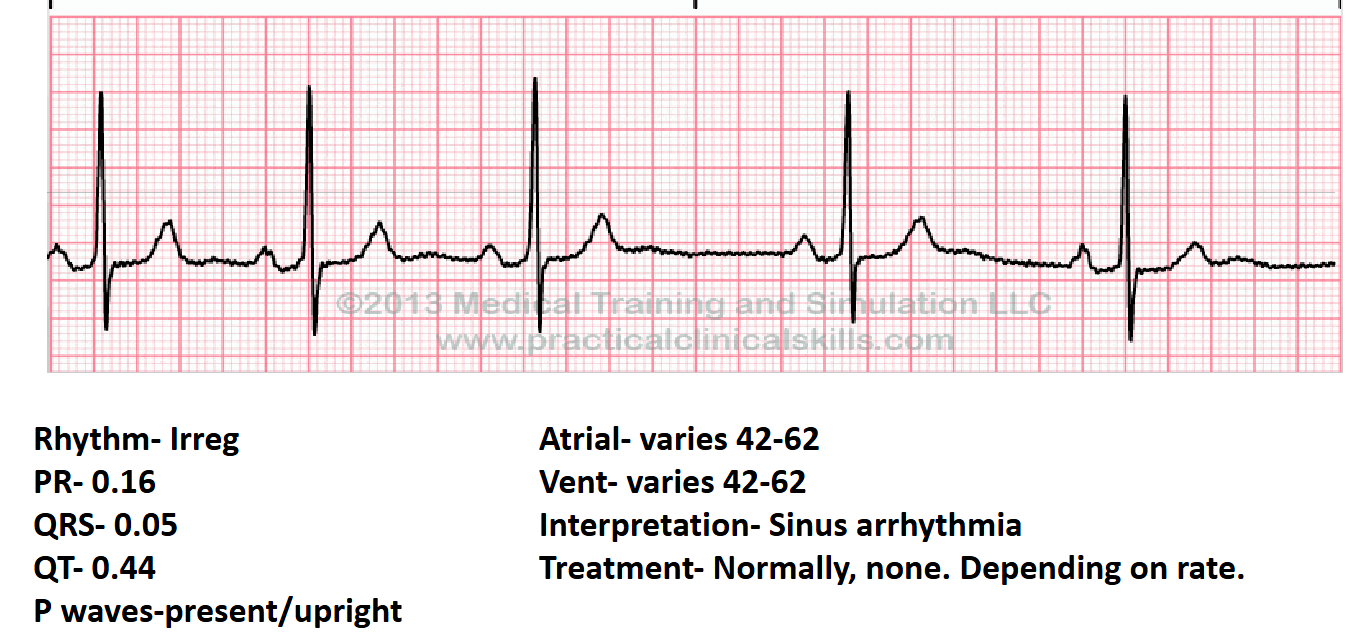
Sinus Arrhythmia: Irregular rhythm; Rate varies (e.g., ). Treatment: Usually none, depending on the rate.
Atrial and Junctional Dysrhythmias
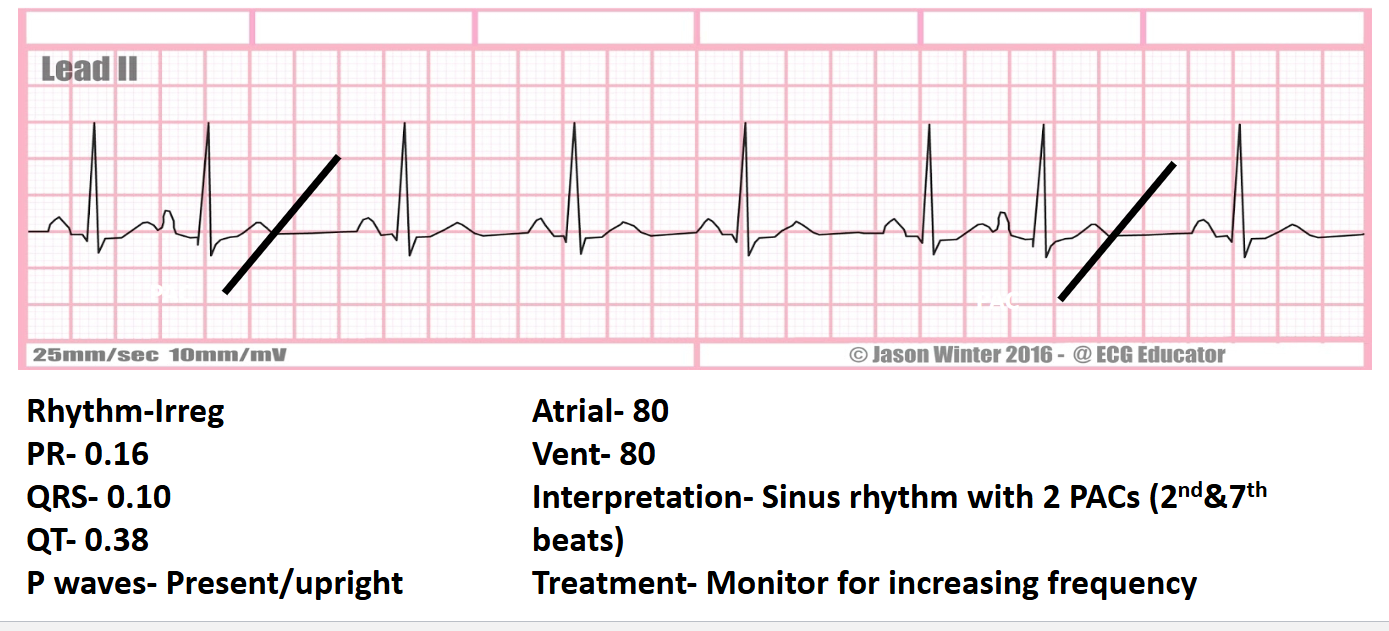
Sinus Rhythm with PACs: Premature Atrial Contractions create an irregular rhythm. Treatment: Monitor for increased frequency.
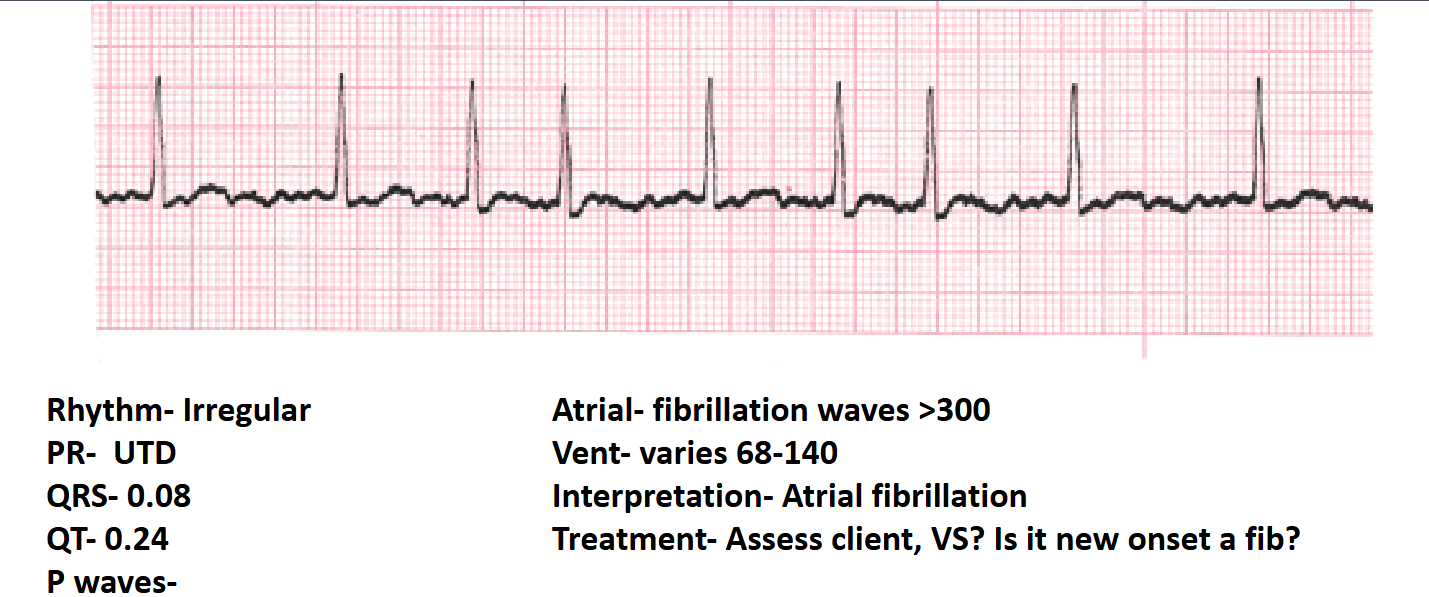
Atrial Fibrillation (A-fib): Irregular rhythm; PR is UTD; Atrial rate > 300\,bpm; Ventricular rate varies (e.g., ). Treatment: Assess vital signs, stability, and determine if new onset.
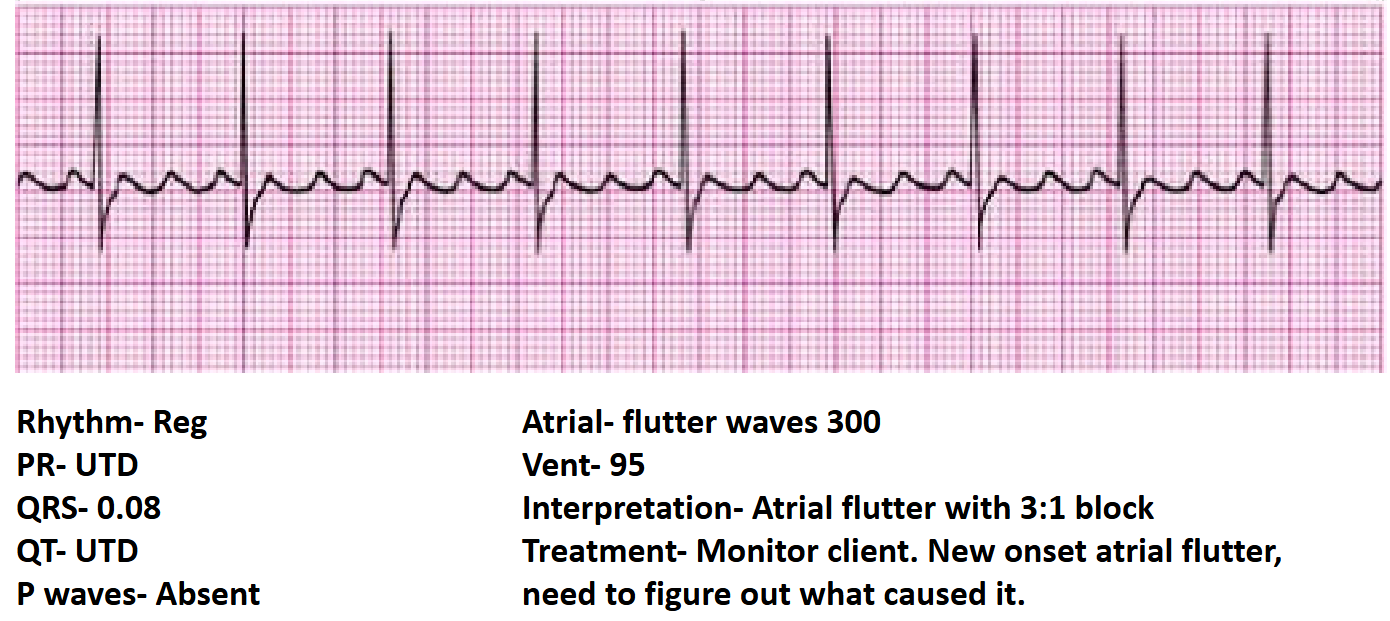
Atrial Flutter: Regular rhythm; P waves absent (Flutter waves present); PR is UTD. Specific conduction ratios (e.g., 3:1 block). Treatment: Monitor and identify underlying cause.
Junctional Rhythm: Regular rhythm; Rate ; P waves are inverted. Treatment: Monitor rate and patient tolerance.
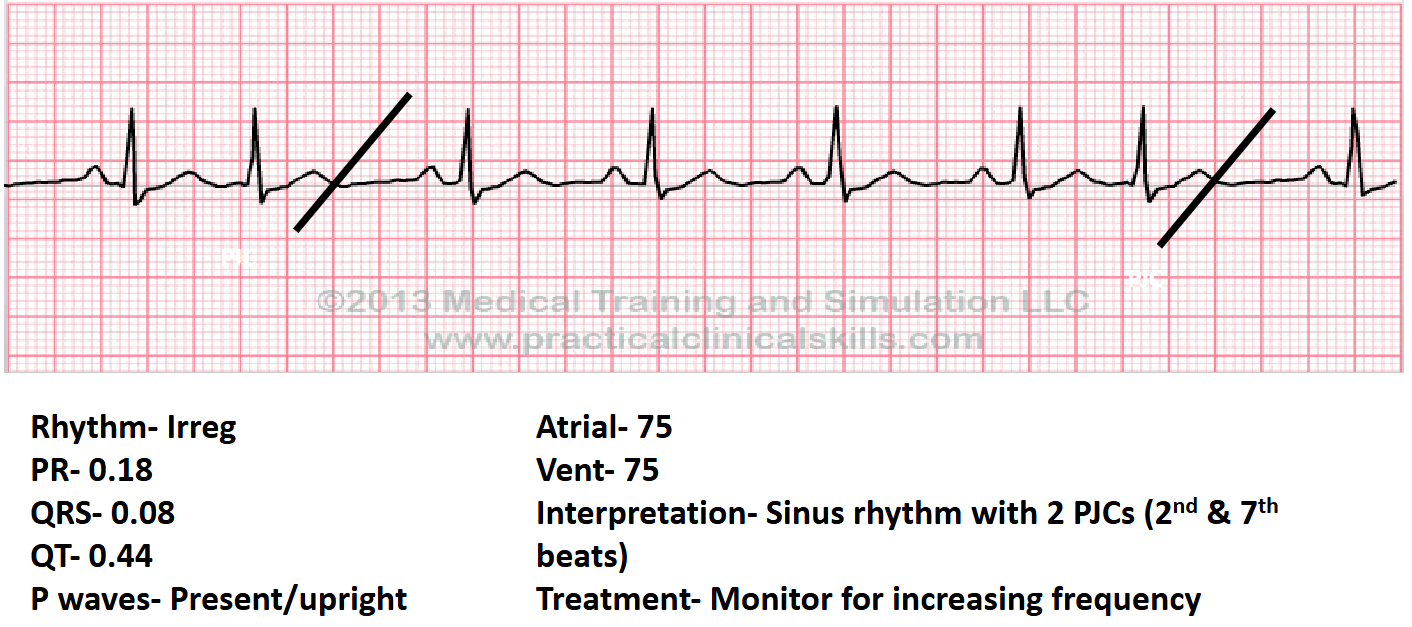
Premature Junctional Contractions (PJCs): Irregular rhythm due to early junctional beats. Treatment: Monitor frequency.
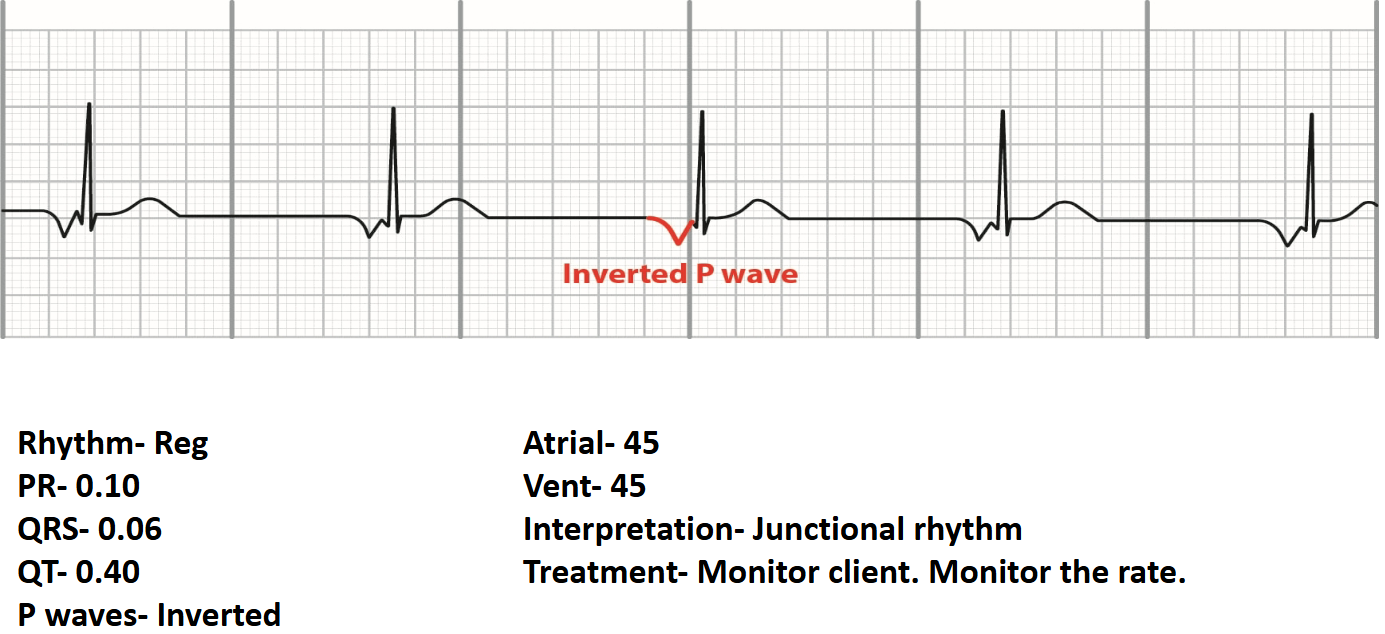
Atrioventricular (AV) Blocks
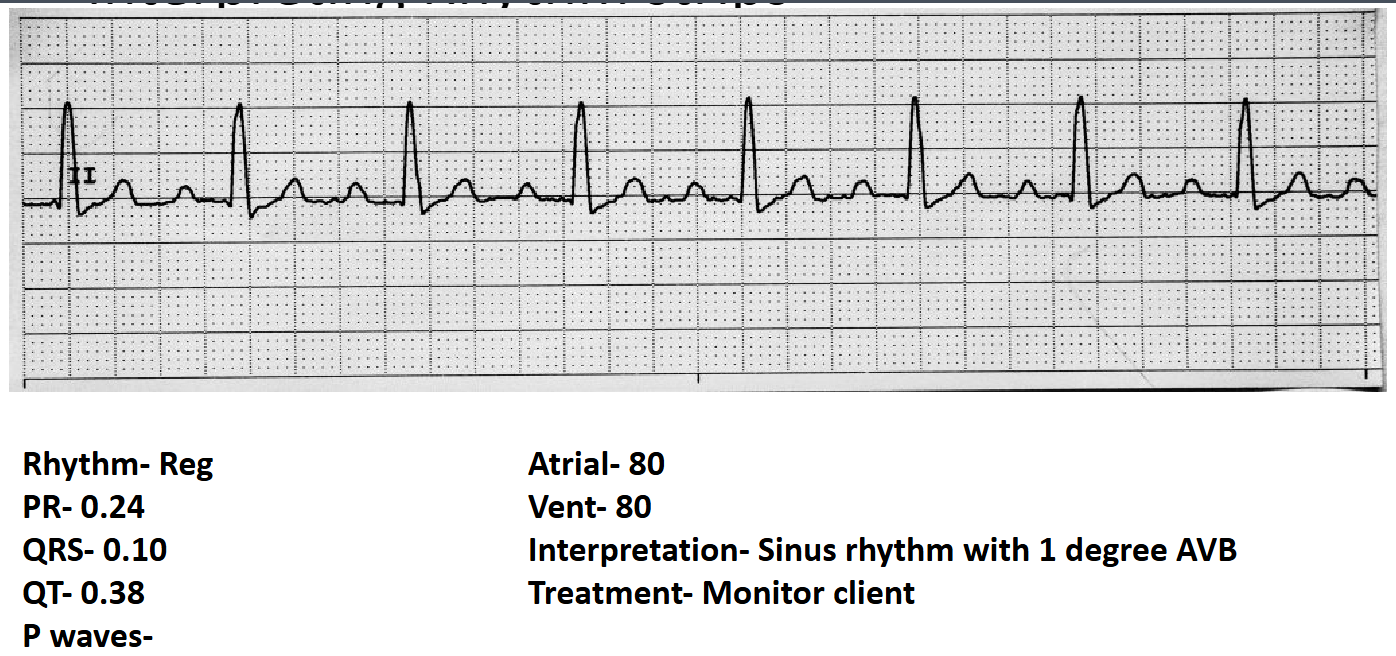
First Degree AV Block: Regular rhythm; PR interval > 0.20 seconds (constant). Treatment: Monitor client.
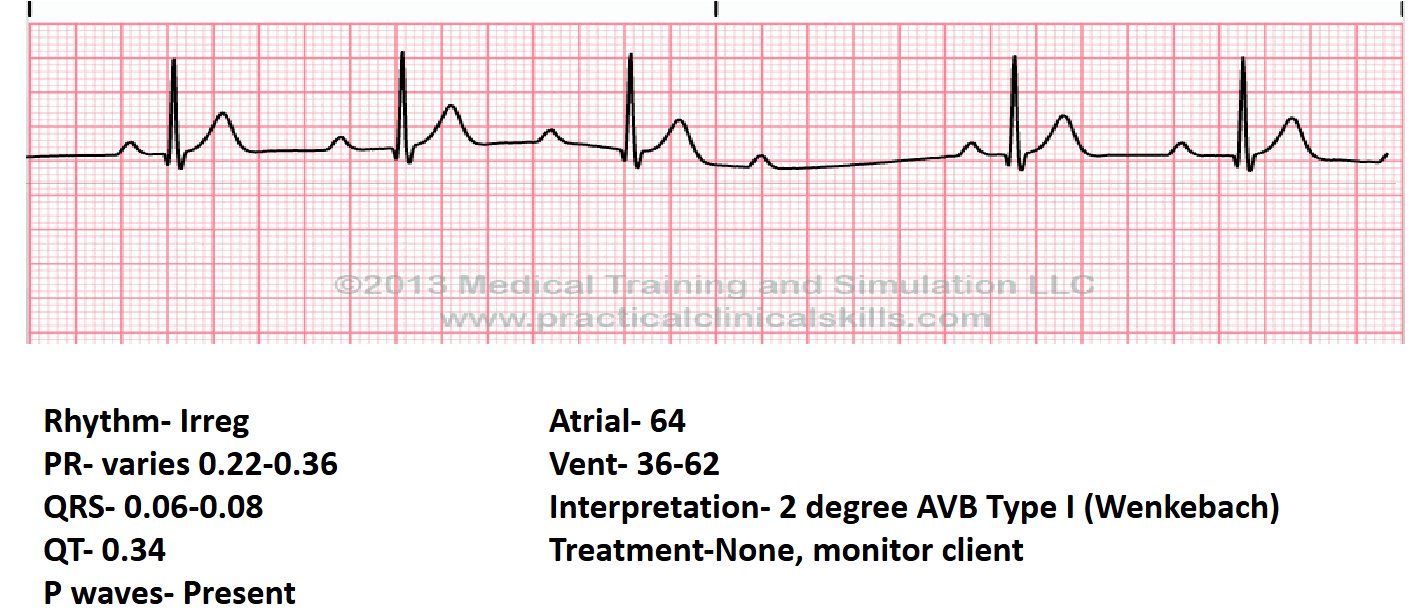
Second Degree AVB Type I (Wenkebach): Irregular rhythm; PR interval progressively lengthens until a QRS is dropped. Treatment: Monitor client.
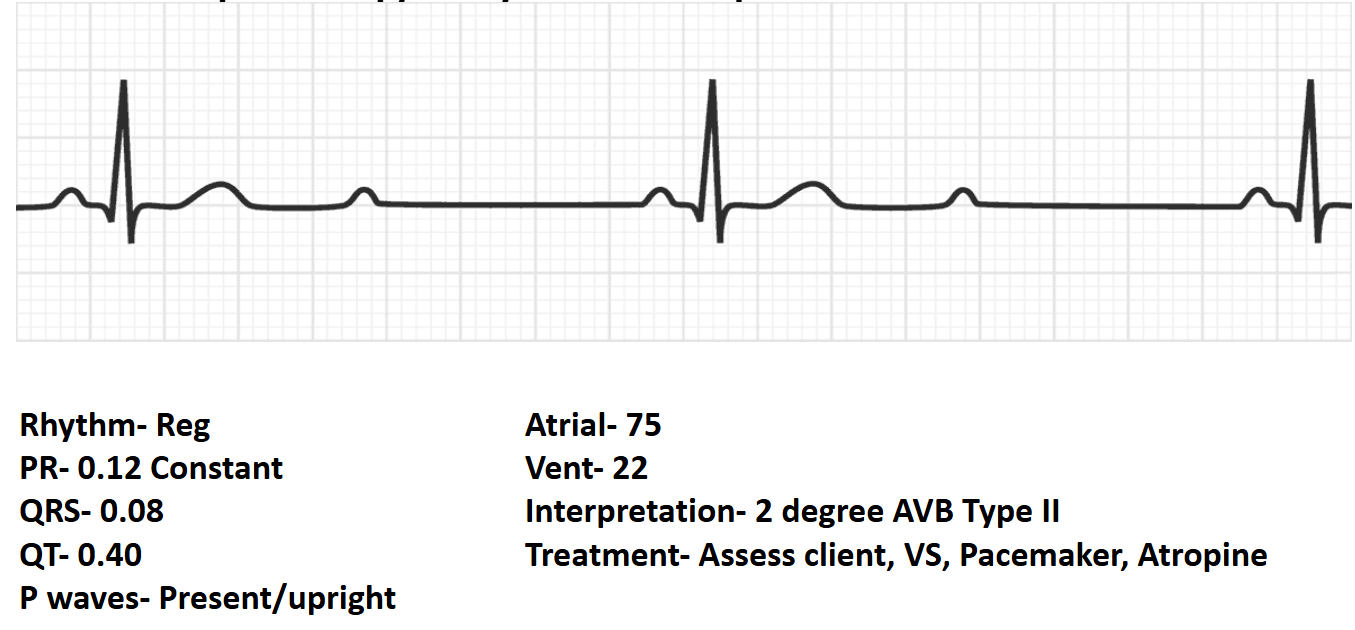
Second Degree AVB Type II: Regular rhythm; PR interval is constant but some P waves are not followed by a QRS. Treatment: Assess vital signs; Pacemaker and Atropine may be indicated.
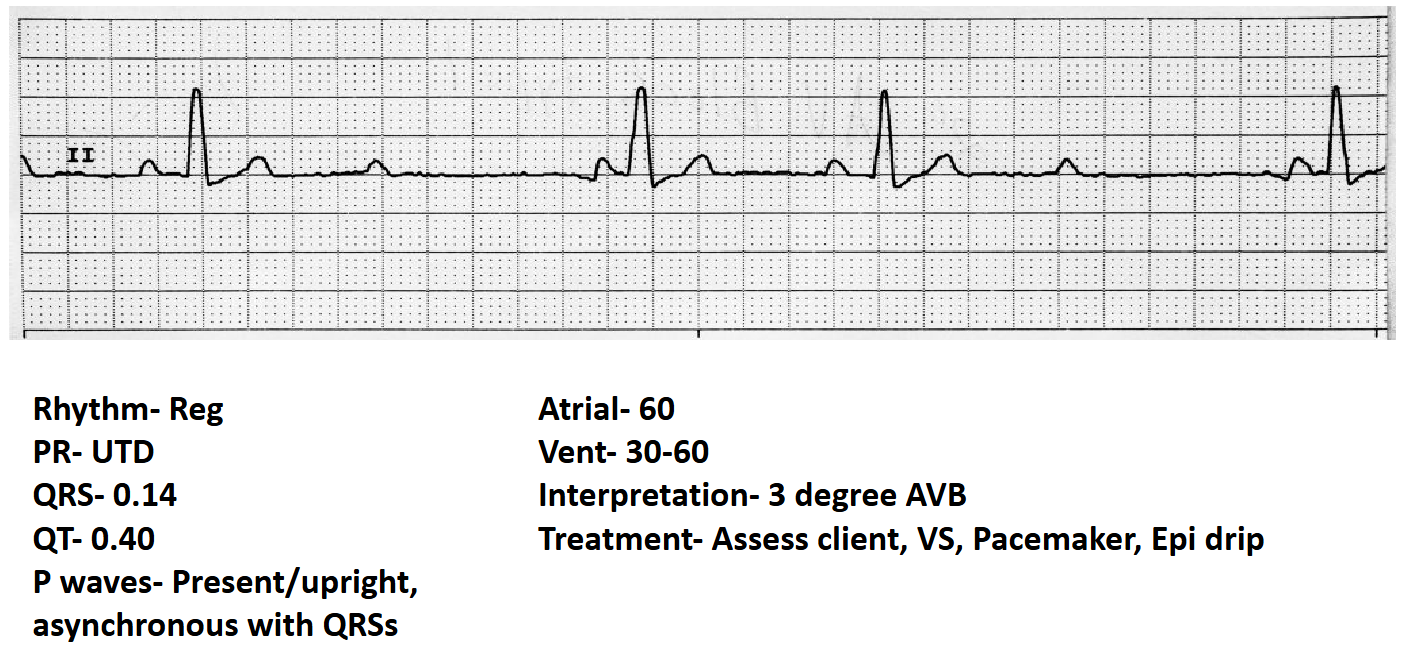
Third Degree AVB (Complete Heart Block): Regular rhythm; Atria and Ventricles beat independently (P waves asynchronous with QRS). Treatment: Assess vital signs; Pacemaker; Epinephrine drip.
Ventricular Dysrhythmias
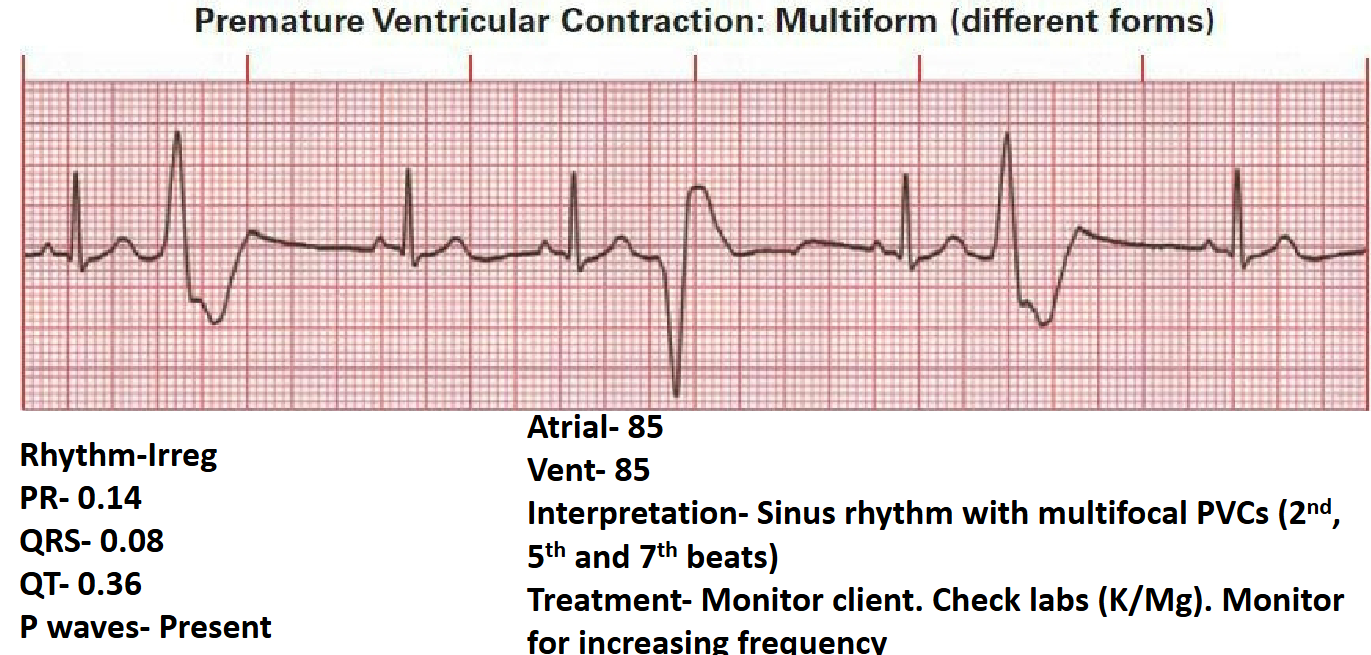
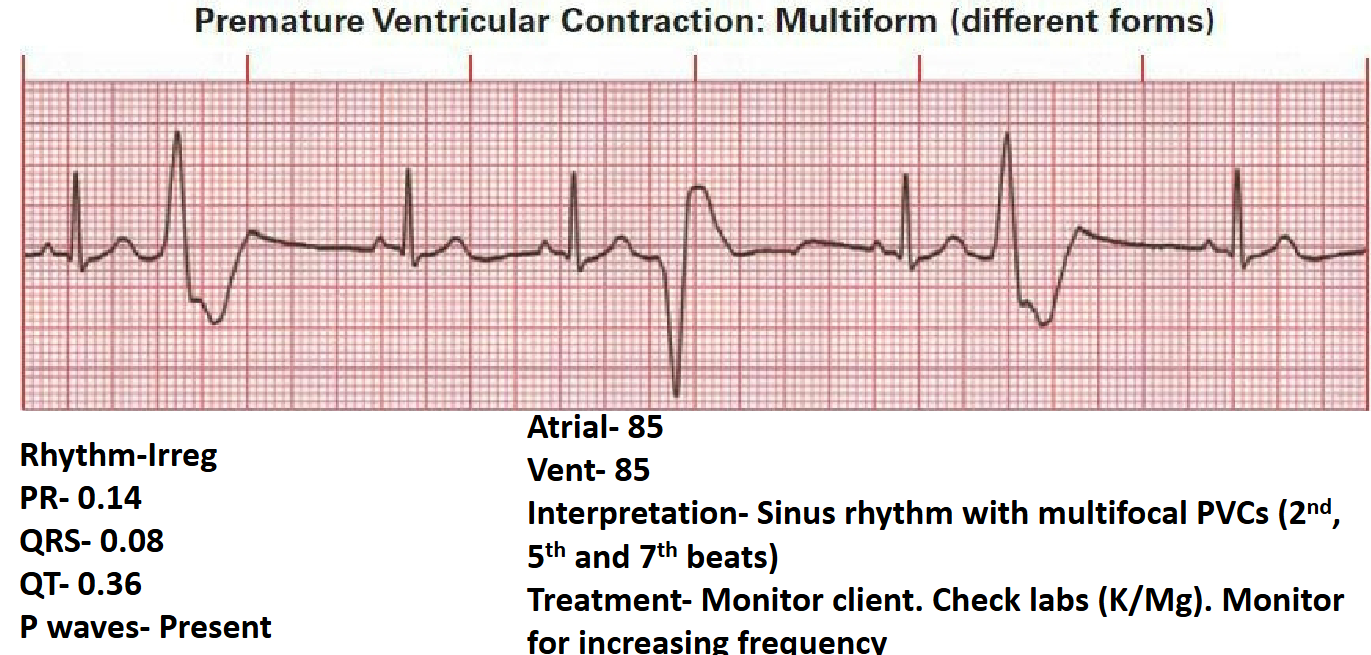
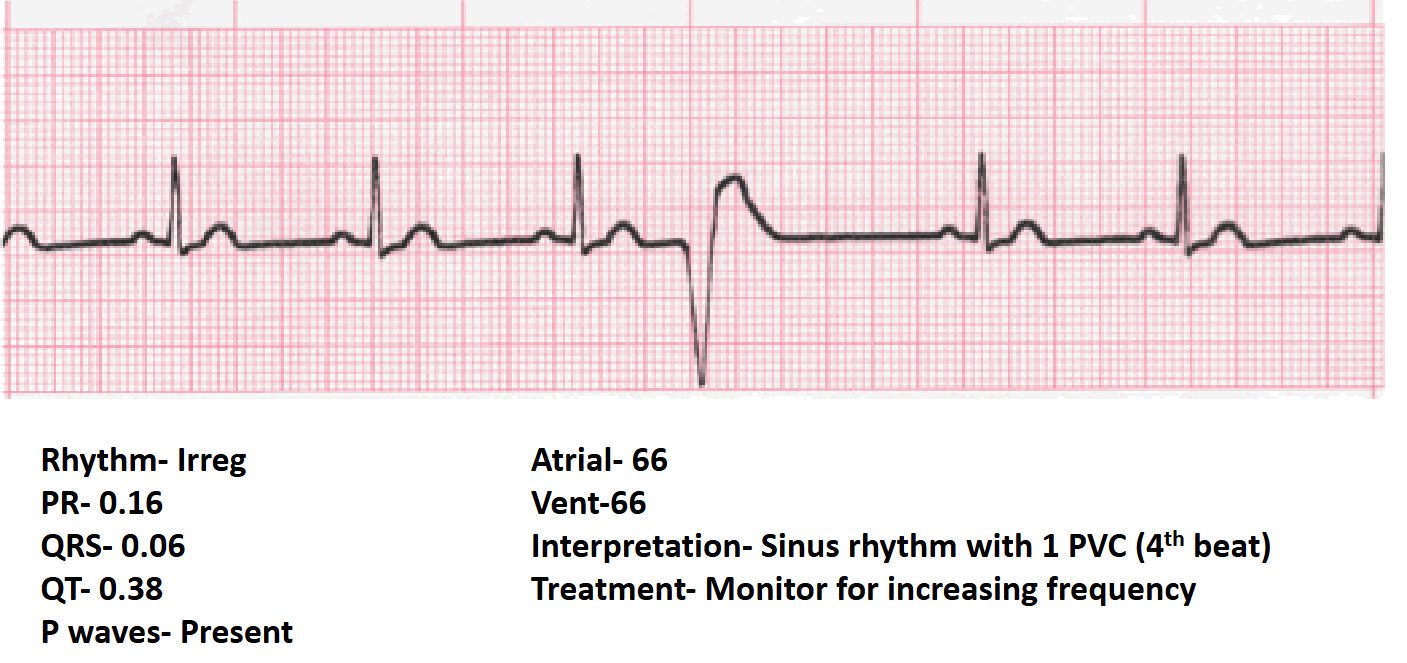
Sinus Rhythm with PVCs (Premature Ventricular Contractions): Irregular rhythm due to wide, early QRS complexes. Can be unifocal or multifocal. Treatment: Check electrolytes (K/Mg); monitor frequency.
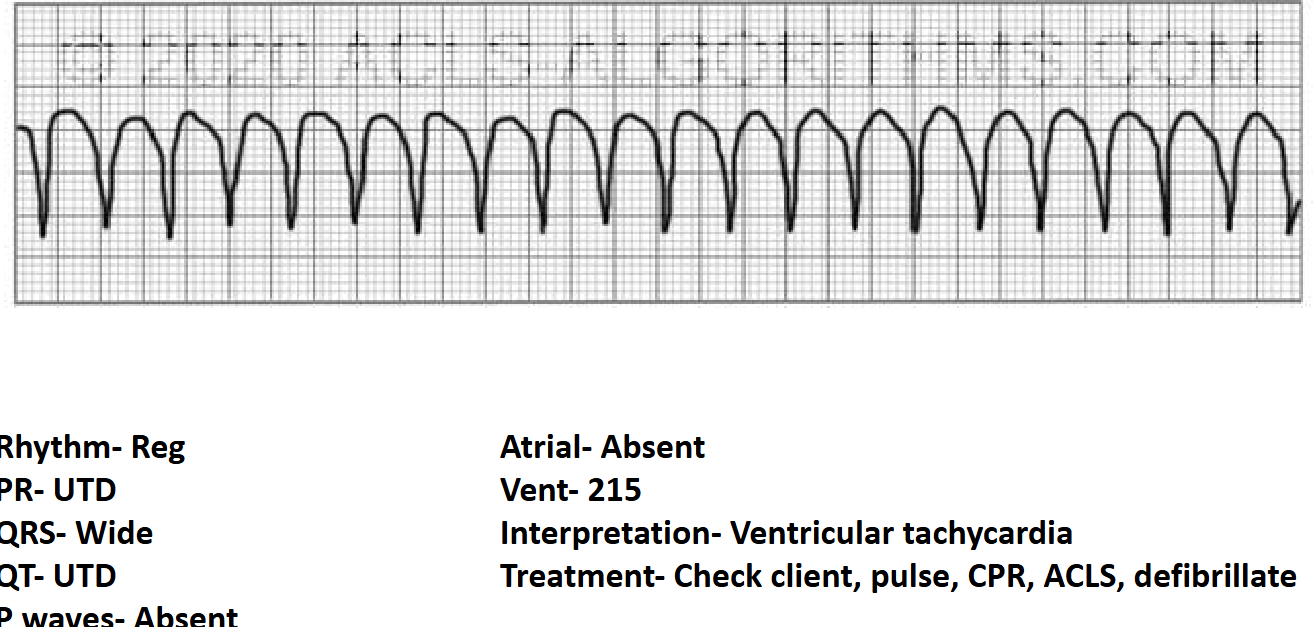
Ventricular Tachycardia (V-tach): Regular rhythm; PR UTD; QRS is wide; Rate > 100\,bpm (e.g., ). Treatment: Check for pulse; CPR; ACLS protocols; Defibrillation.
Ventricular Fibrillation (V-fib): Chaotic electrical activity; no identifiable waves. Treatment: Immediate defibrillation and CPR.
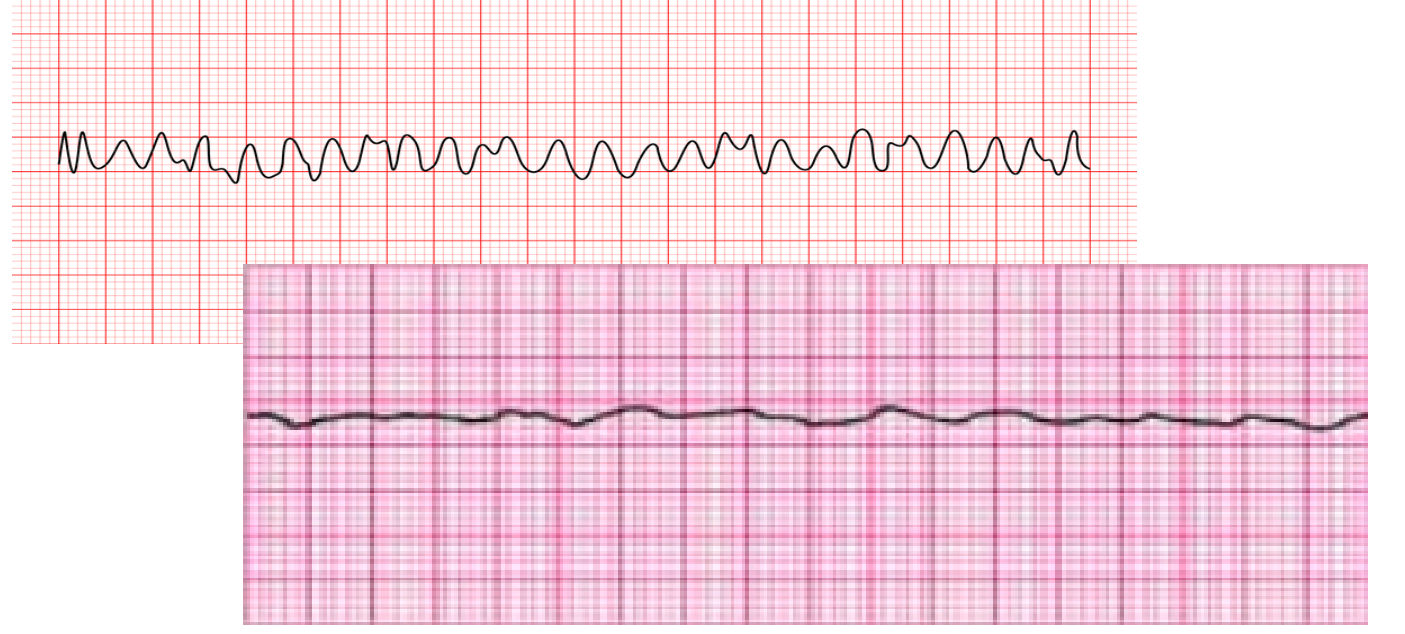
Idioventricular Rhythm: Slow rhythm originating in the ventricles; PR UTD; QRS wide; Rate .