Social Stats Unit 3 Week 2
Chi-square ():
a conditional proportion test of significance for bivariate tables
a statistical significance test designed to evaluate relationships between 2 categorical variables
Recap: tests of statistical significance
purpose: is there sufficient evidence against the null?
when p α, we reject the null hypothesis
statistical significance does not assert causation or indicate the strength of the relationship
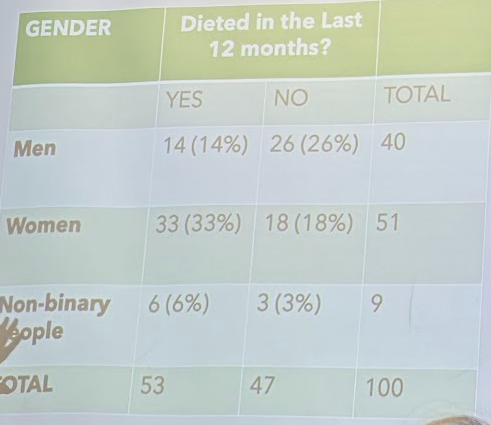
Contingency table for categorical variables:
a table showing the distribution of one variable in rows and another in columns, used to study the association between 2 variables

Variables for the image above:
gender and
dieted in the last 12 months
joint frequencies; cells with data that are not totals
marginal frequencies: cells that are totals
Does this data tell us that men don’t diet as much?
No, we need percentages of the total people in these categories (what percent of men dieted; what percent of women dieted; what percent of non-binary people dieted)
Joint relative frequency:
cell value divided by the size of the full sample
divide each cell by the total (100 in the image)
need to know what marginal frequency is
Marginal relative frequency:
each marginal frequency cell divided by the total sample size
divide each marginal cell by the total (100 in image)
need to know what marginal frequency is
INSERT IMAGE
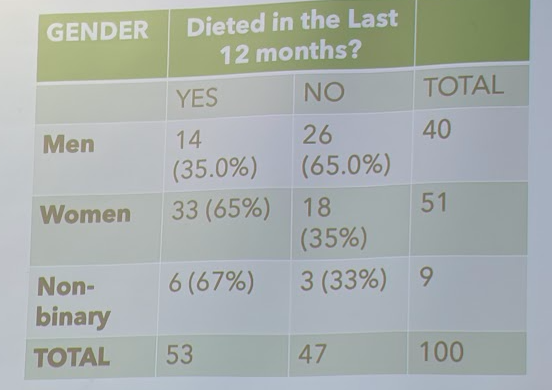
Conditional relative frequency:
joint frequency of each value of the independent variable divided by the marginal frequency of each value of the independent variable
example: 14/40 = 0.35 =35%
work across the row
what can you say about this data:
Women and non-binary people are way more likely to have dieted than men
are these differences across categories strong enough to know it’s not just due to chance
no, that is why we do significance testing

NEED TO FOCUS ON THIS; NEED TO KNOW HOW TO DO THE MOST
Recap: what does a significance test tell us?
if a test deems a relationship between variables to be significant, it means that the proportions/percentages across the variables are sufficiently different from what they would have been if there were no relationship
What would the table look like if there were no relationship between gender and dieting?
the percentages would be the same for each gender category
Chi-square compares observed data versus the expected (null hypothesis) data
association between gender and dieting
no association between gender and dieting

to calculate the expected table, take the column total times the row total and then divide that by the overall total
example: (5340)/100 = 21.2
men: yes: 21.20 and no: 18.80
women: yes: 27.03 and no: 23.97
NB: yes: 4.77 and no: 5.23
How do I know if the difference reflected in a contingency table is statistically significant?
chi-square test
focuses on the difference between observed joint frequency cell values and values that would be expected if there was no relationship between the 2 variables

Steps for using chi-square to assess relationships between variables:
calculate expected values
calculate chi-square
calculate degrees of freedom
find critical value on the chi-square table
interpret results of test
Example:
observed frequencies
expected frequencies

men yes: (14-21.2) / 21.2 = 2.445
men no: (26-18.80) / 18.8 = 2.757
women yes: (33-27.03) / 27.03 = 1.319
women no: (18-23.97) / 23.97 = 1.487
non-binary yes: (6-4.77) / 4.77 = 0.317
non-binary no: (3-5.23) / 5.23 = 0.358
Add all together: = 8.683
Next, calculate the degrees of freedom (df)
definition: the number of independent categories that are free to vary
for chi square: df= (row-1) (column-1)
example 3 by 2 table: (3-1) (2-1) = 2; so 2 degrees of freedom
What to do with your chi-square value:
see if the value of chi-square meets the threshold for the critical value
determine the degrees of freedom (df= (row-1) (column-1)—> (3-1) (2-1) = 2)
find the chi-square critical value for df and a 0.05 significance level on the critical value table. is your chi-square big enough to meet the criteria?
chi-square distribution table:

Interpretation: We can reject the null hypothesis. The observed data are different enough from the “expected” data to assert that there IS a statistically significant association between gender and dieting behaviors.
Chi-square tests can only be used to assess the statistical significance of relationships between categorical variables
Try on your own:
build a conditional relative frequency table
calculate the chi-square
is it significant at the 0.05 level; explain


SPSS chi-square printout
