Aggregate Supply: Introduction and Determinants - Section 4, Module 18
aggregate supply curve - curve showing the relationship between the economy’s aggregate price level and the aggregate output producers are willing to supply
in the short run, aggregate price level and aggregate quantity are directly proportional
why?:
[profit per unit of output = price per unit - production cost per unit]
many of the costs are fixed and can’t be changed for long - largest source of inflexible cost is worker wages - all forms of worker compensation, including employer-paid health care and retirement benefits in addition to earnings
nominal wage - dollar amount of any given wage paid
wages are typically inflexible because nominal wages are determined by past-signed contracts
sticky wages - nominal wages that are slow to fall (even during times of high unemployment) and slow to rise (even in the face of labor shortages)
not sticky forever because eventually contracts will be renegotiated and will take economic circumstances into account
differentiates short run from long run
short run aggregate supply curve - shows the positive relationship between the aggregate price level and the quantity of aggregate output supplied that exists in the short run (time period when many production costs can be counted as fixed)
shifts in the short run aggregate supply curve:
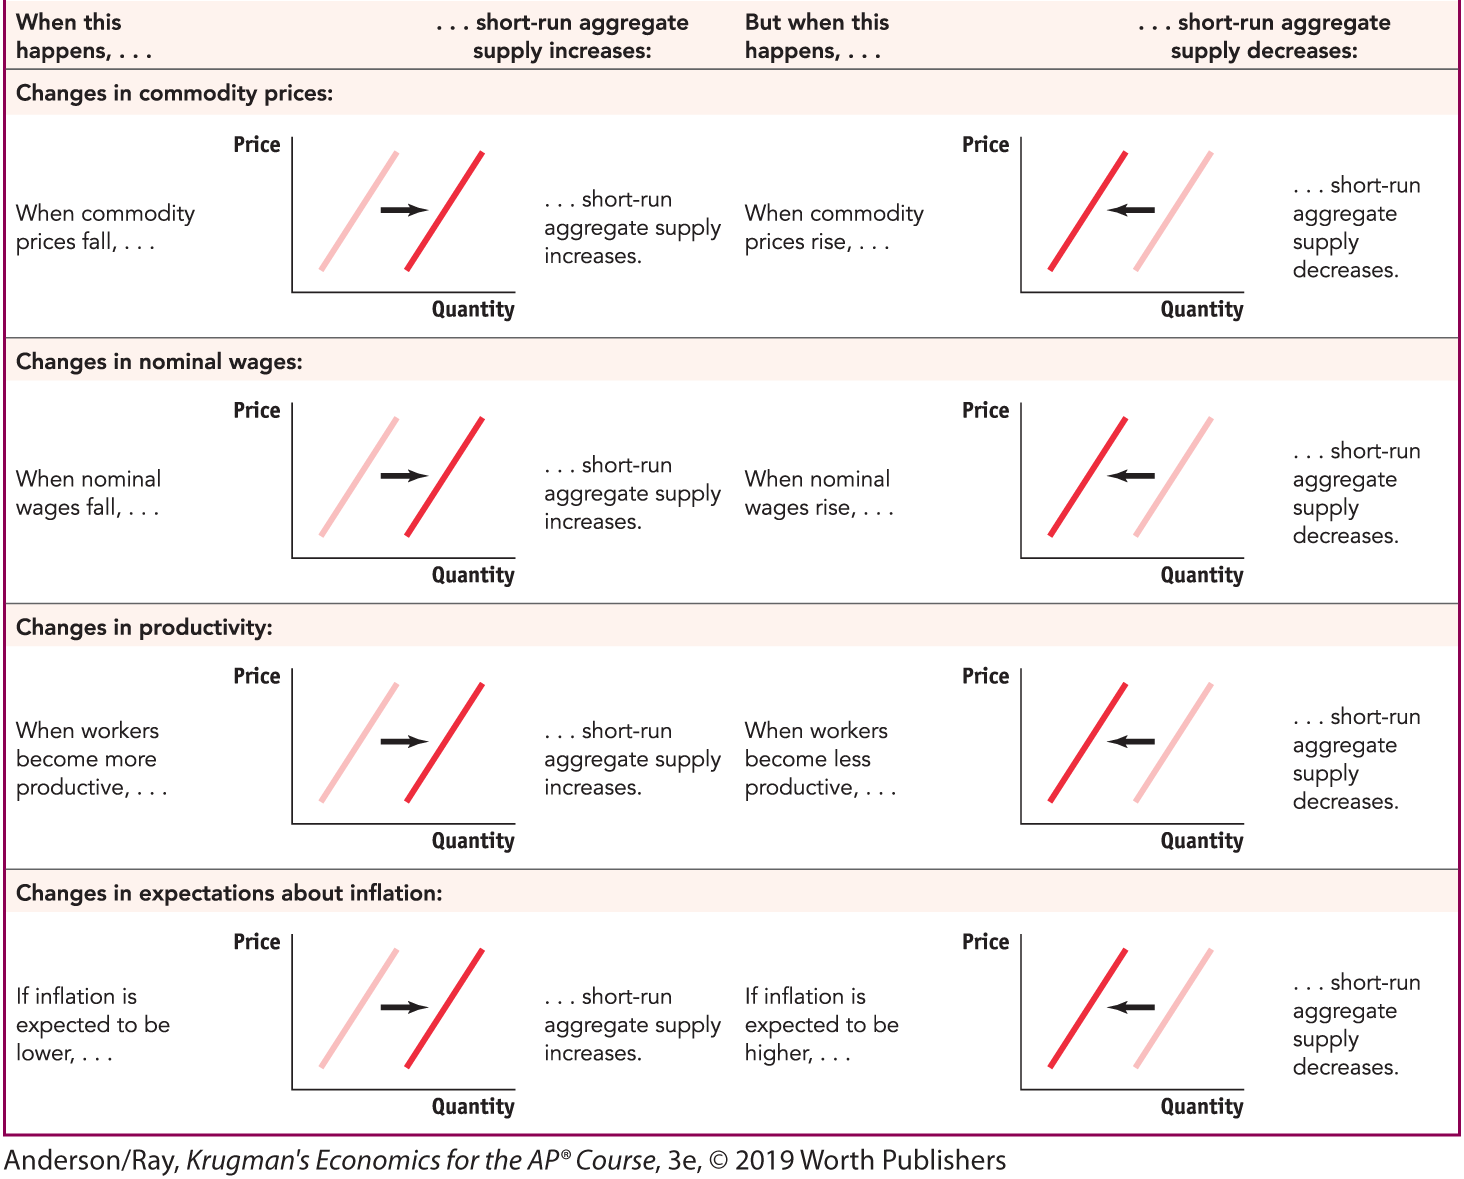
commodity - a standardized input bought and sold in bulk quantities → increase in commodity prices increases production costs across the economy and shifts aggregate supply to the left
not included in real GDP part of aggregate supply curve bc its not a FINAL good
Long Run aggregate supply curve - nominal wages are flexible, not sticky
the long-run aggregate price level does NOT affect the quantity of aggregate output supplied
change in price throughout the economy happens through inflation/deflation, and change input costs and price of the good
long run aggregate supply curve - shows the relationship between the aggregate price level and the quantity of aggregate output supplied that would exist if all prices were fully flexible
fully vertical curve
potential output (Yp) - the level of real GDP the economy would produce if all other prices were fully flexible (x-intercept) — also called the:
full employment output level - the GDP that the economy can attain with full employment of all its resources
shifts of long run supply curve - changes in the quantity of resources, changes in the quality of resources, and technology
Short run to long run