Selecting the Right Test
Statistical Hypothesis Testing Framework
Understanding Major Concepts:
Null Hypothesis (H0): A statement that there is no effect or no difference, which researchers aim to test against.
Alternate Hypothesis (HA): Contradicts the null hypothesis; suggests there is an effect or a difference.
P value: Probability that measures the strength of evidence against the null hypothesis.
Decision Rule: Reject H0 if p < 0.05.
Choosing Statistical Tests
Importance of Fit: Statistical tests serve as tools for hypothesis testing, necessitating the correct selection for the data at hand.
Correct Application: It’s critical to understand not only the selection processes for tests but also the appropriate operational specifics.
Types of Data & Graphing
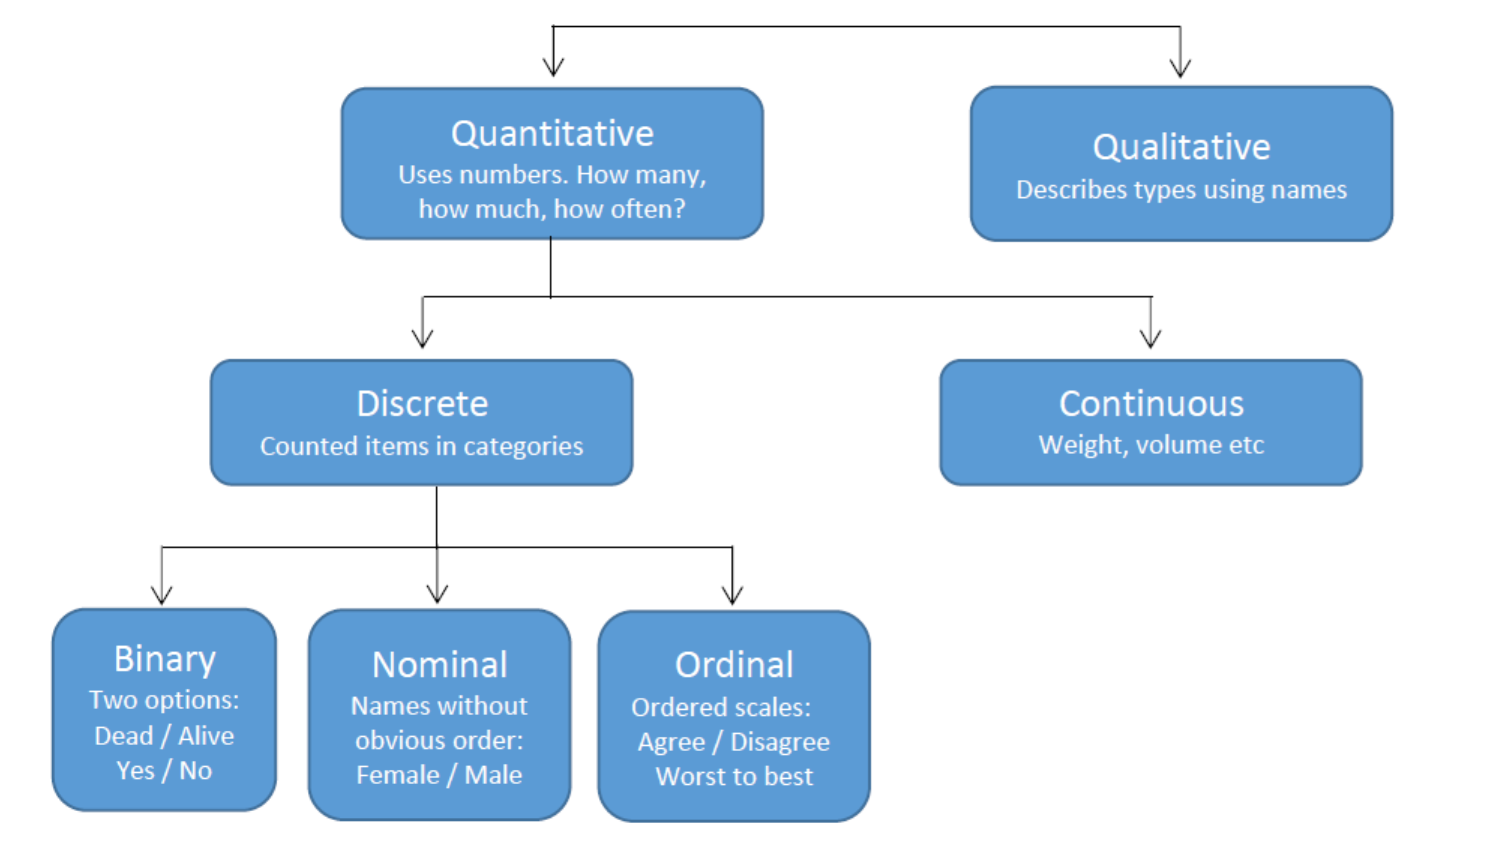
Variables in Analysis
Independent Variable: Considered the cause; plotted on the x-axis.
Dependent Variable: Considered the effect; plotted on the y-axis.
Graph Selection: Understanding the nature of variables aids in deciding which statistical tool is appropriate.
Graph Types
Bar Graphs:
Suited for tests of differences among two or more groups.

Scatter Plots
Proper for examining relationships between two variables.

Normal Distribution Definition
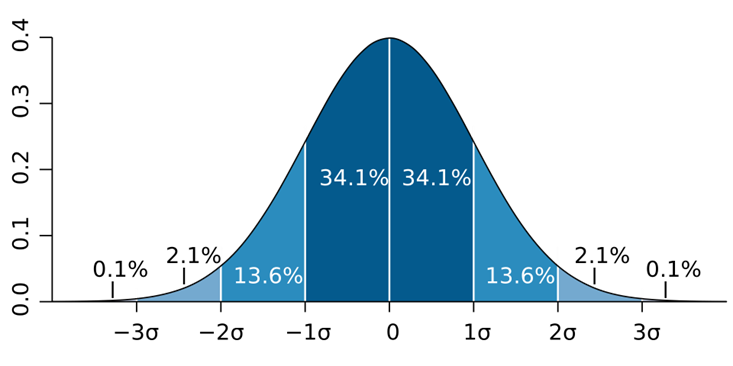
Defined by mean value (µ) and standard deviation (σ).
Statistical Ranges:
68.2% of observations lie within .
95.5% lie within .
Assumptions of Parametric Statistical Methods
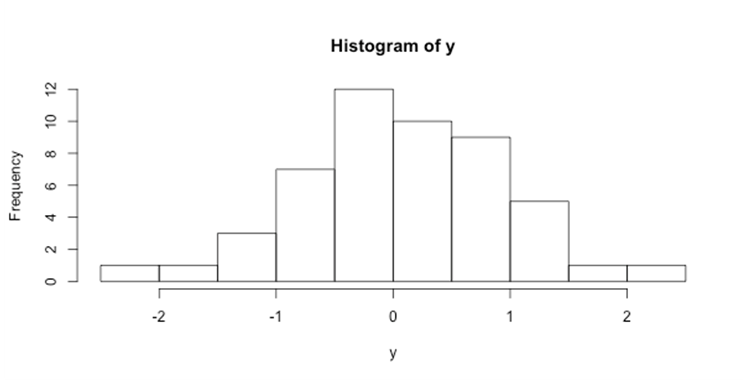
Parametric vs Non-Parametric: Focus on methods suitable for continuous data predominantly following a normal distribution.
Parametric tests assume normal distribution and homogeneity of variances.
The Central Limit Theorem: Suggests that with larger sample sizes, distributions will tend more closely toward normal.
Measuring Sample Characteristics
Sample Mean (x): The average of the sample data.
Sample Standard Deviation (s): Measure of dispersion within the sample data.
Skew: deviation from symmetry caused by a long tail
Kurtosis: Measures the peak and tail thickness of the distribution.
9. Normality Tests
Formulation of Null and Alternate Hypotheses for Normality:
Null hypothesis (H0): Data follows a normal distribution.
Alternate hypothesis (HA): Data does not follow a normal distribution.
Example Test: Shapiro-Wilk test yields a p value for evaluation.
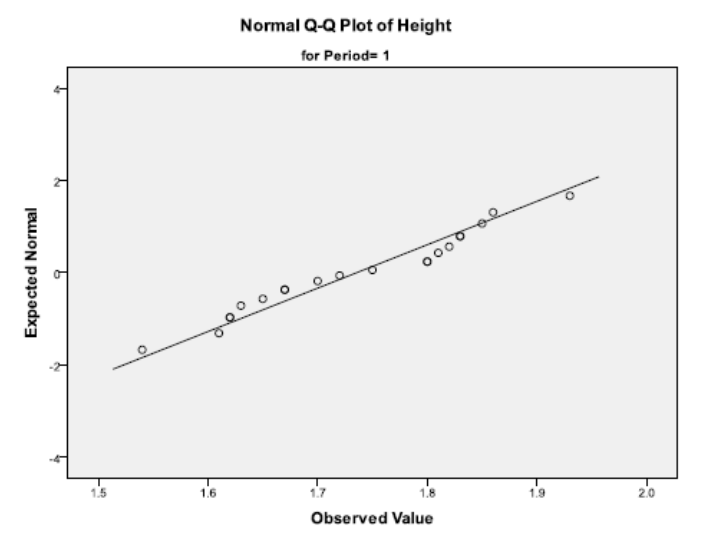
Q-Q Plots
Q-Q plots compare quantiles of observed data against theoretical quantiles of a normal distribution.
Points close to the reference line indicate normality; curves suggest departures from normality.
Caution: Normality tests can yield poor results with small sample sizes, making Q-Q plots more useful.
Parametric tests assume homogeneity of variances, which is crucial for analytical validity.
Error Measurements
Standard Error of the Mean (SEM)
Definition: SEM is the standard deviation of sample means.
Calculation: where n is the sample size.
95% Confidence Interval (CI)
CI indicates the range surrounding the sample mean where the true population mean is expected to fall in 95% of samples.
Representing Data Variability
Always indicate variability around means through:
Sample Standard Deviation.
Standard Error of the Mean.
95% Confidence Intervals.
Clearly state choices in legends upon plotting.
Key Takeaways
Understand key concepts:
Difference between independent & dependent variables.
Recognizing various types of data.
Application and implications of mean, standard deviation, and standard error in context.
Selected parametric tests are reserved for continuous, normally distributed variables.
Utilize normality tests and Q-Q plots to ensure analytical assumptions are met for valid statistical inference.