Rates of reaction
Key Vocabulary
• Concentration – Number of solute particles in a given volume.
• Catalyst – Substance that speeds up reactions by providing a lower-energy pathway.
• Activation energy – Minimum energy needed to start a reaction by breaking reactant bonds.
Rates Of Reaction
• Rate is how fast a reaction occurs.
• Speed varies depending on reactants and conditions.
• Slow: Rusting, fermentation.
• Moderate: Mg + HCl → MgCl₂ + H₂; Na + H₂O → NaOH + H₂.
• Fast: Explosions and combustion.
Measuring Rate Of Reaction
• Rate measured by change in gas volume, mass, or colour over time.
• Observation depends on states of reactants and products.
Methods Of Measuring Rate
CaCO₃ + 2HCl → CaCl₂ + H₂O + CO₂
• Measure volume of CO₂ or loss of mass over time.
Mg + 2HCl → MgCl₂ + H₂
• Measure volume of H₂ or mass decrease.
2H₂O₂ → 2H₂O + O₂
• Measure volume of O₂ or confirm gas with glowing splint test.
Na₂S₂O₃ + 2HCl → 2NaCl + H₂O + SO₂ + S
• Use disappearing cross method to time sulfur cloud formation.
In a Reaction where a Gas is Produced
You can either record volume of gas collected over time or record the decrease in the mass of the reaction flask and contents with time.
CaCO3(s) + 2HCl(aq) → CaCl2(aq) + H2O(l) + CO2(g)
Mg(s) + 2HCl(aq) → MgCl2(aq) + H2(g)
2H2O2(aq) → 2H2O(l) + O2(g)
Na2S2O3(aq) + 2HCl(aq) → 2NaCl(aq) + H2O(l) + SO2(g) + S(s)
1) Measure the volume of gas produced per unit time
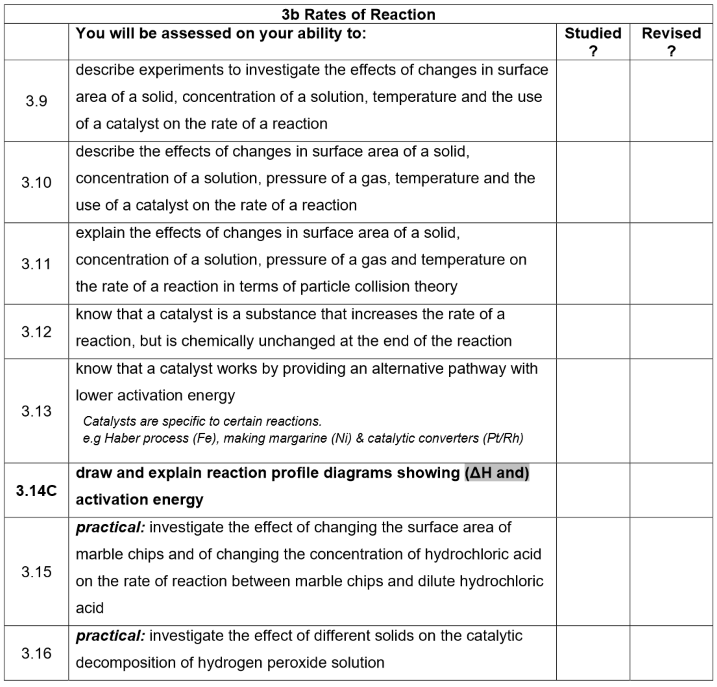
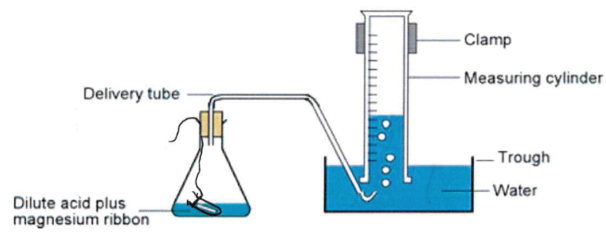
A gas can be collected, and volume measured, in a gas syringe (any gas)
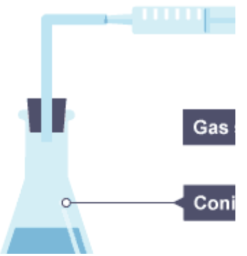
Or By the downward displacement of water in a measuring cylinder (H2, O2). This method is not suitable for soluble gases e.g. HCL, CO2 etc
Sketch a graph of gas produced versus time for the following reaction:
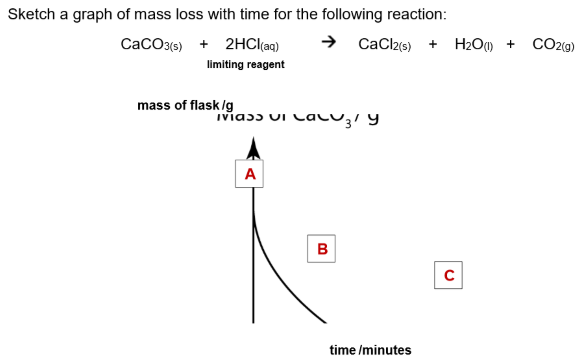
2) Measure mass loss with time
The rate of a reaction that produces a gas can be measured by following the mass loss on a top pan balance as the gas is formed and escapes from the reaction flask. This method is not suitable for reactions producing H2 as its mass is too small to accurately record.
In A Reaction Where A Solid Is Used Up
• Measure time taken for a known mass of solid to disappear.
• Example:
CaCO₃(s) + 2HCl(aq) → CaCl₂(aq) + H₂O(l) + CO₂(g)
• Rate found by timing how long it takes for the solid to fully react or for CO₂ gas to stop forming.
In A Reaction Where A Solid Is Produced
• Measure colour or transparency change of the solution over time.
• Example:
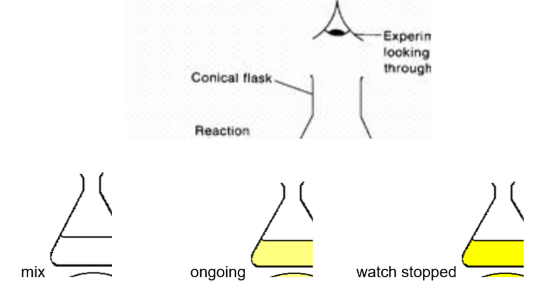
Na₂S₂O₃(aq) + 2HCl(aq) → 2NaCl(aq) + S(s) + H₂O(l) + SO₂(g)
• Yellow sulphur forms, making the solution cloudy.
• Rate measured by timing how long it takes for a black cross beneath the flask to disappear.
• This method is known as the disappearing cross experiment.
Rate And Time
• Fast reactions occur when reactants change to products quickly, giving a high rate.
• Slow reactions take longer, giving a low rate.
• Therefore:
Rate = 1 / Time
Collision Theory
• For a reaction to occur, particles must:
Collide with each other.
Have enough energy (activation energy, Ea).
Collide in the correct orientation.
• More frequent or energetic collisions mean a faster reaction rate.
• Rate can be increased by:Increasing collision frequency.
Increasing particles with sufficient activation energy.
Factors Affecting Rate Of Reaction
• The main factors that change reaction rate are:
Concentration Or Pressure – Higher concentration or gas pressure means more particles, causing more frequent collisions.
Particle Size / Surface Area – Smaller particles have a larger surface area, allowing more collisions at once.
Temperature – Higher temperature gives particles more energy, increasing both collision frequency and energy.
Catalyst – Speeds up reaction by lowering activation energy without being used up.
• Each factor can be studied through experiments to observe its effect on rate.
Effect Of Concentration On Rate: Magnesium And Hydrochloric Acid
Reaction:
Mg(s) + 2HCl(aq) → MgCl₂(aq) + H₂(g)
How To Measure Rate:
• Measure the time taken for the magnesium ribbon to completely react with the acid.
• Alternatively, you could measure the volume of hydrogen gas produced over time.
Procedure:
50 cm³ of 2 mol dm⁻³ HCl was placed in a 100 cm³ beaker.
0.04 g magnesium ribbon was added and the time for it to fully react recorded.
Repeat with diluted HCl (different concentrations made by mixing HCl with distilled water).
Results Table:
Volume of 2 mol dm⁻³ HCl / cm³ | Volume of Water / cm³ | Concentration / mol dm⁻³ | Time / s |
|---|---|---|---|
50 | 0 | 2 | 22 |
40 | 10 | 1.6 | 29 |
30 | 20 | 1.2 | 46 |
20 | 30 | 0.8 | 140 |
10 | 40 | 0.4 | 640 |
Graph:
• Y-axis: Time for Mg to react (s)
• X-axis: HCl concentration (mol dm⁻³)
• The graph shows time decreases as concentration increases, meaning rate increases with concentration.
Conclusion:
• Higher HCl concentration increases rate because there are more H⁺ ions per unit volume.
• This increases the frequency of collisions between H⁺ ions and Mg atoms.
• According to collision theory, more collisions per second with sufficient energy lead to a faster reaction.
Effect Of Concentration On Rate: Magnesium And Hydrochloric Acid
Safety:
• Wear safety glasses and lab coats.
• Follow any additional safety instructions from the teacher.
Reaction:
Mg(s) + 2HCl(aq) → MgCl₂(aq) + H₂(g)
• Magnesium is the limiting reactant.
• The volume of hydrogen collected over time shows the reaction rate.
• Keep reactants separate at first to measure starting time accurately.
Procedure:
Use a measuring cylinder to add 50 cm³ of 2 mol dm⁻³ HCl to a conical flask (HCl in excess).
Place 0.04 g magnesium ribbon in a phial and put it in the acid, keeping the neck above the liquid line.
Place the bung in the flask neck and set up the apparatus to collect hydrogen gas.
Tilt the flask so the acid mixes with the magnesium and start the stop-clock immediately.
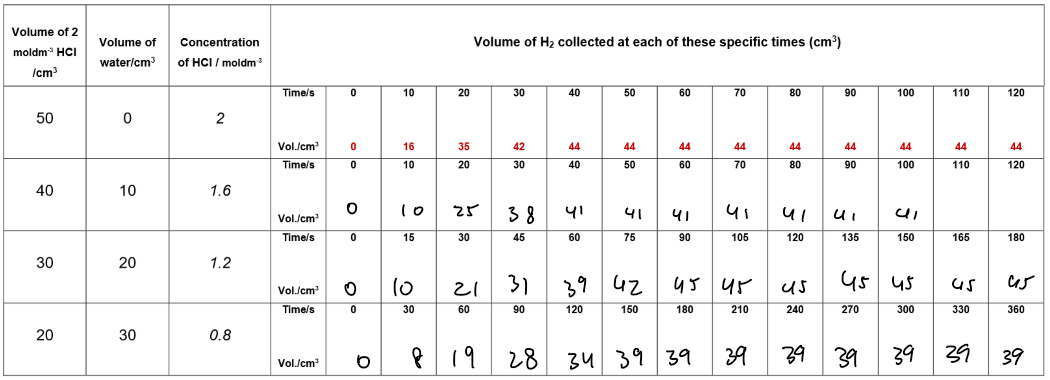
Record the volume of hydrogen collected at set time intervals.
Repeat steps 1–3 with different HCl concentrations, using the dilution table provided.
Results table:
Questions: Effect Of Concentration On Rate
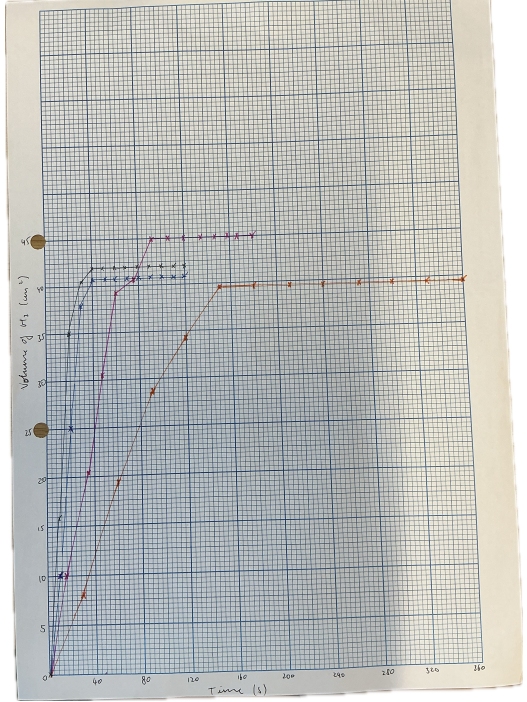
1. Graph of Volume of Hydrogen vs Time
• Plot volume of H₂ (y-axis) against time (x-axis) for all concentrations on the same axes.
• Higher concentrations give steeper curves, showing faster reactions.
2. Rate vs Concentration
• Rate increases as HCl concentration increases.
• Higher concentration → more H⁺ ions → more frequent collisions → faster reaction.
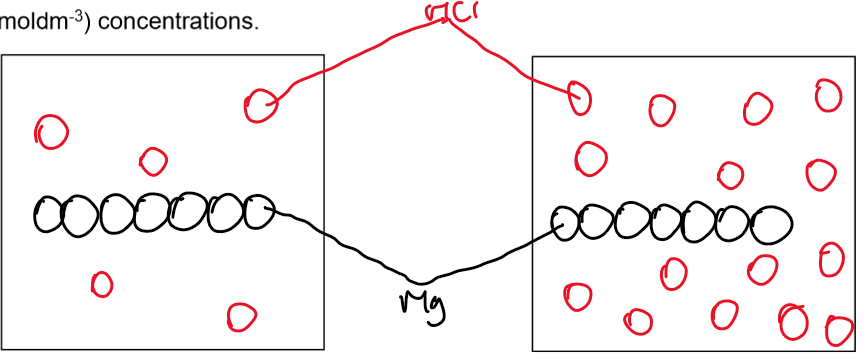
3. Particle Diagrams
• High concentration (2 mol dm⁻³ HCl): Particles close together, more collisions.
• Low concentration (1 mol dm⁻³ HCl): Particles more spread out, fewer collisions.
4. Explanation Using Collision Theory
• As the volume and concentration of HCL increased, more H2 gas was produced per unit time and the rate increase because:
There are more particles of HCL per unit volume
HCL particles are closer together
There are more frequent successful collisions and rate of reaction increases
5. Final Volume Of Hydrogen
• All curves reach the same final volume because the same amount of magnesium reacts completely.
Possible Errors
• Gas escaping from apparatus.
• Delay in starting the stop-clock.
• Inaccurate measurement of HCl or magnesium.
Improvements
• Ensure airtight apparatus.
• Start timing immediately when acid mixes.
• Use accurate balances and measuring cylinders.
Effect Of Particle Size On Rate Of Reaction
Safety:
• Wear safety glasses and lab coats.
• For the demonstration: Splint clamped on the floor, teacher and pupils at least 3 m away, heatproof gloves worn.
Demonstration:
• Small pile of coffee whitener is placed on a mat and lit with a splint.
• Same amount of coffee whitener is sieved and sprinkled over a lit splint.
Observation:
• The sprinkled powder reacts faster and burns more quickly than the solid pile.
The solid pile of coffee whitener is charred and turns black
The sprinkling of coffee whitener burst into flames
Conclusion:
• Larger surface area increases the rate of reaction.
• More particles are exposed, causing more frequent collisions between reactant particles.
Effect Of Particle Size On Rate Of Reaction
Safety:
• Wear safety glasses and lab coats.
• Follow any additional safety instructions from the teacher.
Reaction:
CaCO₃(s) + 2HCl(aq) → CaCl₂(aq) + H₂O(l) + CO₂(g)
• Marble (CaCO₃) is the limiting reactant.
• Rate measured by loss of mass due to CO₂ escaping.
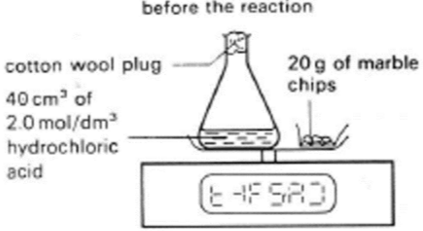
Procedure:
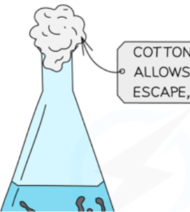
Pour 40 cm³ of 2 mol dm⁻³ HCl into a 100 cm³ conical flask and place a loose cotton wool plug in the neck.
Weigh 20 g of large marble chips on folded paper.
Place flask with HCl and paper with marble on a balance and tare it.
Add marble to HCl, start stop-clock, replace cotton wool, and put flask and paper back on balance.
Record loss of mass at intervals until reaction stops.
Repeat using small marble chips with same acid volume.
Observation / Conclusion:
• Small marble chips react faster than large chips.
• Smaller particles have larger surface area, increasing collision frequency and reaction rate.
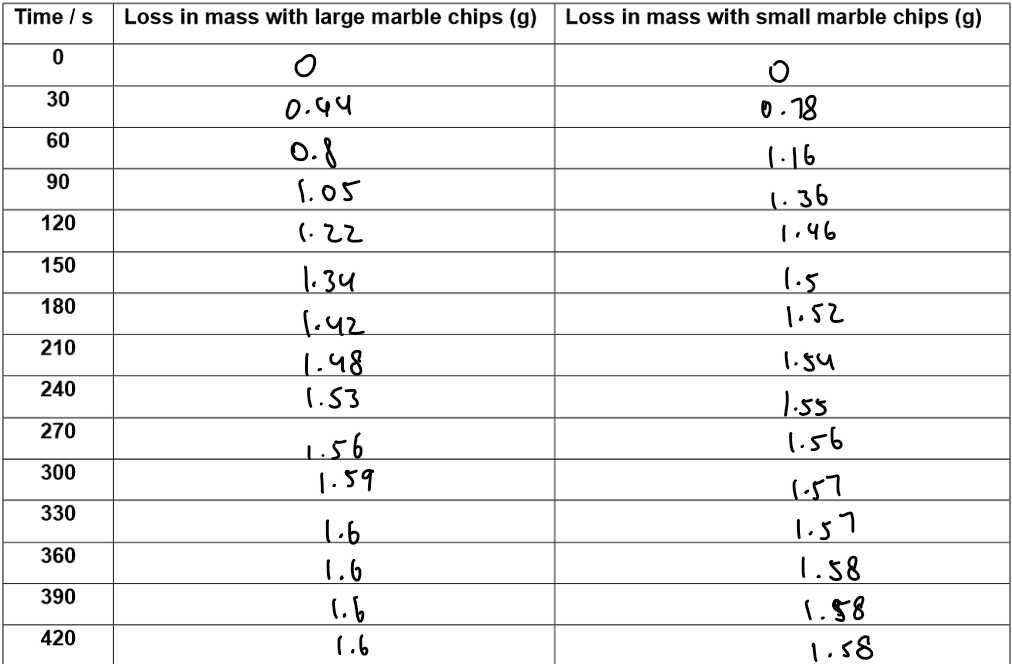
Results:
Analysis Of Results: Marble And HCl
1. Purpose of Cotton Wool Plug
To allow CO₂ gas to escape while preventing splashes of acid.
2. Why Apparatus Loses Mass
CO₂ gas is produced.
Gas escapes from the flask, reducing the total mass measured.
3. Variables
Independent variable: Size of marble chips.
Dependent variable: Loss of mass / rate of reaction.
4. Variables To Keep Constant
Volume of HCl.
Concentration of HCl.
Mass of marble.
Temperature / same apparatus setup.
5. Graph
Y-axis: Loss in mass (g)
X-axis: Time (s)
Both large and small chips plotted on the same axes.
Small chips curve is steeper → faster reaction.
6. Final Loss In Mass
Same amount of marble reacts in both experiments.
Total mass of CO₂ released is identical.
7. Reactant In Excess
HCl is in excess.
Evidence: Marble is completely used while HCl remains.
8. Why Reaction Slows And Stops
Less solid surface area exposed as marble dissolves.
Fewer collisions occur as reactants are used up.
Fewer particles with sufficient energy are available.
Eventually all marble reacts → reaction stops.
9. Which Reacts Faster
Small chips react faster (steeper graph curve).
Larger surface area exposes more particles.
More frequent collisions occur.
More successful collisions → faster reaction.
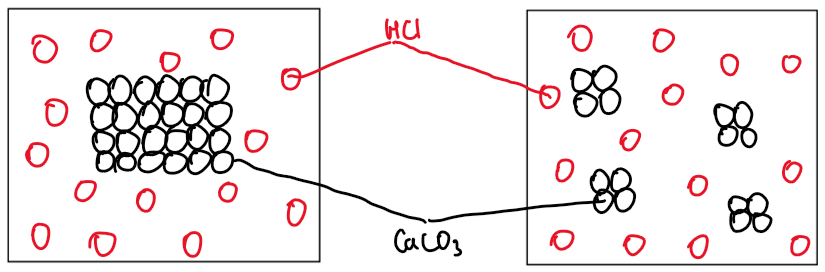
10. Particle Diagrams
Effect Of Temperature On Rate Of Reaction
Reaction:
Sodium thiosulphate + hydrochloric acid → sodium chloride + water + sulphur dioxide + sulphur

Rate measured by time taken for sulphur precipitate to obscure a cross.
Procedure:
Measure 10 cm³ sodium thiosulphate + 40 cm³ water into a conical flask.
Measure 5 cm³ dilute HCl in a separate cylinder.
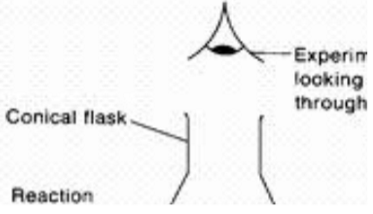
Add HCl to the flask, start stop-clock immediately, swirl to mix, place on white paper marked with a cross.
Record maximum constant temperature of the mixture.
Observe the cross from above and stop the clock when it disappears.
Dispose of mixture in the pink stop bath; notify teacher when replacement is needed.
Repeat at approximately 30°C, 40°C, 50°C, and 60°C by warming sodium thiosulphate before adding HCl.
Record the maximum temperature reached for each trial.
Results:
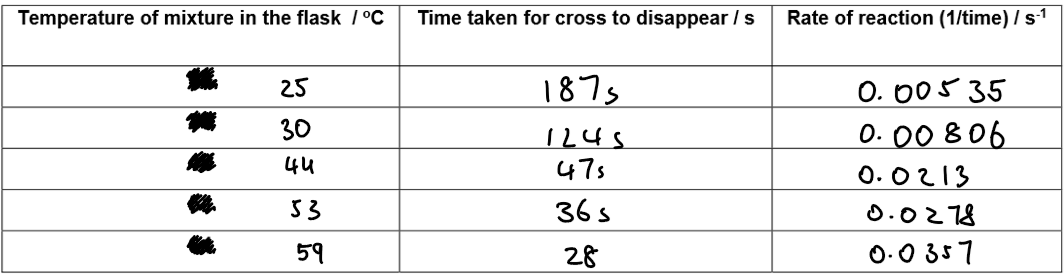
Analysis Of Results: Effect Of Temperature
1. Variables
Independent variable: Temperature of the reaction mixture.
Dependent variable: Time taken for the cross to disappear / rate of reaction.
2. Graph: Time vs Temperature
Y-axis: Time taken for cross to disappear (s)
X-axis: Temperature (°C)
Plot all points for different temperatures on same axes.
Time decreases as temperature increases → faster reaction at higher temperatures.
3. Graph: Rate vs Temperature
Y-axis: Rate of reaction (1 / time)
X-axis: Temperature (°C)
Plot points for all temperatures.
Rate increases as temperature rises.
Graph typically curves upward, showing faster increase at higher temperatures.
4. Effect Of Temperature On Rate
Rate increases as temperature rises.
Higher temperature → particles have more kinetic energy.
More collisions per second occur.
More particles exceed activation energy.
More successful collisions → faster reaction.
5. Estimating Temperature To Double Rate
Use rate graph to find temperature at which rate is double that at a lower temperature.
Read corresponding temperature from graph.
This shows approximate temperature increase needed to double rate.
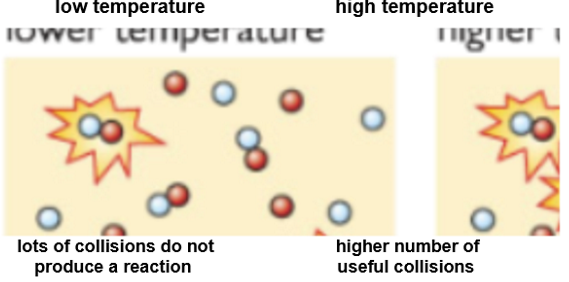
Effect Of Temperature
At higher temperatures:
Particles move faster and have more kinetic energy.
More particles have sufficient energy to overcome the activation energy (minimum energy needed for the particles to react).
There are more successful collisions and the rate of reaction increases.
The rate of a reaction is not directly proportional to the temperature of reactants in solution.
As a rough approximation, the rate doubles for every 10°C rise in temperature.
A graph of rate vs temperature is a curve through the origin that rises upwards.
Effect Of A Catalyst
A catalyst is a substance that increases the rate of a chemical reaction without itself getting used up.
The catalyst is regenerated at the end of the reaction.
Only small amounts of a catalyst are needed to convert large amounts of reactants to products.
A catalyst changes the rate, but not the extent of a reaction.
A solid catalyst works by providing a surface where reacting particles stick and collide, increasing proximity and collision frequency.
Types of Catalysts
Heterogeneous catalysts: Catalyst is in a different physical state from reactants.
Example: Haber process – H₂ and N₂ gases react to form ammonia using Fe (solid) as the catalyst.
Homogeneous catalysts: Catalyst is in the same physical state as reactants.
Example: Enzymes in solution in biological reactions.
Catalysts Are Specific:
Different reactions require specific catalysts.
Examples:
MnO₂ catalyses decomposition of H₂O₂ → O₂ + H₂O.
Iron catalyses N₂ + H₂ → NH₃ (Haber process).
Nickel catalyses hydrogenation of vegetable oils → margarine.
Platinum/Rhodium in catalytic converters remove harmful gases (CO, NOₓ → CO₂, N₂).
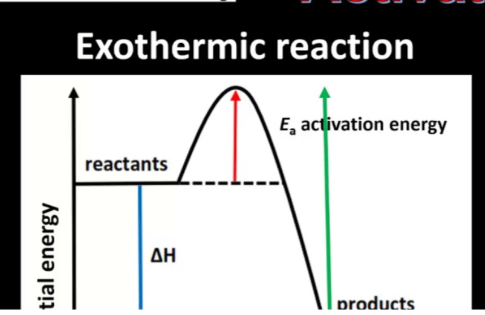
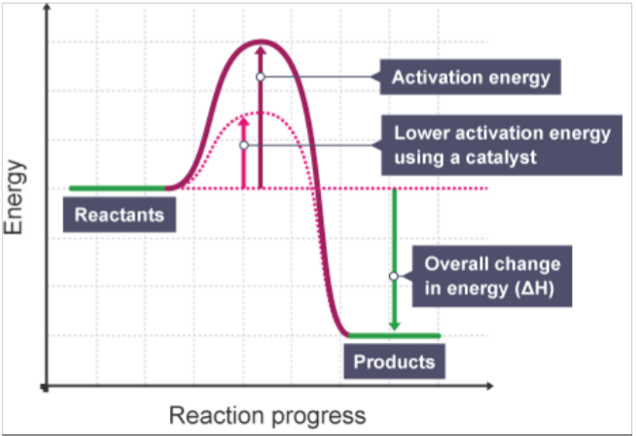
How Catalysts Work:
Successful collisions need a minimum energy called activation energy (Ea).
Catalysts provide an alternate route with lower Ea.
More particles have energy ≥ Ea → more successful collisions → faster reaction.
Reaction Profile:
Reaction without a catalyst has higher Ea.
Reaction with a catalyst has lower Ea, so the reaction occurs faster.
Hydrogen peroxide decomposes slowly at room temperature according to the following equation.
2H2O2 (l) → 2H2 O(l) + O2 (g)
This reaction can be speeded up by a catalyst.
There are many catalysts that are available for this reaction:
potato
iron (III) oxide
liver
manganese(IV) oxide
Demo: Effect Of A Catalyst – Elephant’s Toothpaste
Safety:
Wear safety glasses and lab coats.
Demonstrator should wear splash-proof goggles.
Method:
Add 25 cm³ H₂O₂ into four 250 cm³ measuring cylinders preloaded with washing-up liquid and equal amounts of catalysts.
Record maximum height of foam produced.
Results Table:
Catalyst | Max height of foam / cm³ |
|---|---|
Potato | 40 |
Iron(III) oxide | 28 |
Liver | 200 |
Manganese(IV) oxide | >300 |
Analysis Questions:
1. How to confirm oxygen is produced:
Collect gas in a test tube or gas syringe.
Test with a glowing splint; it will relight if oxygen is present.
2. Order of effectiveness of catalysts:
Compare foam heights (taller foam = faster reaction).
Order of relative rates judged by maximum foam height.
3. Effect of boiling potato/liver (enzymes):
Boiling denatures enzymes, destroying catalytic activity.
Foam height would be lower → slower reaction.
Effect Of Changing Factors On Rate Of Reaction
1. Increasing Concentration (e.g., HCl)
At higher concentrations of HCl, there are more H⁺ ions per unit volume.
Particles are closer together.
Hence, there are more frequent successful collisions with magnesium or other reactants.
2. Increasing Pressure (for gases, e.g., H₂ and Cl₂)
Increasing pressure pushes H₂ and Cl₂ gas particles closer together.
There are more reactant particles per unit volume.
Hence, there are more frequent successful collisions.
3. Increasing Surface Area (e.g., CaCO₃)
Collisions occur at the surface of the CaCO₃ solid.
Smaller marble chips have a larger surface area.
There are more frequent successful collisions with HCl.
4. Increasing Temperature (e.g., Na₂S₂O₃ and HCl)
Reactants gain more kinetic energy and move faster.
More particles have energy ≥ activation energy.
Hence, there are more frequent successful collisions, increasing rate.
5. Using a Catalyst (e.g., MnO₂ for H₂O₂ decomposition)
Provides an alternate route with lower activation energy.
More reactant particles collide with energy ≥ lowered activation energy.
Hence, there are more frequent successful collisions and faster reaction.
A summary of graphs obtained when investigating rates of reaction
You need to be familiar with the different graphs that occur in the rates topic.
1. A graph showing time vs the concentration of a reagent
Magnesium reacts with hydrochloric acid:
magnesium + hydrochloric acid → magnesium chloride + hydrogen
Mg(s) + 2HCl(aq) → MgCl2(aq) + H2(g)
Sketch a graph of the time taken for the magnesium to react versus the concentration of the hydrochloric acid.
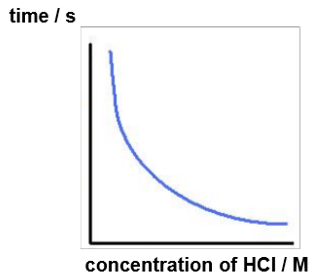
The rate of reaction is proportional to 1/time.
As rate is directly proportional to the reactant concentration i.e the concentration of hydrochloric acid, a graph of rate vs concentration of hydrochloric acid results in a straight line through the origin.
Describe another method you could use to show that the rate of reaction is directly proportional to the concentration of the hydrochloric acid.
Use a certain concentration and measure the time taken for the volume of gas to plateau. If you double the concentration, the time taken should half.
A graph showing volume of gas produced with time
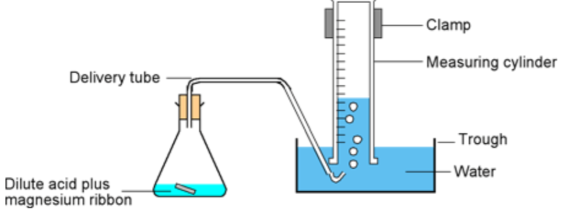
Excess calcium carbonate reacts with hydrochloric acid:
calcium carbonate + hydrochloric acid → calcium chloride + water + carbon dioxide
CaCO3(s) + 2HCl(aq) → CaCl2(aq) + H2O(l) + CO2(g)
excess
Sketch a graph of volume of carbon dioxide produced versus time.
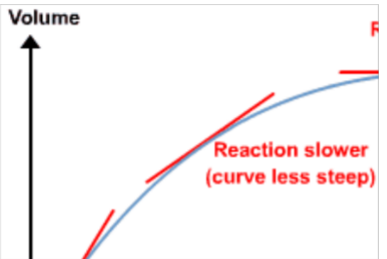
What happens to the rate as the reaction proceeds? Explain your answer
Rate decreases with time
Less particles of CaCo3 with HCL as the reaction proceeds
Less frequent successful collisions between them
Why does the graph plateau?
The HCL is completely used up
No more carbon dioxide is produced and the reaction stops