Forecasting
What’s Forecasted in the Supply Chain?
Demand, sales, or requirements,
Purchase prices.
Replenishment and delivery times.
Nature of Forecasting
Spatial vs. Temporal Demand.
Lumpy vs. Regular Demand.
Dependent (Derived) vs. Independent Demand.
Forecasting Horizons
Long-Term
Greater than 3 years.
Used for Strategic Planning - Production capacity, Inventory levels, Product Range, etc.
Midrange
One to three years.
Used for budgeting and sales planning.
Short-Term
In terms of months.
Used for Tactical planning - Production Schedules, Logistics Plans, Material Planning etc.
Forecasting Steps
Identify what to forecast
Level of detail, units, of analysis & time horizon required.
Identify what data is available
Identify needed data & whether it’s available.
Select and test a forecasting model
Cost, ease of use & accuracy.
Generate the forecast
Monitor forecast accuracy over time
Identifying Demand Patterns
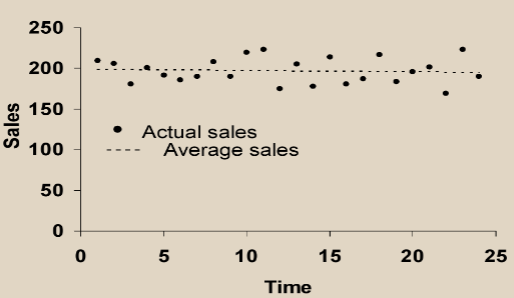
Typical Time Series Patters: Random
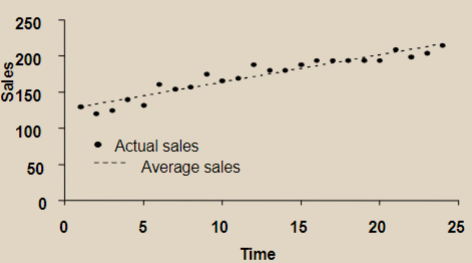
 Typical Time Series Patters: Random with Trend
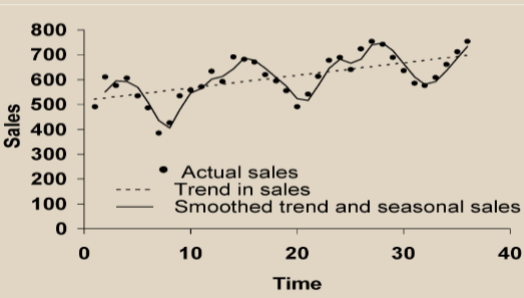
 Typical Time Series Patterns: Random with Trend and Seasonal
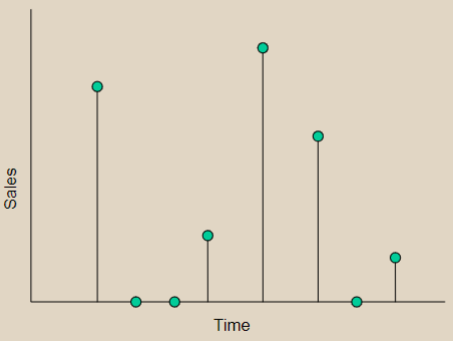
 Typical Time Series Patterns: Lumpy
 Forecasting in High Certain Environments
Managing Highly Uncertain Demand
Delay forecasting as long as possible.
Seek information directly from customers.
Prioritize supply by product’s degree of uncertainty (supply to the more certain products first).
Apply the principle of postponement to the most uncertain products (delay committing to a final product form until an order is received).
Create flexible supply to changing demand (alter capacity and output rates through subcontracting, computer technology, multi-purpose processes, etc.)
Delay supply response until demand becomes clear.
Be able to respond quickly to uncertain demand levels.
Managing Highly Uncertain Demand: Collaborative Forecasting
Demand is lumpy or highly uncertain.
Involves multiple participants each with a unique perspective—“two heads are better than one.”
Goal is to reduce forecast error.
The forecasting process is inherently unstable.
Determine the Best Forecasting Method
Qualitative Methods [Used when situation is vague & little data exist]
Market Research
Uses customer surveys and interviews to determine customer preferences.
Panel Consensus
Executives meet and develop a forecast together.
Delphi Method
Develop a consensus forecast among a group of experts.
Quantitative Methods [Used when situation is ‘stable’ & historical data exist]
Regression Analysis
Time-Series Analysis
A time series is a sequence of observations of a process over points in time, e.g., monthly sales, annual enrollment, weekly production, etc.
It is used when historical data contains patterns that can be exploited.
Average demand for the period, trend, seasonal elements, cyclical elements, random variation.
Time Series Forecasting Methods
Demand pattern has neither trend, nor seasonal or cyclical effects
Simple (or weighted) moving average.
Exponential smoothing.
Demand pattern has only trend
Exponential Smoothing with Trend.
Linear Regression (Forecast given the parameters).
Demand pattern has seasonal effects
Exponential smoothing with trend and seasonality.
Decomposition of a time-series (Forecast given the parameters).
Moving Average
Used when data has no trend, cycle or seasonal characteristics.
Used often for smoothing.
Provides overall impression of data over time.
Notation
Ft=Forecast in period t
At=Actual data in period t
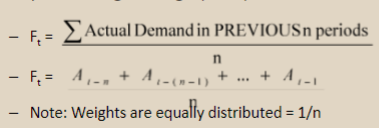
Simple Moving Average
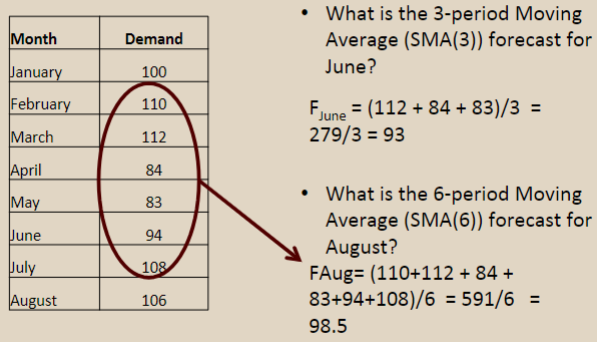
Moving Average (MA) Example
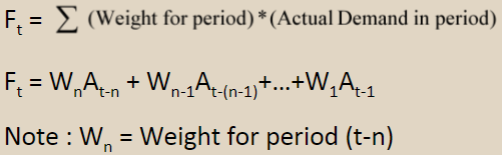
 Weighted Moving Average (WMA)
Similar to Simple MA except different weights to actual demand.
Weights based on intuition, expert judgement, experience.
Values between 0 & 1 that sum to 1.0
 Exponential Smoothing
Form of WMA
Only 3 pieces of information needed for forecasts unlike WMA.
Previous period’s forecast: Ft-1
Previous period’s actual demand: At-1
Smoothing constant or response rate: α
α is between 0.0 and 1.0
Higher the value, more the response
Forecast
- Ft=Ft-1+α (At-1-Ft-1)
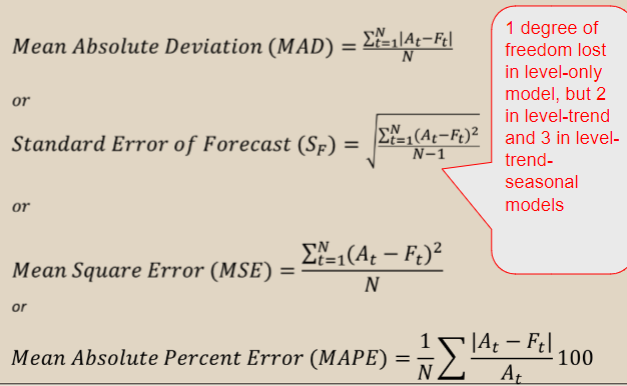
Forecasting Error Metrics
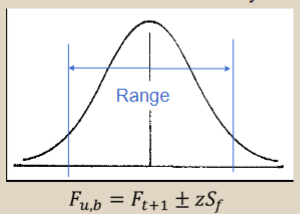
 Range of the Forecast
If forecast errors are normally distributed and the forecast is at the mean of the distribution, i.e.,

A forecast confidence band can be computed. The error distribution for the level-only model results is:
Selecting a Forecast Model
Need to look at cost and accuracy.
Cost of Data: Software, Personnel, Amount of Data, etc..
Accuracy: MAD, MAPE, etc.
Trade-off between cost and accuracy - Why?
Comparing models based on accuracy
Which is the better model?
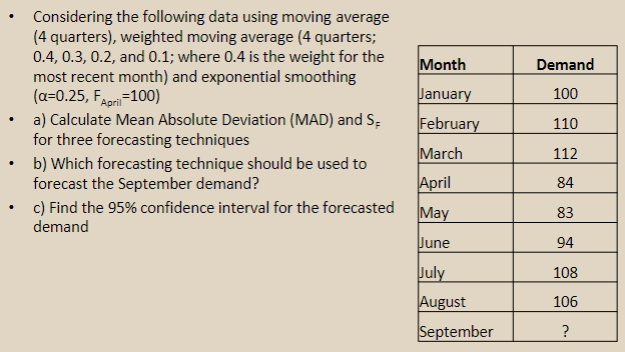
Forecasting Exercise
 Forecasting Summary
Forecasts are uncertain, imprecise, and unavoidable.
Long-term forecasts are less accurate than short-term forecasts (forecast horizon is important).
Aggregate forecasts are more accurate than disaggregate forecasts.
Forecasts are made for many purposes, using many methods.
Selecting what is forecast, what model to use must be done carefully.