Lecture 4: DNA Quantification, Protein Quantification, and Enzyme Assays
Laws of Absorption and Spectral Properties of Light
Energy Levels and Quantization:
Molecules possess individual sets of energy levels derived from their chemical bonds and atomic masses.
These energy levels result in unique spectral properties, which are utilized to identify specific compounds.
Light interacts with the electronic and vibrational modes of molecules, leading to quantization.
Absorption occurs only when light energy exactly corresponds to the energy required for a transition from one state to another.
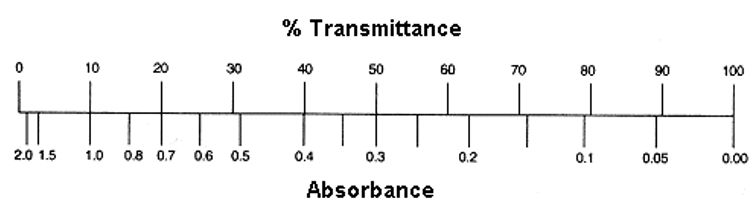
Laws of Transmittance ():
Transmittance is the measure of light that passes through a sample.
When light of a specific wavelength () passes through a path length () of a solution at a set concentration, a defined proportion of light is absorbed.
Incident light energy is denoted as .
Transmitted light energy (after passing through the solution) is denoted as .
The fraction of light transmitted is expressed as: .
Laws of Absorbance ():
Absorbance is the amount of light absorbed by the sample.
For homogeneous samples, each successive layer absorbs the same fraction of incident light as the preceding layer.
Transmittance decreases exponentially as the concentration of the colored compound or the light path length increases.
Beer’s Law (The Beer-Lambert Law):
Light absorption is directly proportional to the number of molecules present in the light path.
The mathematical description of the fractional loss of light involves exponential decay of transmitted light relative to path length and concentration.
Primary Equation: (also expressed as ).
Relationship to Transmittance: .
Relationship of Transmittance to Absorbance: .
Variables Defined:
: Absorbance or Optical Density (e.g., ).
: Molar extinction coefficient (measured in or ). This represents the absorbance of a solution with a path length of .
: Path length (usually due to cuvette size).
: Concentration (measured in ).
: Initial light intensity.
: Final light intensity.
Calculation Examples:
If Transmittance is , .
If Absorbance is , (or ).
If , , and : or .
Relevant Absorbance Wavelengths and Standards
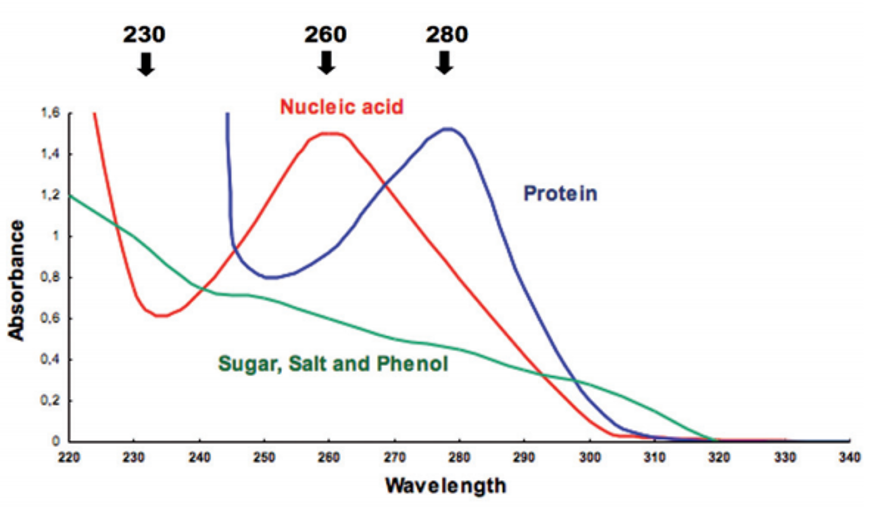
Critical Wavelengths ():
: Detection of organic contaminants.
: Determination of DNA and RNA concentration.
: Determination of protein concentration.
: CDNB Assay; monitoring NADH in Pyruvate Kinase or Lactate Dehydrogenase assays.
and : Chlorophyll absorption (high molar absorptivity: ).
: Bradford Assay for protein concentration (color change to blue).
: Bacterial growth monitoring in LB media.
: Lowry Assay for protein concentration.
DNA and RNA Quantification
DNA Quantification Principles:
DNA absorbance maximum occurs at .
Standard Values:
corresponds to dsDNA.
corresponds to ssDNA (ssDNA absorbs more light than dsDNA). 2 strands = 2 × 35 mg/mL = 70 mg/mL for entire structure effect
Measurement Methods:
Spectrophotometer: Requires or dilution.
Nanodrop: Requires only sample.
The process is non-destructive to the sample.
DNA Purity Assessment:
Purity is determined by the ratio of absorbance at to ().
Adequately pure samples have a ratio > 1.5.
Equation for calculation provided in slide: .
RNA Quantification Principles:
RNA quantification is nearly identical to DNA quantification using spectrophotometry or Nanodrop.
Standard Value: corresponds to .
RNA Purity Assessment:
ratio is used.
Typically must be greater than .
Alternative Techniques for Cellular RNA:
Gel electrophoresis.
Northern blotting.
RT-qPCR.
Protein Quantification Techniques
Overview of Methods:
Absorbance at .
Amino acid analysis.
Chromogenic/colorimetric assays (Bradford, Biuret, Lowry, BCA).
Absorbance at 280 nm:
Max absorbance occurs due to ringed amino acids (Tryptophan and Tyrosine).
Extinction Coefficient Calculation ():
Depends on amino acid sequence.
Formula:
Limitations:
High variability based on absence/presence of Trp or Tyr.
Sample must be pure (nucleic acids absorb strongly at ).
Cannot be used for lysates or complex mixtures.
Requires quartz or UV-compatible plastic cuvettes.
Low detection range (< 0.1\,mg/ml).
DNA Contamination in protein Correction Formula:
.
Amino Acid Analysis:
Most reliable method for pure protein concentration.
Process: Acid hydrolysis, separation of amino acids, and HPLC quantification.
Drawbacks: Purity essential, requires special facilities, day turnaround, and costs approximately per sample.
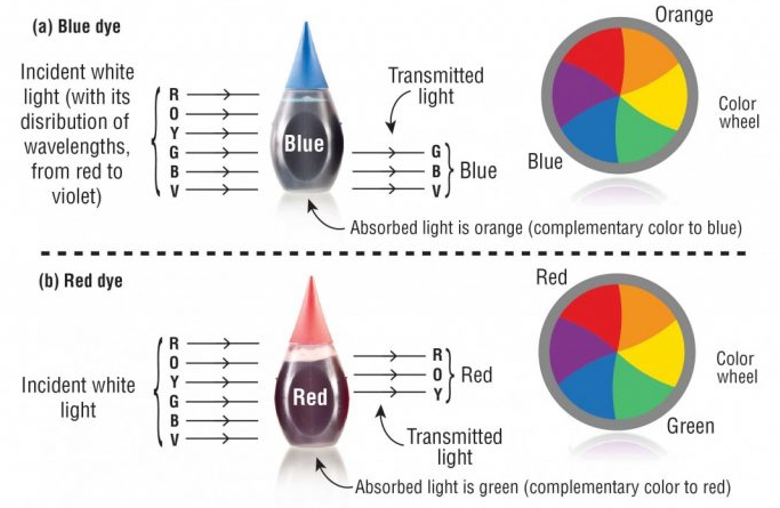
Colorimetric Methods:
Measuring color intensity: more protein equals more intense blue color.
Measured in the range.
These are not the wavelengths for “blue”, but the wavelength of colors that are absorbed by blue
Specific Colorimetric Assays for Protein
Bradford Assay:
Uses Coomassie Brilliant Blue dye.
Color shift: Red ( ) to Blue () upon protein binding.
Mechanism: Dye forms noncovalent (van der Waals) complexes with proteins relating to positive charges, hydrophobic interactions, and specific amino acids (Phe, Tyr, Trp, Lys, Arg, His, Pro) and N-/C-termini.
Advantages: Fast, sensitive, compatible with most buffers and chaotropic reagents (6 M guanidine-HCl, 8 M urea).
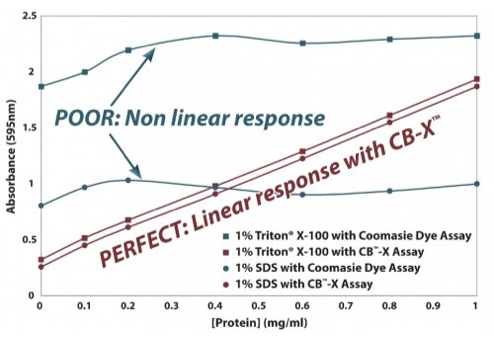
Disadvantages: Nonlinear response (requires standard curve), sequence-dependent variability, incompatible with detergents, stains cuvettes.
Detection Range: to .
CB-X Assay (Bradford)
Acetone precipitation, resolubilization
Compatible with all reagents
Eliminates inhibitory effect of detergents
Copper Based Assays
Biuret Assay:
Alkaline conditions: binds peptide nitrogen.
Absorbance wavelength: .
Pros/Cons: Low amino acid sequence interference; not very sensitive; sensitive to Tris and ammonia buffers.
Lowry Assay:
Two-step Process:
Copper binds peptide bonds in basic conditions ().
reacts with Folin reagent (phosphomolybdic-phosphotungstic reagent), which reduces to blue.
Absorbance wavelength: .
Advantages: Inexpensive, highly sensitive ( more than , more than Biuret).
Disadvantages: Time-consuming, unstable reagents, nonlinear response, sensitive to detergents, lipids, and pH.
Detection Range: to .
DC Protein Assay:
A modified "Detergent Compatible" Lowry assay.
Upper detection limit: .
BCA Assay:
Similar to Lowry () but uses Bicinchoninic acid (BCA) instead of Folin reagent.
Mechanism: Two molecules of BCA chelate to one copper ion.
Absorbance: Purple color at .
Advantages: Stable reagents, detergent compatible, lowest protein-to-protein variation (), highly sensitive ( detection).
Disadvantages: Expensive, sensitive to carbohydrates, lipids, and glycerol.
The Standard Curve and Protein Unknowns
Necessity of Standard Curves:
Protein absorbance does not correlate linearly with concentration across all ranges.
Relationship is established using Bovine Serum Albumin (BSA) or Bovine Gamma Globulin (BGG) as a standard.
Plotting data yields a curve equation
The curve follows the equation: .
Example regression: with .
Important: Users must not extrapolate beyond the measured range of the curve.
Enzyme Fundamentals and Classification
Key Characteristics of Enzymes:
Lower the activation energy of a reaction.
Increase rate of reaction without shifting equilibrium position.
Highly specific for substrates and products.
Activity can be regulated by substrates or other molecules.
Most are proteins, though some RNA enzymes (ribozymes) exist.
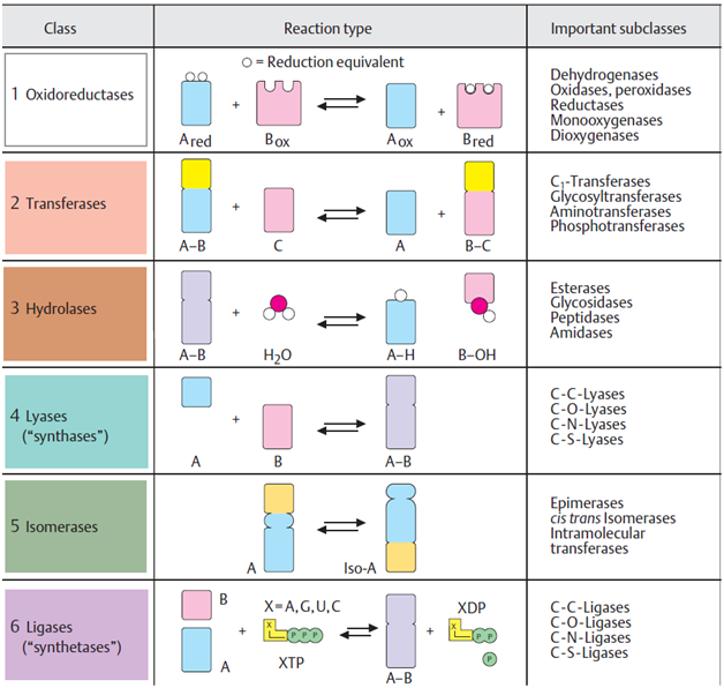
Enzyme Classification System:
1. Oxidoreductases: Catalyze oxidation-reduction reactions (e.g., Dehydrogenases, Oxidases, Reductases).
2. Transferases: Transfer functional groups (e.g., Kinases, Aminotransferases, Methyltransferases).
3. Hydrolases: Cleave bonds using water (e.g., Esterases, Peptidases, Lipases).
4. Lyases ("Synthases"): Cleave/add groups to double bonds (e.g., C-C Lyases).
5. Isomerases: Rearrangement of molecules (e.g., Epimerases, cis-trans Isomerases).
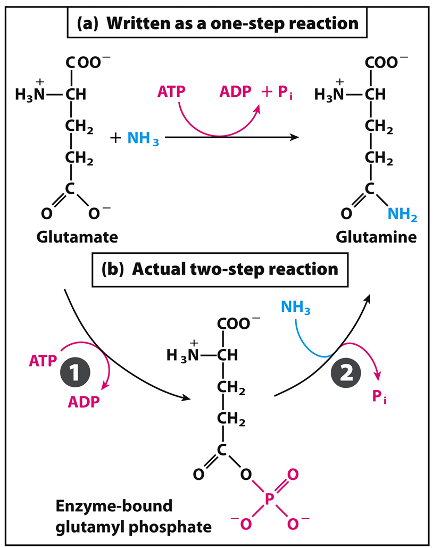
6. Ligases ("Synthetases"): Join two molecules using ATP (e.g., C-N Ligases).
Enzyme Mechanism
Chemical Equilibrium:
The point where net change between forward and reverse reactions is zero.
Enzymes accelerate reaching equilibrium but do not change the ratio of products to reactants.
In the absence of enzyme, a reaction may take hours or days to reach the equilibrium position, whereas on addition of the enzyme the equilibrium position may be reached in less than 1 second
Activation Energy and Transition State (TS):
Transition State: Unstable chemical form with the highest free energy, halfway between substrate and product.
Activation Energy: The barrier that must be overcome for a reaction to proceed.
Enzymes stabilize the TS, thereby lowering activation energy.
Free Energy () and Coupling:
Measure of energy difference between substrates and products.
Negative: Energetically favorable, spontaneous.
Positive: Unfavorable, requires energy input (usually ATP).
ATP Hydrolysis: (). Favorable due to resonance, relieved repulsion, and increased entropy. Used to drive less energetically favorable reactions
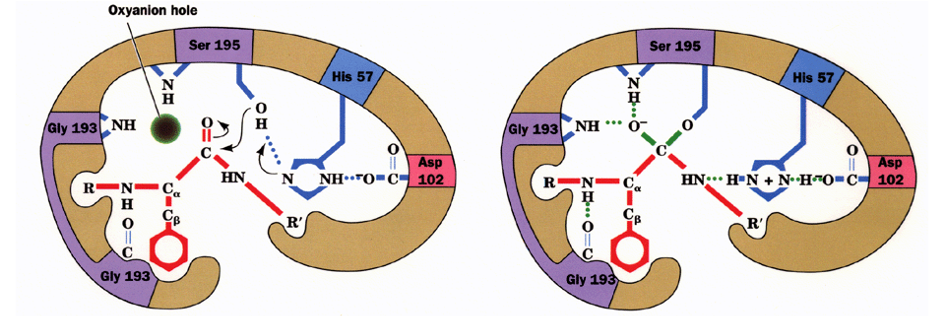
Enzyme Active Site:
Cleft or crevice on the surface, formed by amino acids that may be distant in the linear sequence.
Binding involves weak interactions: van der Waals, H-bonds, ionic bonds.
Usually a relatively small part of the whole enzyme molecule and is a three-dimensional entity formed by amino acids that can lie far apart in the linear polypeptide chain
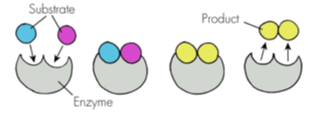
Enzyme-Substrate Models:
Lock and Key (Emil Fischer, 1894): Substrate and active site are perfectly complementary.
Induced Fit (Daniel E. Koshland, 1958): Binding induces a conformational change in the enzyme to simulate the transition state.
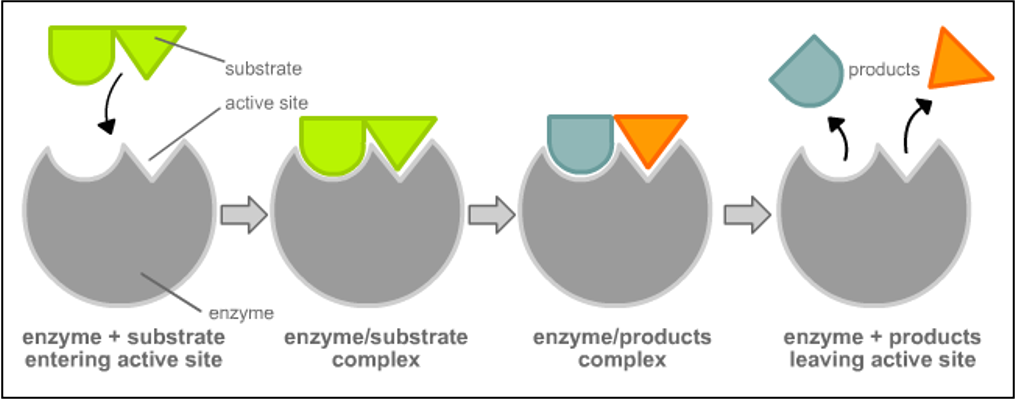
Lock and Key
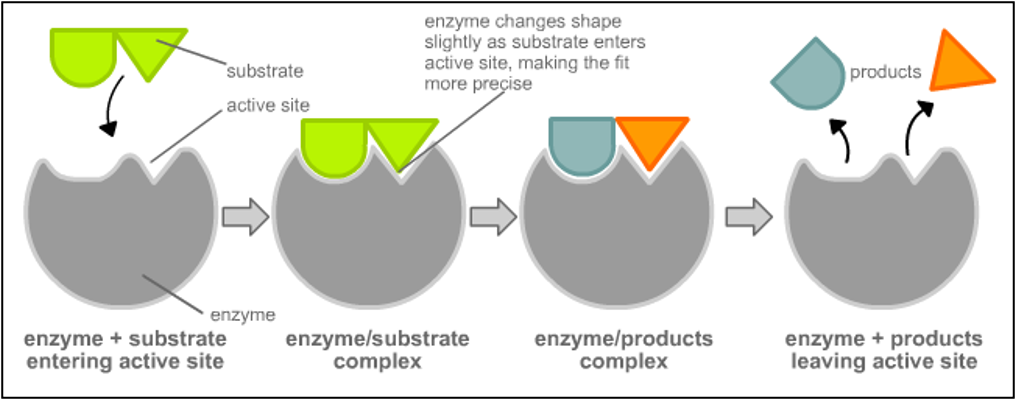
Induced Fit
Case Studies in Enzyme Structure and Function
Carbonic Anhydrase:
Reaction: .
Rate: reactions/second (diffusion-limited).
Mechanism: Includes a Zinc cofactor stabilized by His94, His96, and His119.
Inhibitors: NSAIDs (Aspirin, Ibuprofen) and COX-2 inhibitors may block CA, serving as potential treatments for glaucoma or cancer.
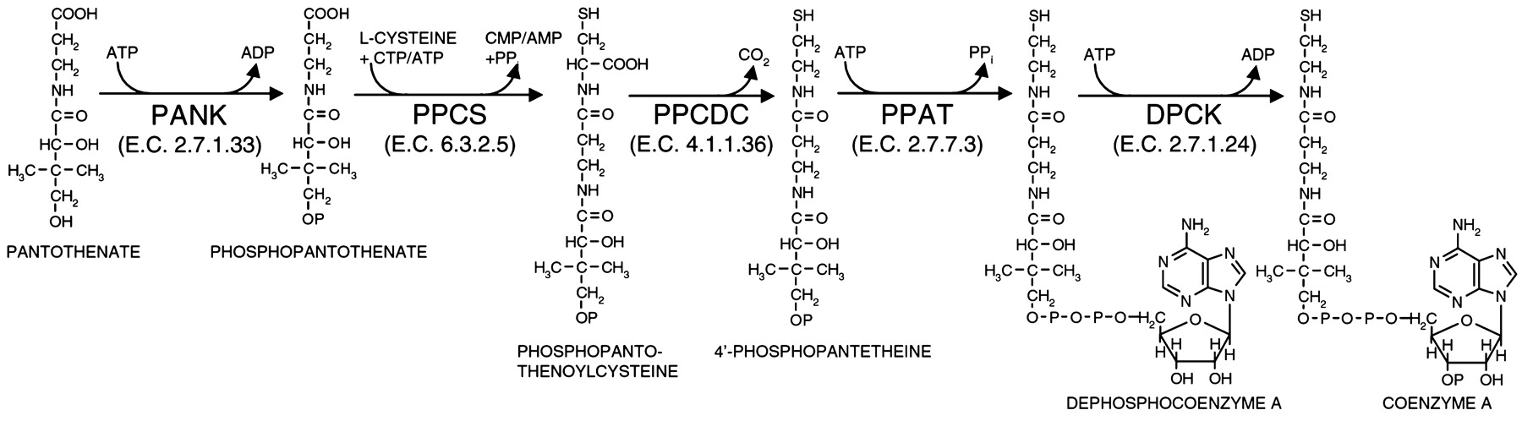
Coenzyme A Biosynthesis Enzymes:
PANK (2.7.1.33): Pantothenate Kinase, used in the conversion of Pantothenate to Phosphopantothenate.
PPCS (6.3.2.5): Phosphopantothenoylcysteine Synthetase.
PPCDC (4.1.1.36): Phosphopantothenoylcysteine Decarboxylase.
PPAT (2.7.7.3): Phosphopantetheine Adenylyltransferase (stabilizes PPi, H-bonding to ATP).
DPCK (2.7.1.24): Dephosphocoenzyme A Kinase. Alignment of 25 bacterial DPCKs shows 19 identically conserved residues including Walker A and Walker B motifs.
Amino acids that are conserved between homologs indicate;
their importance in the protein’s structure or function
Mutations can’t occur at this location in the protein’s sequencebecause such changes are likely to disrupt crucial interactions necessary for catalytic activity and structural integrity.
Enzyme Kinetics and Inhibition
Saturation: The rate asymptotically approaches a limiting value, called Vmax, becoming zero-order with respect to substrate concentration (not varying with concentration)
Reaction Velocity:
First Order: Rate varies with substrate concentration.
Zero Order: Rate is maximal () and independent of concentration (saturation).
Enzyme Rate
Rate: inherent velocity of the enzyme affected by concentrations of enzyme/substrates, temperature, pH, coenzymes
Decrease in reaction rate due to approach in equilibrium, substrate depletion, product inhibition, loss of function, inactivation of enzyme
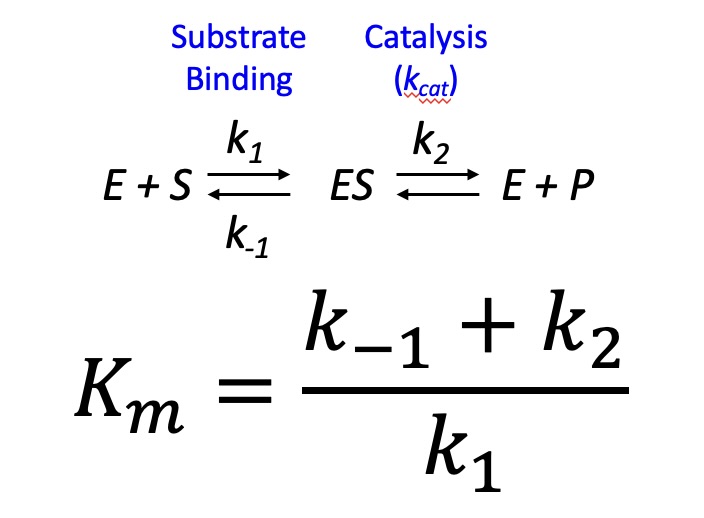
Michaelis-Menten Model:
Equation: Equal to the sum of the rates of breakdown of ES complex over its rate of formation
A measure of the stability of the ES complex (or the affinity of an enzyme for its substrate)
(Michaelis Constant): Substrate concentration at which velocity is half of .
Low strong binding/high affinity; High weak binding.
Catalytic efficiency is better measure of enzyme activity and is measured as .
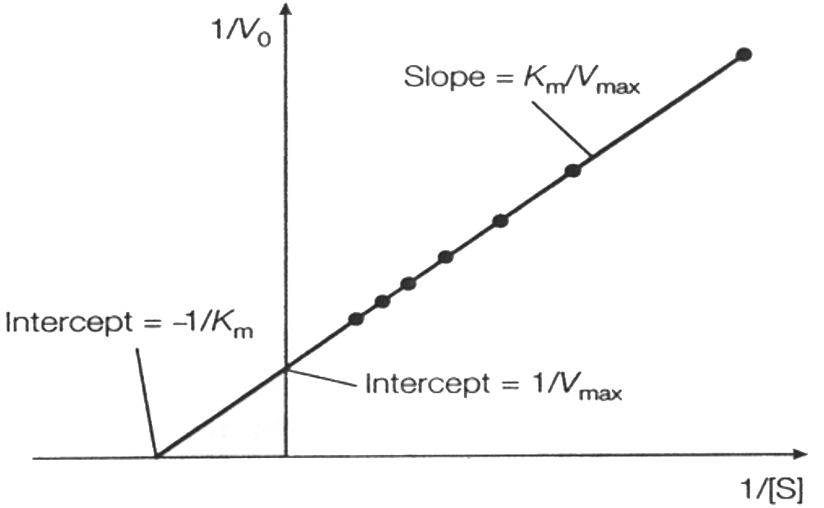
Lineweaver-Burk Plot (Double Reciprocal):
Equation: .
Slope: .
Y-intercept: .
X-intercept: .
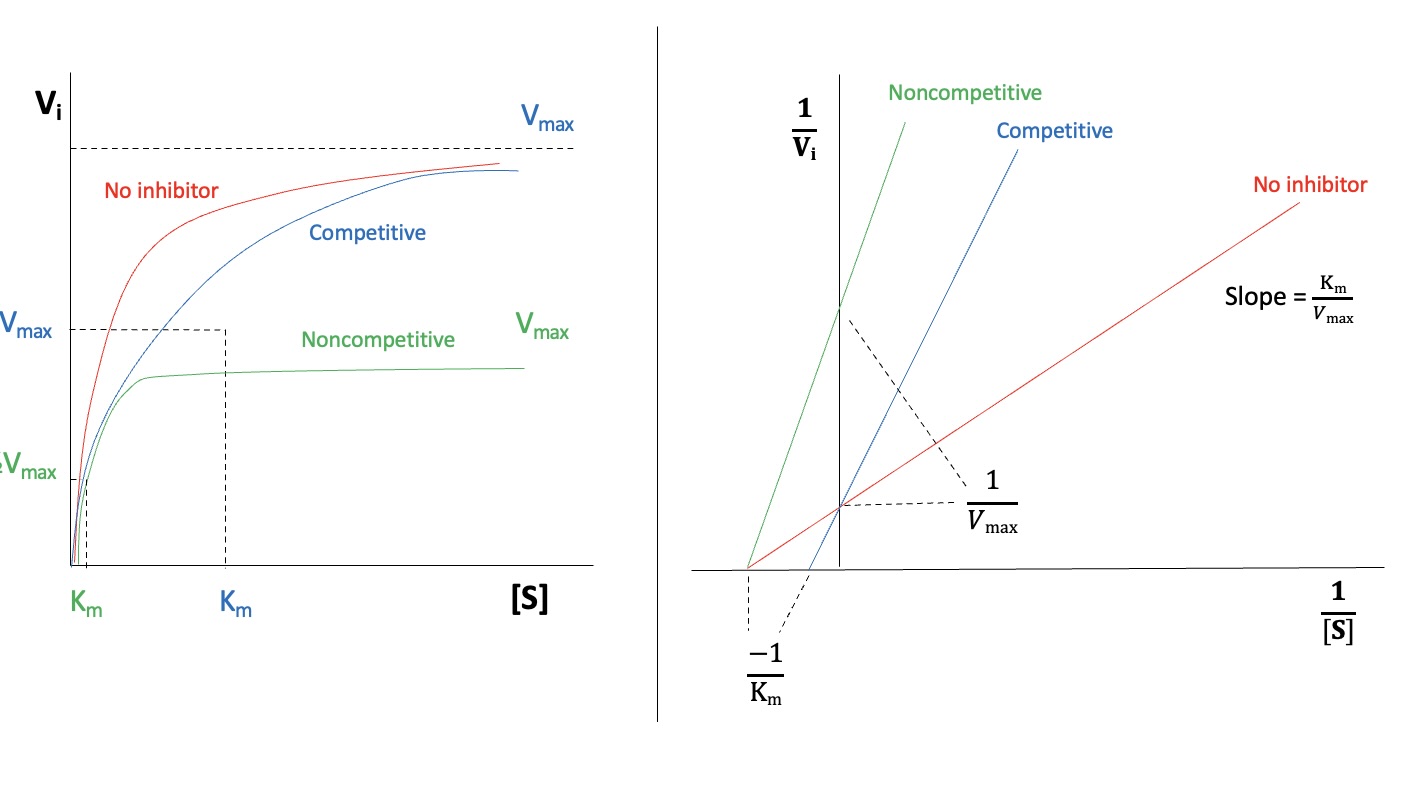
Enzyme Inhibition Types:
Competitive: Inhibitor binds to the active site; prevents substrate binding. stays same, increases. On graph lines intersect at same y-intercept which =
Noncompetitive (Allosteric): Inhibitor binds elsewhere, altering active site structure. Substrate may still bind, but reaction is hindered. decreases, stays same. On graph all lines intersect at different x-intercepts which =
Enzyme Assay Applications
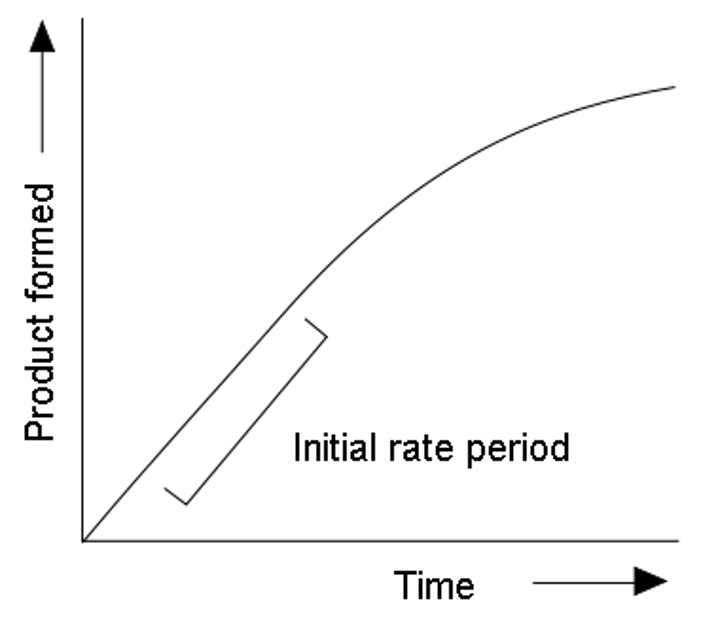
Enzyme assays involve measuring the conversion of substrate to product to determine rates of catalyzed reactions
High substrate concentrations are used to measure initial rate
NADH/NADPH, which absorb light at 340 nm, are often used to monitor the progress of an enzyme reaction
Purpose: Assess activity of mutants, determine kinetics, study drugs, diagnose deficiencies.
CDNB Assay:
Measures Glutathione-S-Transferase (GST) activity.
GST removes toxins from cells.
The CDNB enzyme assay calculates GST’s reaction velocity/activity
Track GST during protein purification
Coupled Continuous Assay (PK-LDH):
Used for reactions that hydrolyze ATP to produce ADP.
Pyruvate Kinase-Lactate Dehydrogenase Assay: Glycerol Kinase is assayed continuously by measuring the decrease in absorbance at 340 nm as NADH is converted to NAD+
Glycerol + ATP Glycerophosphate + ADP
ADP + Phosphoenolpyruvate ATP + Pyruvate
Pyruvate + NADH Lactate + NAD+
Detection: Measured by a decrease in absorbance at (NADH consumption).
Kinase Assay:
Add "Hot" ATP (ATP radiolabeled with radioactive phosphate ).
Target protein is phosphorylated; sample is run on gel and analyzed via autoradiography or scintillation counter.
Analyze sample (western, sequencing, scintillator)
Can be used to study signaling pathways or test inhibitors
Modern assays avoid radioactive ATP and use compounds that emit light