Week 8: Mediation
Introduction
Mediation analysis is a type of regression analysis used to evaluate the mechanisms that explain the relationship between two variables.
It helps determine why two variables are related.
Overview of Mediation
Mediation analysis tests if the relationship between a predictor (independent variable) and an outcome (dependent variable) is explained by a third, intervening variable (the mediator).
It explores the how or why behind a relationship, not just the if.
A mediating variable explains how a predictor influences an outcome.
It looks at a chain or sequence of relationships where the predictor relates to the mediator, which in turn relates to the outcome.
Simple and multiple regression models measure the strength and direction of a relationship but don't explain why.
Example: The amount of time spent working may predict exam scores because work reduces study time, which impacts exam scores.
Indirect Relationships in Mediation
The relationship between two variables may be indirect, explained by a third intervening variable.
Example: Time working predicts exam scores because work influences study time; reduced study time affects exam scores.
This creates a chain: predictor (work time) -> mediator (study time) -> outcome (exam score).
Components of a Mediation Model
Mediation analyses evaluate both direct and indirect relationships between a predictor and an outcome.
A full mediation model includes direct and indirect relationships.
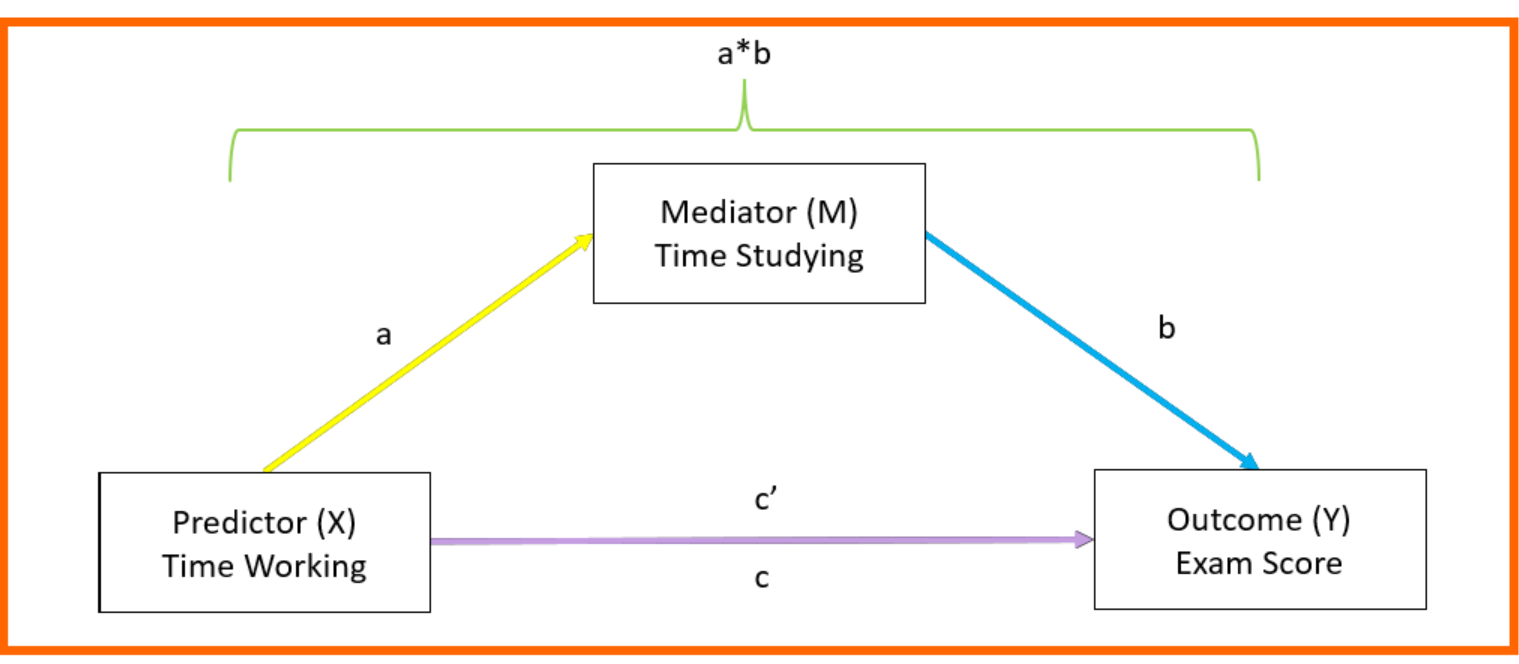
Path a (predictor to mediator): Relationship between predictor and mediator, measured by regressing the mediator on the predictor.
Path b (mediator to outcome): Relationship between mediator and outcome, measured by regressing the outcome on the mediator.
Path a*b (indirect relationship): Indirect relationship between predictor and outcome via the mediator, calculated by multiplying the unstandardized regression coefficients of Path a and Path b. Significance indicates a significant indirect relationship partially explained by the mediator.
Path c' (direct relationship): Direct relationship between predictor and outcome independent of the mediator, measured by regressing the outcome on the predictor, controlling for the mediator. Significance indicates a direct relationship not explained by the mediator (partial mediation). If non-significant but the indirect effect is significant, it indicates full mediation.
Path c (total relationship): Total relationship between predictor and outcome, incorporating both direct and indirect relationships, calculated by adding the regression coefficients for the indirect effect (a*b) and the direct effect (c'). It indicates the total explanatory power of the model.
Jamovi calculates all these components at once.
When Would We Use A Mediation Analysis?
Mediation is used to answer questions like:
Is the relationship between a predictor and outcome mediated by a third variable?
Is there an indirect relationship between a predictor and outcome, and is this relationship partially (or fully) explained by a third variable?
Does variable M explain or account for the relationship between predictor and outcome?
Suitable data types:
Outcome variable must be continuous.
Predictor and mediator can be continuous or categorical.
Categorical predictors must be binary or compared two levels at a time if they have three or more levels.
Assumptions of Mediation
Mediation, as a type of multiple regression, shares most of its assumptions:
Residuals are normally distributed (check Q-Q plot).
Residuals are linear and homoscedastic (check scatterplot of residuals plotted about fitted values).
Residuals are independent (check Durbin-Watson test).
Predictor and mediator are not collinear (check correlations, VIF, and tolerance).
Jamovi requires running a multiple regression to directly test these (Analyses -> Regression -> Linear Regression, with outcome as dependent and predictor/mediator as covariates).
Additional assumption: Mediator should be significantly correlated with both predictor and outcome (Paths a and b must be significant).
Suppression effects in mediation occur when the inclusion of a mediator variable enhances the relationship between the predictor and the outcome variable. This means that when the mediator isn’t included in the model, it looks like the predictor and outcome aren’t related, or aren’t strongly related. However, when we add the mediator in, we find a significant indirect relationship.
The Issue of Causality in Mediation
Mediation models imply a causal chain, but the analysis alone cannot demonstrate causality unless the research design allows it.
That is, mediation assumes that the predictor causes a change in the mediator, which in turn causes a change in the outcome.
Demonstrating causality requires:
Temporal precedence: The independent variable (X) must precede the mediator (M) in time, and the mediator (M) must precede the dependent variable (Y) in time.
Experimental research design: Use experimental designs to test causality.
Mediation analysis can be used in non-experimental studies, but avoid making causal claims.
Use the following language:
Causal Language: Indirect effect, direct effect, total effect; M mediated the relationship between X and Y; X influenced M, which in turn influenced Y.
Non-Causal Language: Indirect relationship, direct relationship, total relationship; M partially (or fully) explains the relationship between X and Y; X was related to (or predicted) M, which was in turn related to (or predicted) Y.
Interpreting the output and reporting the results
Jamovi provides a coefficients table and a path diagram.
Coefficients Table
The coefficients table is similar to multiple regression output, as mediation is essentially a series of regressions.
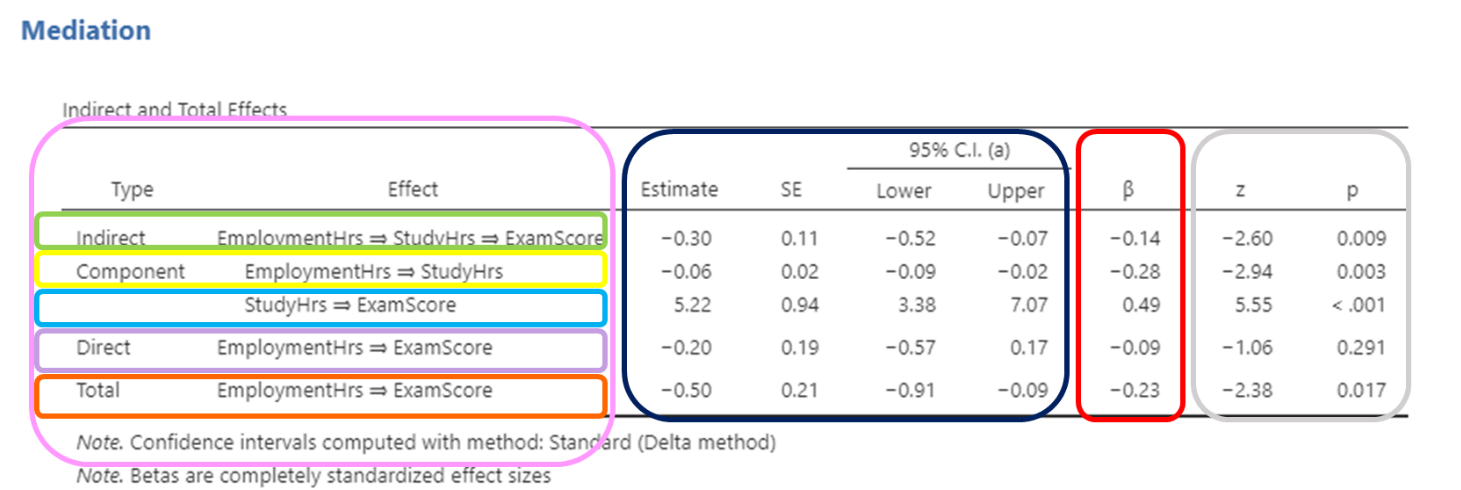
Type and Effect:
Specifies the component of the model.
Indirect effect (Path a*b).
Path a (predictor to mediator relationship).
Path b (mediator to outcome relationship).
Path c' (direct relationship between predictor and outcome).
Total effect (indirect + direct effect).
Unstandardised Coefficients (B)
Interpreted the same way as in multiple regression.
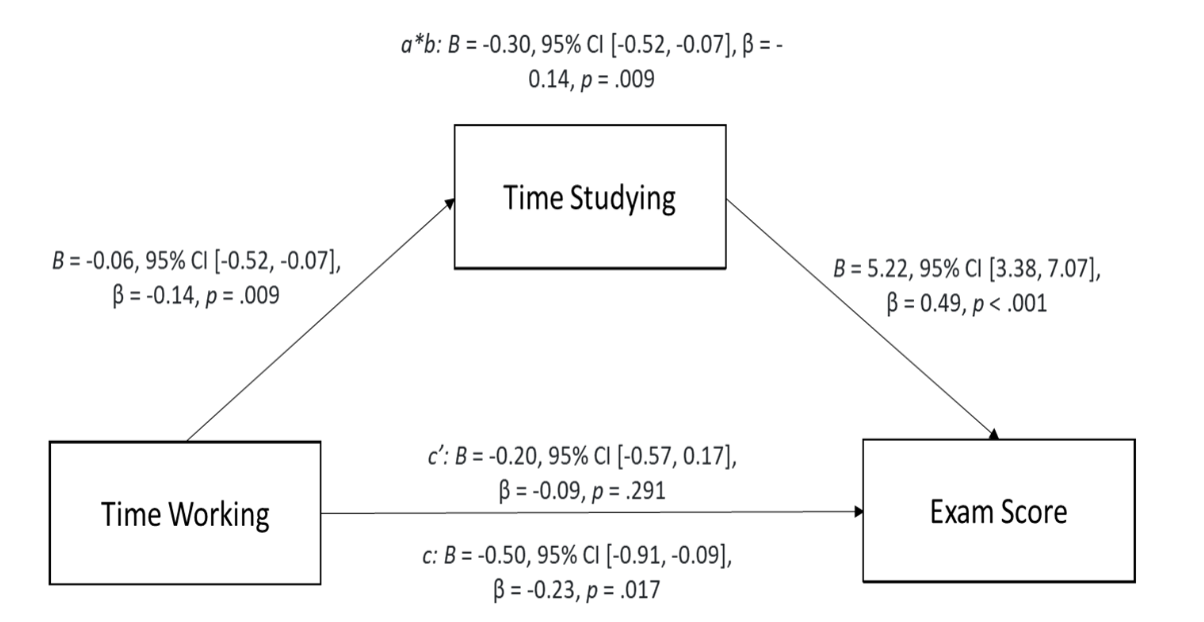
Example: An unstandardized estimate for the indirect relationship (B = -0.30, 95% CI [-0.52, -0.07]) indicates that for each one unit increase in the relationship between the predictor and mediator (Path a), and mediator and outcome (Path b), the outcome variable decreases by 0.30 units.
Columns include:
Unstandardized regression coefficients (B) for each path.
Standard error of B (precision measure for calculating confidence intervals).
95% confidence intervals for unstandardized coefficients.
If confidence intervals do not cross zero, the coefficient is significant.
Use confidence intervals rather than p-values for assessing significance in mediation because they are corrected for bias, deviations from normality and estimation errors in the model.
Standardised Coefficients (β)
Reported in the column labeled β.
Interpreted the same way as Stand.Estimate in multiple regression.
Example: A standardized coefficient for the direct relationship indicates that for each one standard deviation increase in the predictor (employment hours), the outcome (exam score) decreases by 0.09 standard deviations.
Z and p
The Z and p-value indicate whether each component of the model is significant.
However, use the confidence intervals rather than the p-value, as they're corrected for bias, deviations from normality, and estimation errors.
If the confidence intervals do not cross zero (i.e., both values are negative or both values are positive), this indicates that the coefficient is significant. For a mediation, it is more accurate to evaluate significance by looking at the confidence intervals, rather than the p value. This is because the confidence intervals are corrected for potential bias, deviations from normality, and estimation errors in the model, whereas the p value is not.
Path Diagram
Jamovi produces a path diagram of the model.
Choose a conceptual model (labels predictor, mediator, outcome) or a statistical model (regression coefficients for Paths a, b, and c').
Choose unstandardised or standardised coefficients.
This visual aid helps identify which output corresponds to each component.
However, the table is needed for additional information (estimates for indirect/total effect, confidence intervals, p-values).