ATMO.4350.5350 Hydrology of the Atmosphere Spring 2025 Final Exam Study Guide
Atmospheric Factors Impacting Warm Season Precipitation
Atmospheric factors influencing excessive warm season precipitation include:
Water vapor
Precipitable water
Precipitation intensity
Precipitation duration
Evaporation, Atmospheric Rivers, and Warm Season Precipitation
Examine the connections between evaporation, atmospheric rivers, and their influence on warm season precipitation.
Mesoscale Convective Systems (MCSs)
Definition of a mesoscale convective system (MCS): refer to all organized convective systems larger than supercells
includes squall lines (line of convective cells), bow echoes
supercell: individual thunderstorm with a rotating updraft
Methods for identifying MCSs using radar products.
Importance of MCSs for precipitation at both weather and climate scales, as discussed in student presentations.
Surface Characteristics and Flooding
Discussion of how surface characteristics can potentially contribute to flooding: Low elevation, presence of mountainous topography
Soil characteristics
persistently dry soil cannot uptake water efficiently
Cla heavy soil have low permeability
Already waterlogged soils cannot uptake any more water, leading to runoff
Snowmelt can exacerbate flooding
Climate vs. Weather
Distinguish between climate and weather: Weather is short term patterns in atmospheric, temporal, and precipitation conditions. Climate is long term typical weather patterns of a given area, at least 30 years.
Define a climate "normal" versus a climate mean/average:
Tools for Defining Hydroclimate Base State and Variability
Identify tools used to define the base state and variability of the hydroclimate.
Drought
Definition of drought: A period of abdormally dry weather that lasts long enough to cause hydrological impacts
How drought is defined.
Drivers of drought: Telecommunications (ENSO), atmo rivers, atmo blocks (Omega, High over Low, Blocking High), synoptic conditions, land atmo interactions, human impacts
dry soil reduces evap → less local precip → intensifies drought
Changes in drought patterns in a changing climate system, as covered in student presentations.
Pluvial
Definition of a pluvial: Period of abnormally high precipitation. Can cause flooding but not all pluvials are floods
How a pluvial is defined: On annual scale, 10% greater than annual mean. Monthly scale, 40% greater than monthly mean
Can use drought indices to identify pluvial periods
Drivers of pluvials
Blocking patterns: cause persistent weather conditions. Induces ascent, increase moisture transport, cloud cover, enhances precip
Land atmo coupling: Precip recycling and drought intensification/perpetuation
Changes in pluvial patterns in a changing climate system.
Precipitation Variability
Precipitation variability:
Spatially
Temporally
Impact of features like the Hadley Cell and the Walker Circulation on precipitation variability.
Teleconnections
Definition of teleconnections: Casual connection or correlation b/w meteorological or other environmental phenomena which occur a long distance apart - Sir Gilbert Walker
Types of teleconnections that occur in the hydroclimate system
Pacific Decadal Oscillation (PDO): El Nino like pattern, warm and cool phases based on SST anomalies in the Northeast and tropical Pacific Ocean. Phases last 20-30 eyars
Positive: cool SST in interior North Pacific. Warm SST along Pacific coast. Below avg sea level pressure over North Pacific
Negative: warm SST anomalies interior North Pacific. Cool SST anomalies along NA coast. Above avg sea level pressure over North Pacific. Currently in neg phase
North Atlantic Oscillation (NAO): Based on surface sea level pressure diffs b/w Subtropical High and Subpolar low
Positive: reflects below normal heights and pressure across high lats of North Atlantic, central North Atlantic, eastern US and western Europe
Negative: opposite pattern of height and pressure anomalies over these regions
Both phases associated w/basin wide changes in the intensity and location of North Atlantic jet stream and storm track and precip extending from eastern NA to western and central Europe
Arctic Oscillation (AO): Charac by winds circulating counterclockwise around the Arctic around 55 N latitude
Positive: ring of strong winds circulating around North Pole confines colder air across polar regions. Stronger jet streams, brings storms to Europe. Stronger tradewinds
Negative: Belt of winds becomes weaker and more distorted, allowing more southward penetration of cold arctic airmasses + increased storminess of mid lats. Weaker jet streams
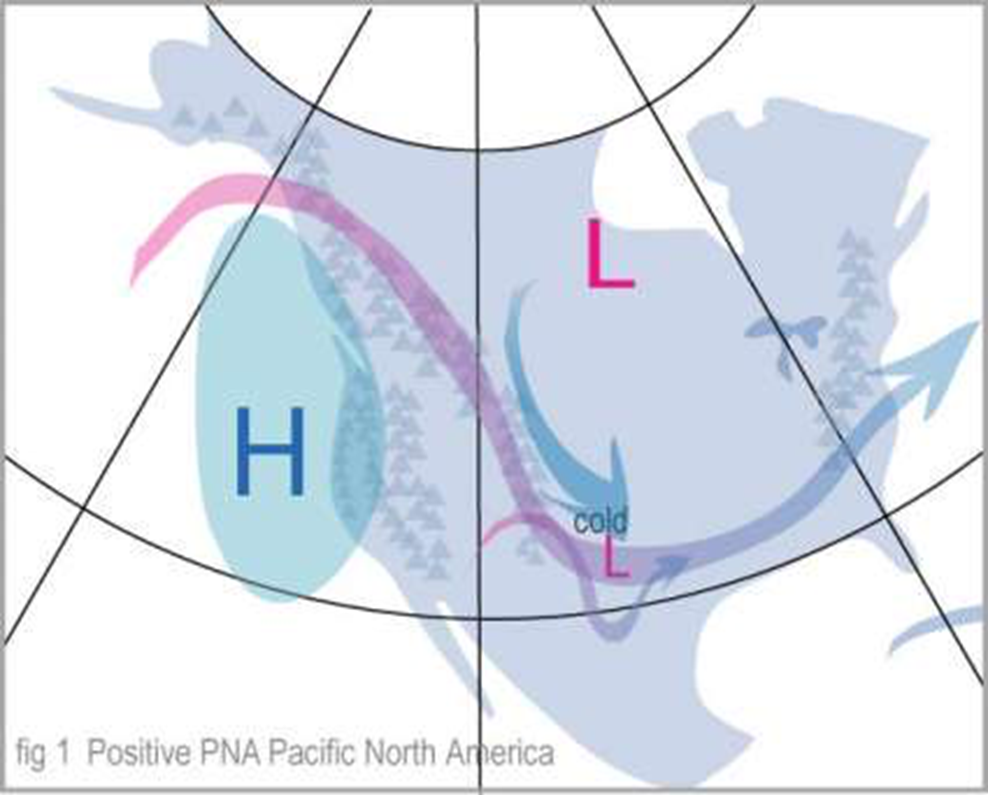
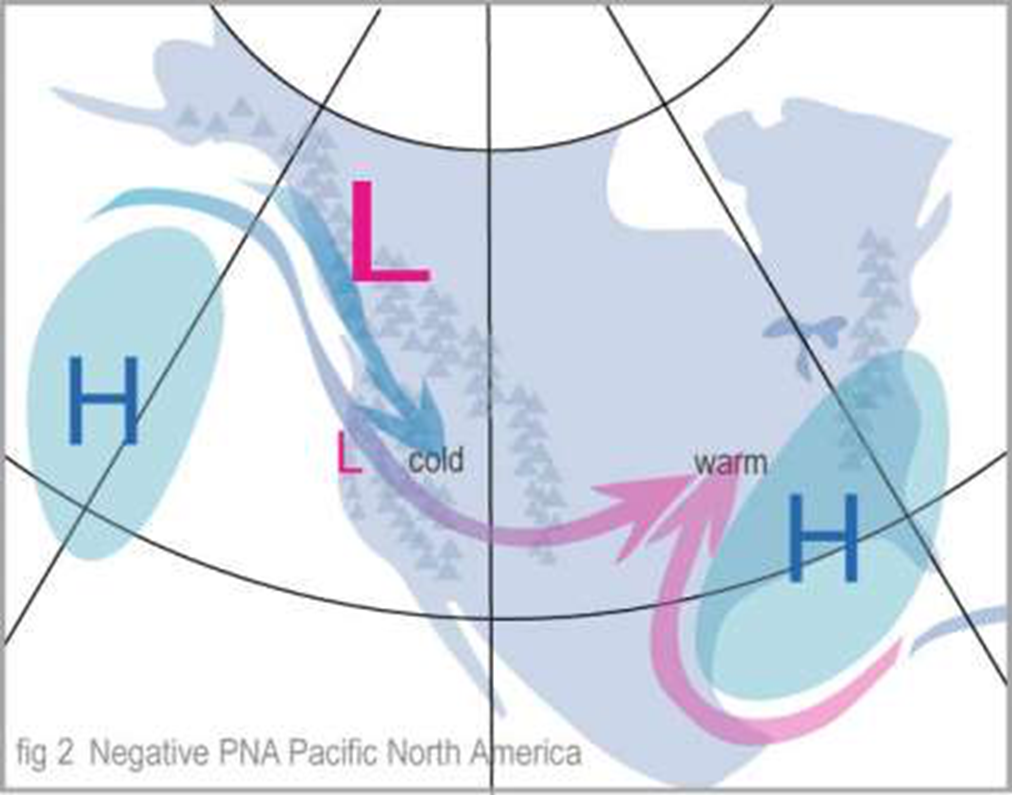
Pacific-North American Index (PNA): Appears in all months except June and July, assoc w/Rossby Wave dynamics
Atlantic Multidecadal Oscillation (AMO): Long term mode of nat’l variability occurring in NA ocean , 60-80 yrs. Based on avg SST anoms in NA basin, over 0-80N
Positive: corresponds w/pos SST anoms over NA, strong anoms in subpolar region and weaker in tropics
At times teleconnections can aplify or dampen reach other
Example: ENSO and PDO
El Nino, La Nina, and the Southern Oscillation
Relationship between El Nino and La Nina and the Southern Oscillation:
El Nino is warm phase of ENSO, La Nina cold phase
Southern Oscillation Index (SOI) = (stdized pressure Tahiti - stdized pressure Darwin) / monthly stdev
Corresponds very well w/changes in ocean temps across eastern tropical Pacific
El Nino, air pressure higher in Darwin, Aus = neg SOI
La Nina, air pressure lower in Darwin, Aus = pos SOI
Identification of El Nino and La Nina on maps or graphs:
El Nino: positive SST anomalies along equitorial Pacific, especially central and east Pacific. Heavy rising over Pacific. Sinking motion over Maritime cont and Atlantic. Weak trade winds
La Nina: neg SST anomalies along eq Pacific. Heavy rising motion over Maritime and Atlantic. Sinking over east Pacific. Strong trade winds
Impact of El Nino and La Nina on precipitation distribution and the reasons behind this impact.
El Nino: Warmer in Canada, wetter along Jet stream (in a lower position than normal) passing over southern US, dry in SA, drier in Ohio river valley. More hurricanes in Pacific due to less vertical wind shear. Less hurricanes in Atlantic due to stronger vertical wind shear and trade winds
La Nina: Colder in Canada, wetter in NW US and Ohio river valley, drier in southern US. Fewer hurricanes in Pacific due stronger vertical wind shear. More hurricanes in Atlantic due to weaker vertical wind shear and trade winds
Wind shear: Difference in wind speed and/or direction over a relatively short distance in the atmosphere
Madden-Julien Oscillation and Monsoons
Definition of the Madden-Julien Oscillation: 30-60 day oscillation of eastward moving tropical rainfall. Most active over Indian and Pacific oceans. A[[ears 40-50% of the time
Influences monsoons
Definition of a monsoon: As ITCZ swings north during summer, brings monsoon rains to Kozhikode India. As ITCZ swings south during winter, brings monsoons to Darwin Aus.
Monsons occur b/w seasonal ITCZ positions
Climate Change Impacts on the Hydroclimate
Types of impacts a changing climate can have on the hydroclimate from local to global scales and the underlying reasons.
Oceans will warm, increased precip variability and increased precip extremes.