IB Biology HL Y1 Quarter 1
Blue highlight = example / Green highlight = important info i think probably
Standards - D4.1, A4.1, A3.1, A3.2, C4.1, B4.1
D4.1 Natural Selection (SL Standards Only)
Lamarck (wrong!)
individuals develop traits to better survive
passes down these traits to their offspring
leads to all members of a species having favorable traits
Darwin (yay!)
Studied finches in the Galapagos Islands and came to these conclusions:
there is naturally variation in a species
some variations give advantages over other species for survival
those that survive with favorable traits have a higher chance to reproduce compared to those with less favorable traits, passing down those traits
number of individuals with favorable traits increases, number of individuals with less favorable traits decreases
eventually favorable trait is the most common
over generations (millions of years), differences can accumulate to a new species
Paradigm shift - fundamental change in approach or assumptions
Lamarckism to Darwinism
Natural selection - mechanism driving evolutionary change
Competition - overproduction of offspring and limited resources lead to a struggle to survive, leading to natural selection
Abiotic factors - nonliving factors affecting survival (temperature, natural disasters, water amount, salt tolerance, etc.)
Variation - must be variation in a population; caused by mutation, sexual reproduction, meiosis
Fitness - different individuals have different adaptations which could increase survival chance and therefore increase reproduction (survival and reproduction of the fittest!)
Traits must be heritable to be passed down for evolution
Sexual selection - type of selection pressure focused on differences in physical and behavioral traits, affect success in finding a mate, can cause evolution
Endler and Guppies
Stronger predator = natural selection over sexual selection
Weaker/no predator = sexual selection over natural selection
A4.1 Evolution and Speciation
Evolution - change in the heritable characteristics of a population over time
Divergent evolution - one species split into two and then was modified over time by natural selection, embryos develop similarly
Homologous structures - same position and structure but not necessarily the same function from a common ancestor
Vestigial limbs - leftover traits from common ancestor
Pentadactyl limb - “five digits” most animals have some version of this
Convergent evolution - similar environment so species evolved to look similar (not genetically related!)
Analogous structures - same function, NOT ancestrally related, determined by looking at development
example: Shark body vs. dolphin body
DNA and RNA evidence - can compare DNA and RNA sequences for similarities as the more similar they are the more likely they evolved from common ancestor (very strong evidence of evolution)
stronger evidence than amino acids as one amino acid is 3 DNA/RNA bases
Selective breeding (artificial selection) - caused by humans, rapid changes
examples: cows, chickens, tomatoes, bananas
Speciation - splitting of pre-existing species into two or more new species, only method for new species, must come from an ancestor that split
Types of speciation | Allopatric speciation | Sympatric speciation |
Definition | species separate into two isolated groups (geographic) | evolution of a new species from a surviving species that both live in the same geographic region |
Reproductive isolation - population must be separated
Differential selection - shift in one population from another due to different selective pressures
Types of reproductive isolation | Geographical | Temporal | Behavioral |
Definition | separated by a barrier | different mating seasons | different types of behavior, often courtship ritual |
Chimpanzees and Bonobos - geographically separated by Congo River (different habitats = different selection pressures)
Chimpanzees had more competition for resources in the savanna and an overlapping habitat with gorillas, so they evolved to be more aggressive
Bonobos had less competition for resources in the forest so they evolved to be less aggressive
Polyploidy - plants can hybridize and gain different chromosome numbers (very rapid speciation as they self fertilize)
example: Knotweed
Hybridization - when two different species have an offspring, most animals have behavior that prevent cross breeding
example: Mule (sterile hybrid)
Barriers to Hybridization
Prezygotic Barriers | Postzygotic Barriers |
behavioral - do not recognize each other as mates | lack of viability - lowers fitness |
mechanical incompatibility - reproductive parts do not fit together | sterility of hybrids - prevents mixing of alleles between species |
gametic incompatibility - sperm and egg do not go together |
Adaptive radiation - one species rapidly diversifies into many species that are closely related due to vacant roles in an ecosystem (no competition)
Examples: Hawaiian honeycreepers, Darwin’s finches
A3.1 Diversity of Organisms
Variation - no two individuals are alike, there are patterns of variation between organisms that are used to name them, there is more variation between species than within a species
Binomial naming system - Genus species (Genus first letter is capitalized, species is lowercase), species in a genus have similar traits (Linnaeus)
Morphological species concept - created by Linnaeus, species are groups of organisms with shared traits, sorted by morphology, no longer used as organisms that look similar could be separate species
Biological species concept - group of organisms that can breed and produce fertile offspring, only works for sexually reproducing species, some species produce hybrids, bacteria can transfer genes through horizontal gene transfer
Phylogenetic species concept - smallest set of organisms that share a common ancestor using DNA
Recognition species concept - species that recognize each other as mates
Difficulties distinguishing species and populations - genetically different enough? arbitrary distinctions, can they reproduce if brought back together?
Chromosome numbers - different species have different chromosome numbers, same species have the same chromosome numbers
Diploid cells - even number of chromosomes
Horse - 64, Donkey - 62 —> Mule - 63 (infertile)
Karyogram - full set of chromosomes
Karyotype - banding pattern and length of chromosome
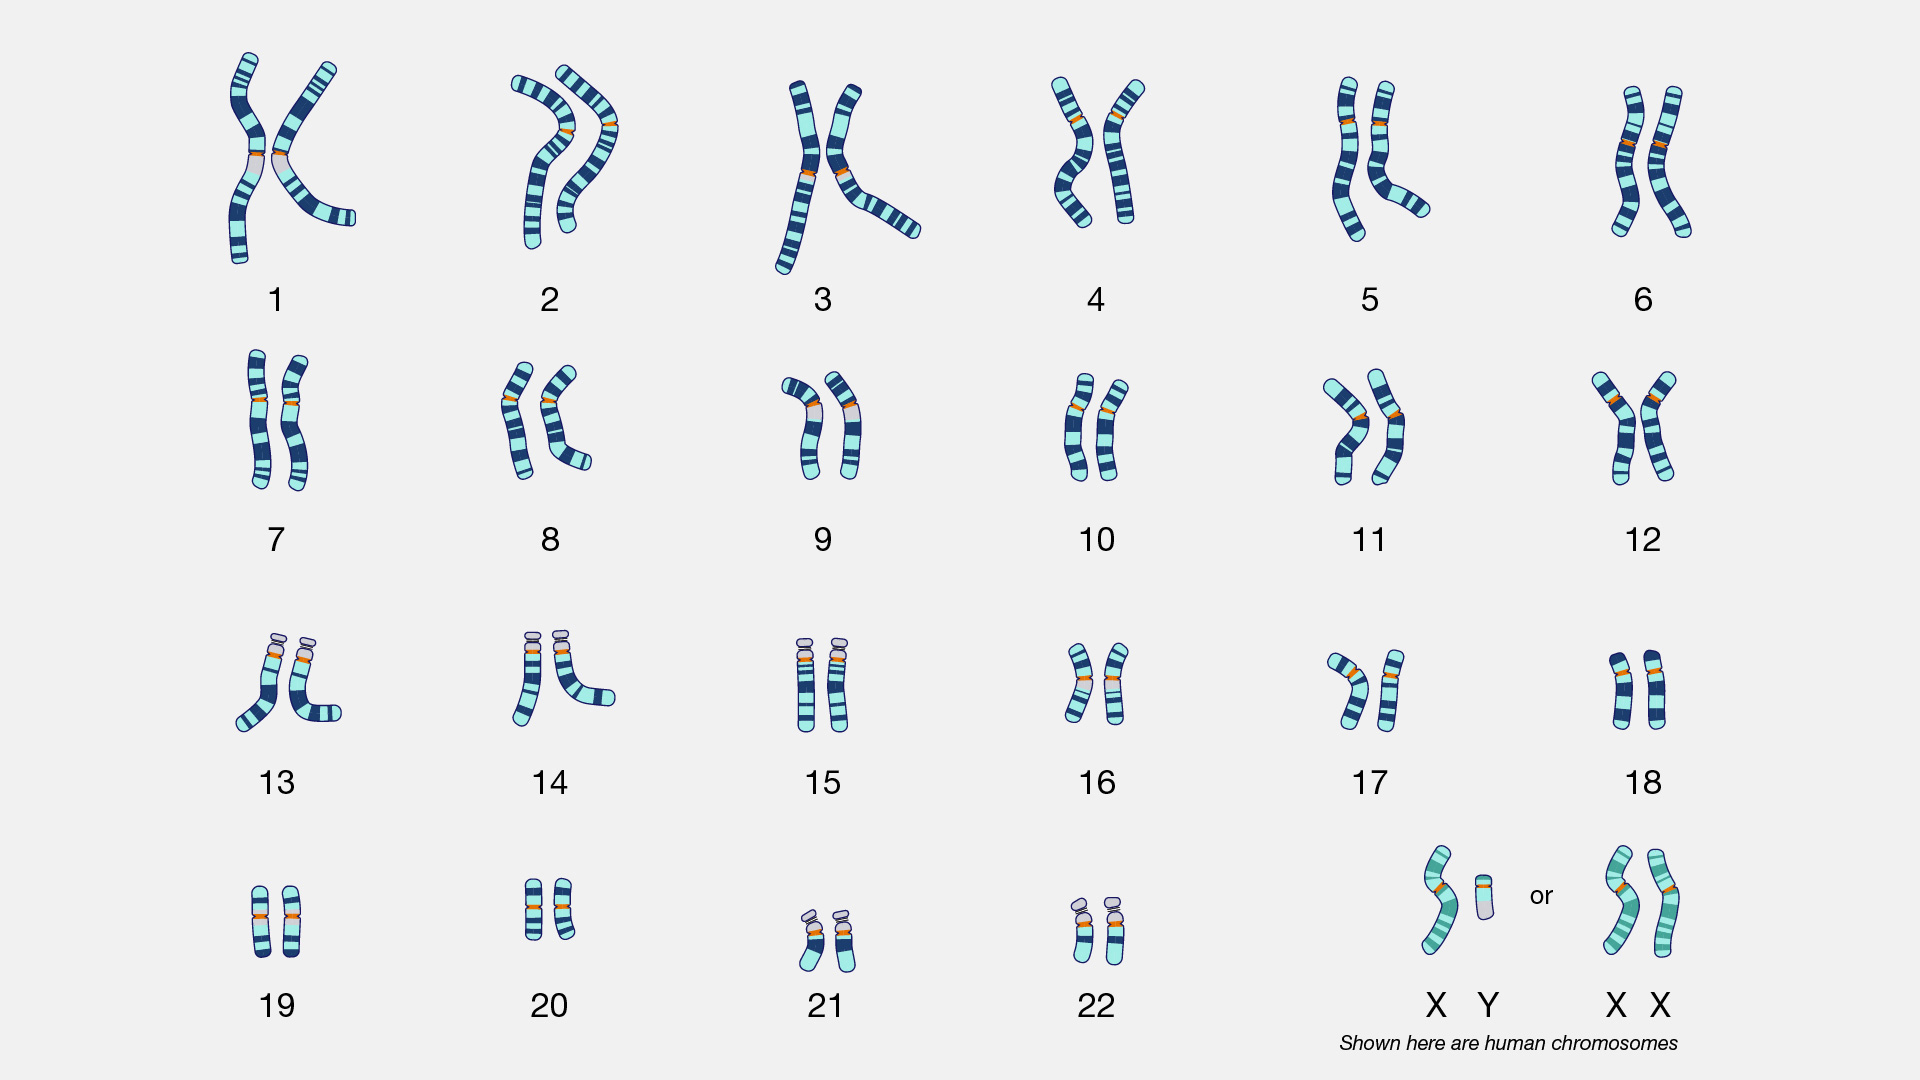
Fusion of chromosome 2 in humans - by comparing karyotypes of chimpanzees, gorillas, orangutans, and humans, it can be seen that chromosome 12 and 13 fused to form our chromosome 2
Genome - all the genetic information of an organism
organisms of the same species have almost the exact same DNA
changes are caused by single-nucleotide polymorphisms (single base changes)
vary greatly in length between species, very little difference in a species
in 2004, next-generation sequencing (NGS) was created to speed up gene sequencing, lowered costs from $1 million in 2007 to $1000 in 2014 ($600 today)
Dichotomous keys - “two parts” use of morphology to quickly identify organisms
DNA Barcoding - species can be identified using DNA barcodes (short known sections of DNA), often used on feces (poop) or water samples
A3.2 Classification and Cladistics
Why do we classify organisms?
There are millions of species
Allows us to understand how they are related to other species
Useful in medicine (related plants could have similar effects)
Allows us to predict characteristics of organisms
Clades - groups of organisms with common ancestry and shared characteristics, created through base sequences/amino acids or morphology
Parsimony analysis - the fewest changes is the most likely (smallest number of sequence changes)
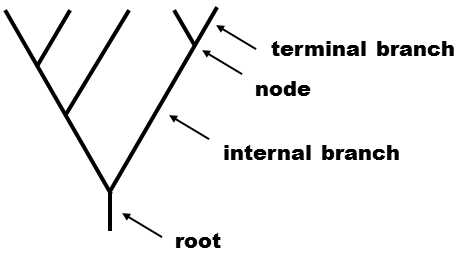
Cladograms - tree diagrams that show the most probable sequence of divergence in clades
Root - initial ancestor common to all organisms within the cladogram (incoming line)
Node - hypothetical common ancestor that speciated to two or more species
Outgroup - most distantly related species in the cladogram (comparison/reference)
Clades - a node and all of its connected branches
Terminal branch - individual species included in the analysis
Inner branches - show splitting of ancestors (typically extinct)
Molecular Clock - allows an estimate on how long species have been separated
Mutation rate * Number of mutations = time
Time per mutation = (t/mutation)
Mutation rates are affected by generation time (longer = lower rate), population size (larger = higher rate), and selective pressure (depends but usually lower)
Cladistics vs traditional taxonomy
traditional taxonomy was rigid
cladistics has natural clades that are unranked
better matches patterns of divergence through evolution
Three Domain System
Woese used rRNA sequences to create a new cladogram of life
created three new domains (a level above kingdoms)
Paradigm shift from 5 kingdoms to 3 domains
Changing Clades - can redo cladograms that were based on morphology or had small sample sizes with new evidence, example that theories can be falsified
Example: Figworts went from one big family to many families (convergent evolution)
C4.1 Populations and Communities
Ecosystem - organisms and their environment (biotic and abiotic)
Habitat - the non living component
Community - all organisms living in an area
Population - Same Species, Area, Time (SAT)
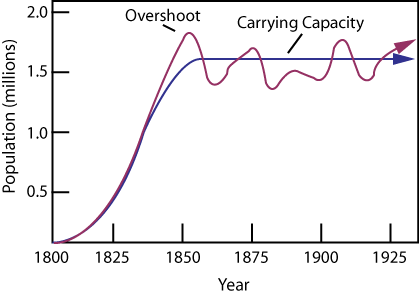
Carrying capacity - max capacity of animals an ecosystem can support due to lack of resources
Positive feedback - one variable causes an increase in another variable
Negative feedback - one variable causes a decrease in another variable
Density dependent - depends on density of population size, bring towards carrying capacity
Examples: Disease, predators, food
Density independent - does not depend on population size, fluctuating population
Examples: Weather, natural disasters
Interspecies interactions
Herbivory | Animal eats plant | Deer eat all plants |
Predation | Animal eats another animal | Coyotes eat rabbits |
Interspecific competition | Two species compete for same resources | Coyotes and wolves |
Mutualism | Two animals increase each others survival | California oak and fungi |
Parasitism | One animal lives on or in another organism and takes its nutrients | Rockfish and protozoa |
Pathogenicity | Spreading disease to another organism | Avian flu |
More mutualism examples
Root nodules in Fabaceae - Bacteria get carbon (sugar), legumes get nitrogen
Mycorrhizae in Orchidaceae - Mycorrhizae Fungi get carbon (sugar), orchids get nitrogen
Zooxanthellae in hard corals - Zooxanthellae get protection, coral gets nutrients like glucose (sugar)
Lotka Volterra - predator prey graph, as predator goes up prey goes down, form of negative population control
Time Gap - gap between changes
Example: lynx and hare
Intraspecific competition - competition between same species for resources
Examples: male zebras, tigers, bears, male antelopes, eagles, hawks
Intraspecific cooperation - cooperation between same species to increase survival
Examples: wolves, humans, ants, bees
Allelopathy - plants produce toxic compounds that affect the growth of other plants, transferred by rain, as a gas, and dead leaves
Examples: Black walnut, mustard
Antibiotics from plants - kill bacteria, bitter taste
Examples: California bay, coffeeberry
Population control in communities
Top down - predators limit population size
Bottom up - nutrients in ecosystem limit population sizes
Example: Phytoplankton (bottom up)
Population size by random sampling
Sampling error - difference between the population total and the population estimate
Random quadrat sampling - sample random squares from a grid to estimate the total population of sessile (nonmoving) organisms
How many are in the squares multiplied by total squares divided by squares sampled
Capture-mark-release-recapture - capture animals, mark them, release them, wait, recapture them, count how many you captured and specifically how many were marked, used to estimate population of moving organisms
Lincoln Index
Association between species - use chi squared
Population Growth Curves
Most populations start exponential because there is an abundance of resources
Starts to flatten (logistic/sigmoid) as resources become limited
Take the log of the y axis to confirm exponential growth
Competition between species?
Lab experiments - trying growing them together and see what happens
Field experiments observation - use random sampling and chi squared (see if species are usually together)
Field experiments manipulation - remove species and see what happens
Null hypothesis - no correlation between species
Alternative hypothesis - there is a correlation (most likely negative)
Invasive species - competes with native species, if it can outcompete native species then the native species is threatened
Example: Western pond turtle and red eared slider (invader)
B4.1 Adaptation to Environment
Habitat - place in which a community, species, population or organism lives, geographic and physical location, type of ecosystem
Biome: Ecosystems with similar communities
Temperature and rainfall affect distribution of biomes
Biome | Climate |
Tropical Forest | High temp, high rainfall |
Temperate Forest | Moderate (fluctuating) temp, medium rainfall |
Taiga | Low temp, low/medium rainfall |
Grassland | Fluctuating temp, low rainfall |
Tundra | Really low temp, really low rainfall |
Hot Desert | High temp, really low rainfall |
Adaptation to Hot Desert and Tropical Rainforest Examples
Area | Example | Adaptation |
Hot Desert | Camel | Hump to store fat to use as water |
Hot Desert | Desert Tortoise | Digs burrows - has special feet to dig burrows |
Hot Desert | Fennec fox | Nocturnal |
Hot Desert | Kangaroo Rat | Special kidneys |
Hot Desert | Saguaro Cactus | Thick waxy coating, reduced leaves, hard spines |
Tropical Rainforest | Jaguar | Swim, climb and run - all parts of the habitat |
Tropical Rainforest | Frogs | Moisture and poison |
Tropical Rainforest | Drip tips | Climbing plant, aerial roots, pointy leaves to drain excess water |
Abiotic Factors affect species distribution
Species can only survive in certain areas because of abiotic factors, like temperature, pH, salinity, humidity, and oxygen levels
Example: Sugar maple - temp between -18 degrees C and 27 degrees C
Example: Tropical fish - temp ranges from 60-85 degrees F
Range of tolerance - limiting factor of population size, outside of range means lower population
Coral reefs
Temperature - 23-29 degrees C
Salinity - high salt levels 32-42 parts per thousand
Light - clear water for high levels of light
pH - need a stable pH above 7.7
Water depth - most corals occur within less than 25 m of water depth
American beachgrass
lives on sand dunes
has a deep, strong and extensively creeping rhizome (connecting root)
survives in sandy and salty environments
Mangroves
lives in coastal intertidal zones
Prop roots - stay upright with changing tide AND aerial to get oxygen
Salt filtration - can remove salt from the roots OR through the leaves
Pneumatophores - breathing tubes to get air