Supply
In the early twenty-first century, the price of oil in the United States steadily rose, shooting the price of gasoline upwards of $4.00 per gallon. These gas prices became a new normal, with oil prices consistently remaining over $100 a barrel. But then in 2014, oil prices began to collapse, eventually falling all the way to $36 a barrel. In many places, gas prices fell under $2.00 per gallon. Why did this price collapse occur?
One main reason for the collapse was a drastic increase in the total supply of oil. A new technology called fracking was implemented in the United States, allowing companies to access new oil from shale rock. This new technique drastically increased the amount of oil available on the market. At the same time, there was a decrease in demand for oil. Economies that had been growing steadily before 2010, such as China, Russia, India, and Brazil, began to experience an economic slowdown. For this reason, they didn't need as much oil anymore.
These two events—the increase in supply and the decrease in demand—created a perfect storm, causing the price of oil to fall by over two-thirds. Over the next few lessons, we'll learn more about supply and demand and how they work together to determine prices in market economies.
Law of Supply
In the last module, we indicated that supply was how much of a particular product was available in a market. More precisely defined, supply is the ability and willingness to produce and sell specific quantities of a good or service at different prices in a specific time period, all things remaining the same.
Let's break down that definition further. Companies must not only be able to produce something; they must be willing to produce it. If there's no incentive (i.e., profit) to produce a particular good or service, then it won't be produced. Companies then must decide how much of that product they want to produce in a specific time period. This will vary depending on what prices consumers are willing to pay for that product. All things remaining the same means that producers will be able and willing to produce a certain quantity of goods at a certain price in a certain time period, as long as no other variables change. These other variables could be things like a change in the number of producers in an area or a change in the technology used to produce the good. We'll discuss these variables in more detail later in the lesson.
The law of supply states that producers will make more of a product if the price goes up and less of a product if the price goes down. This only makes sense. The more money you can make for doing something, the more likely you are to keep doing it.
So, when the price of a good or service changes, it will change the quantity supplied—the quantity of a product that producers are willing to sell at a particular price, all other things remaining the same—of that good or service. When the price changes, the quantity supplied changes—this is called change in quantity supplied.
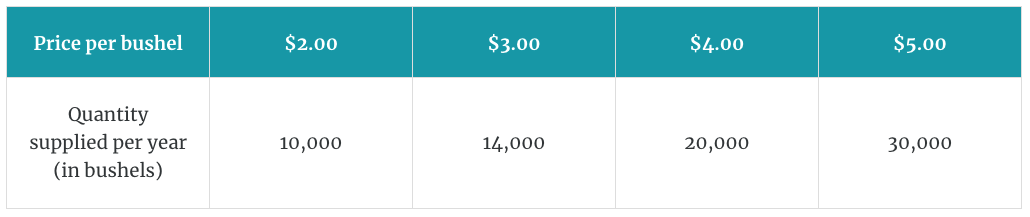
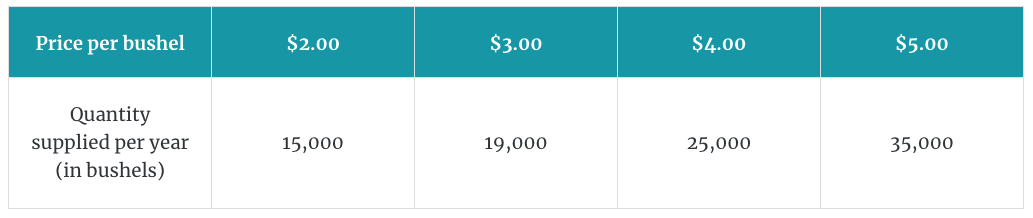
As an example, let's take a look at corn farmers in our fictional nation of Stalkland, which has adopted a market economy. To do so, we will create a supply schedule, which is a table that shows the quantity supplied at different prices, all things remaining the same. The table shows us how many bushels of corn will be collectively supplied by all the corn producers in Stalkland each year, depending on what price the bushels are sold for. For instance, if the price per bushel is $2.00, then only 10,000 bushels will be supplied. But if the price of corn is $5.00 per bushel, then there will be 30,000 bushels of corn supplied.
When the price of corn is high, corn farmers are willing to supply a lot of corn. But when the price is low, it's not worth it for them to grow as much. Some farmers might decide to grow wheat instead, or they may just let their fields lie fallow because they don't think it's worth their time and effort to produce anything at such a low price.
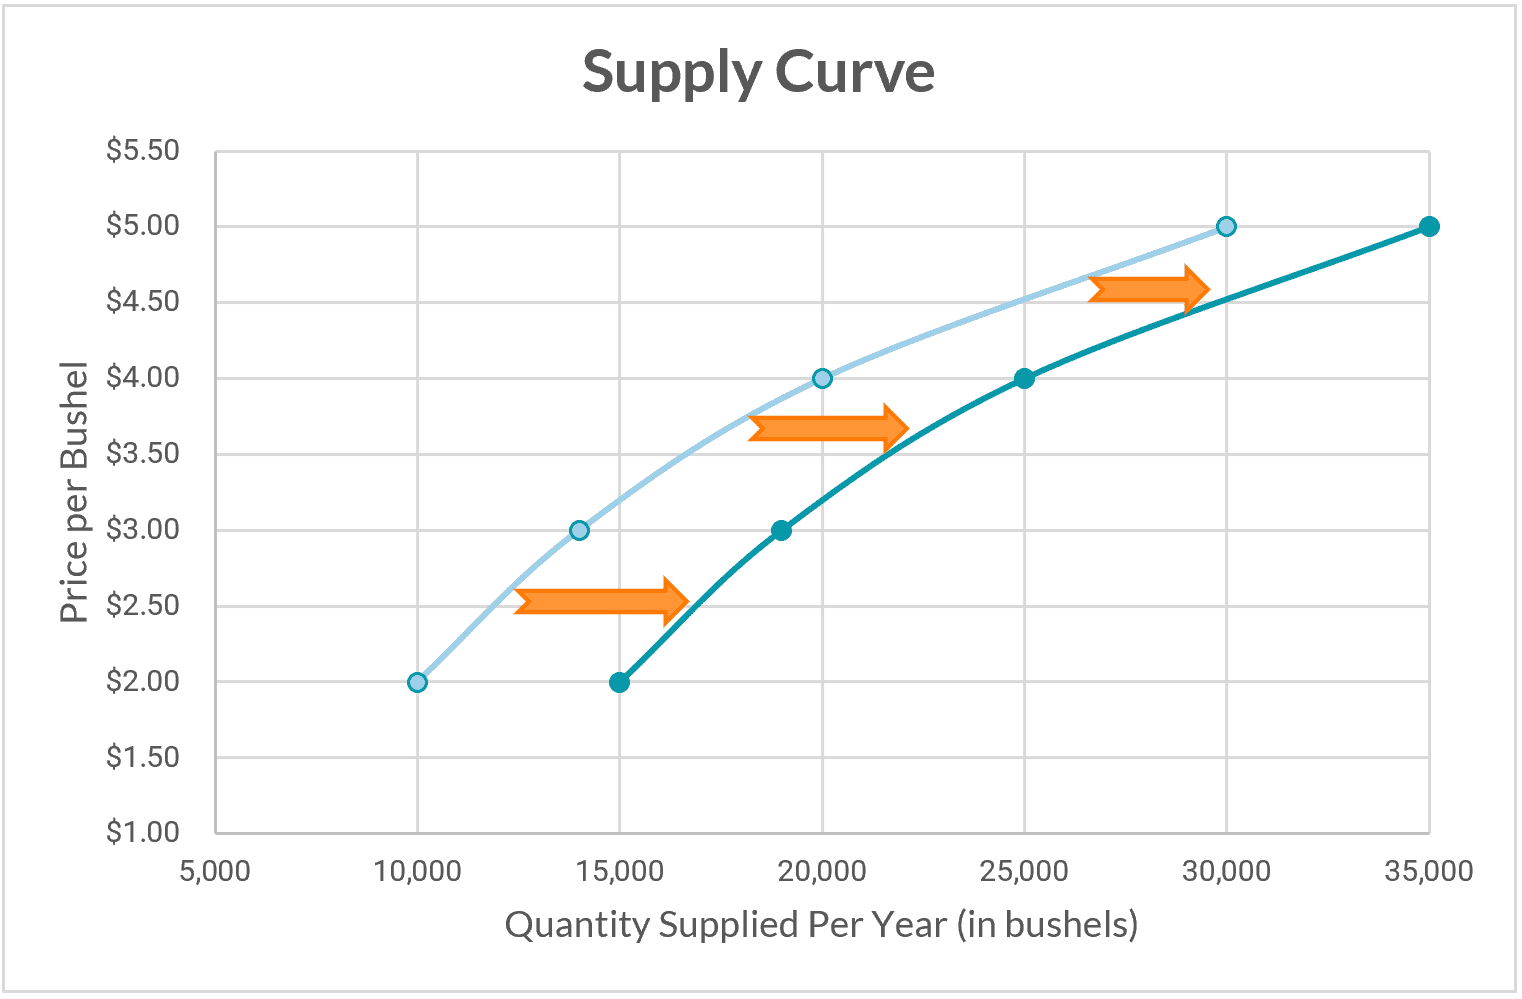
We can also represent our supply schedule as a graph, called a supply curve. On our corn supply curve, we can easily visualize how the price of corn affects the quantity supplied.
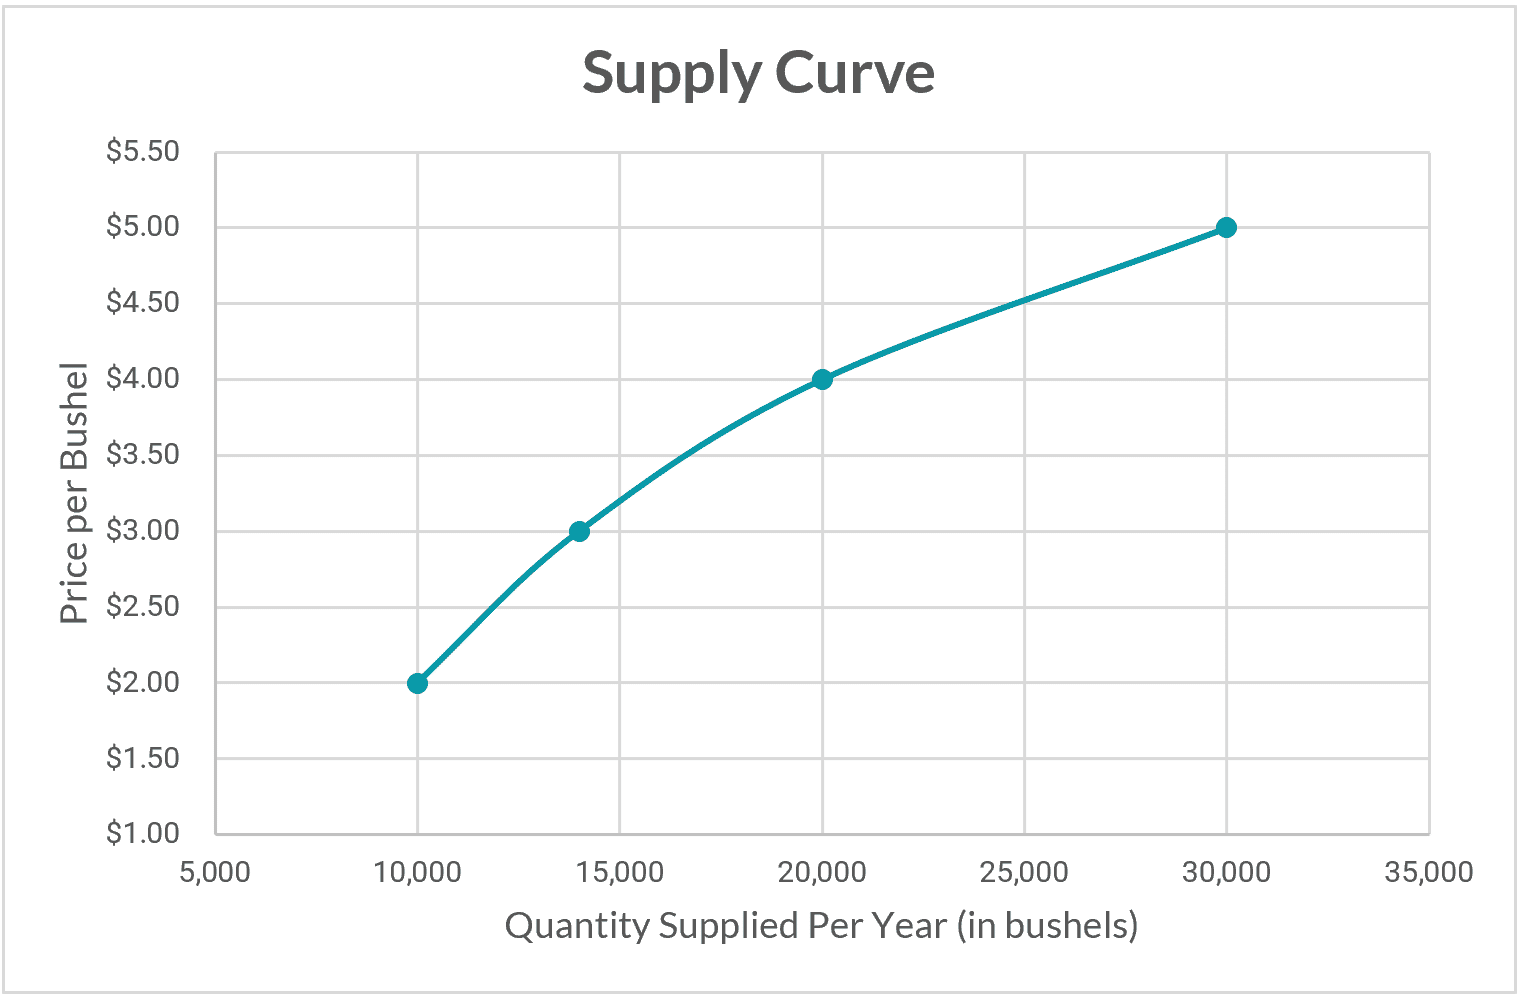
Notice that change in quantity supplied is represented by the different points on the supply curve. The curve itself does not shift. However, remember that our supply schedule (and thus our supply curve) only represents the quantity supplied if all other things remain the same. When some of these other things change, the entire supply curve can shift in one direction or the other.
Change in Supply
A shift in the supply curve is called a change in supply. There are several variables known as determinants of supply, and when these variables change, then there is a corresponding change in supply. The entire curve will shift, resulting in a new set of quantities that will be supplied at specific prices. Changes in supply can result from the following:
bullet
A change in the prices of the resources used to produce the good or service. If farmers have to pay more to get good fertilizer for their crops, they will be willing to supply fewer of those crops at the same price level. If the fertilizer became cheaper, they'd be willing and able to supply more crops for the same price.
bullet
A change in the technology used to produce the good or service. If a new irrigation technology increases crop yields, then farmers will be willing to provide more crops for the same price. You might think that technological changes would always result in a greater supply of a particular good or service, but this isn't always the case. If a particular technology is outlawed or banned for some reason (such as it being unhealthy or bad for the environment), then this would be a technological change that results in a lower supply for a particular good or service.
bullet
A change in the alternative profit opportunities available to producers by selling other products. If the price of wheat skyrockets, then farmers will be less willing to grow corn at lower prices. It would make more sense for them to shift their production to wheat to make more profit.
bullet
A change in the number of sellers in a market. If the number of sellers of a product increases, there will be a positive change in supply; and if there are fewer sellers, then less of the product will be supplied.
bullet
A change in the expectations of producers. There are many types of expectations that producers have when making products. When farmers plant their corn, they do so with an expectation of what that corn will be worth when it's harvested, but they can't know for certain. If the farmers' expectations change—for example, they think a drought will reduce the quantity of corn they can supply—it will impact their production decisions.
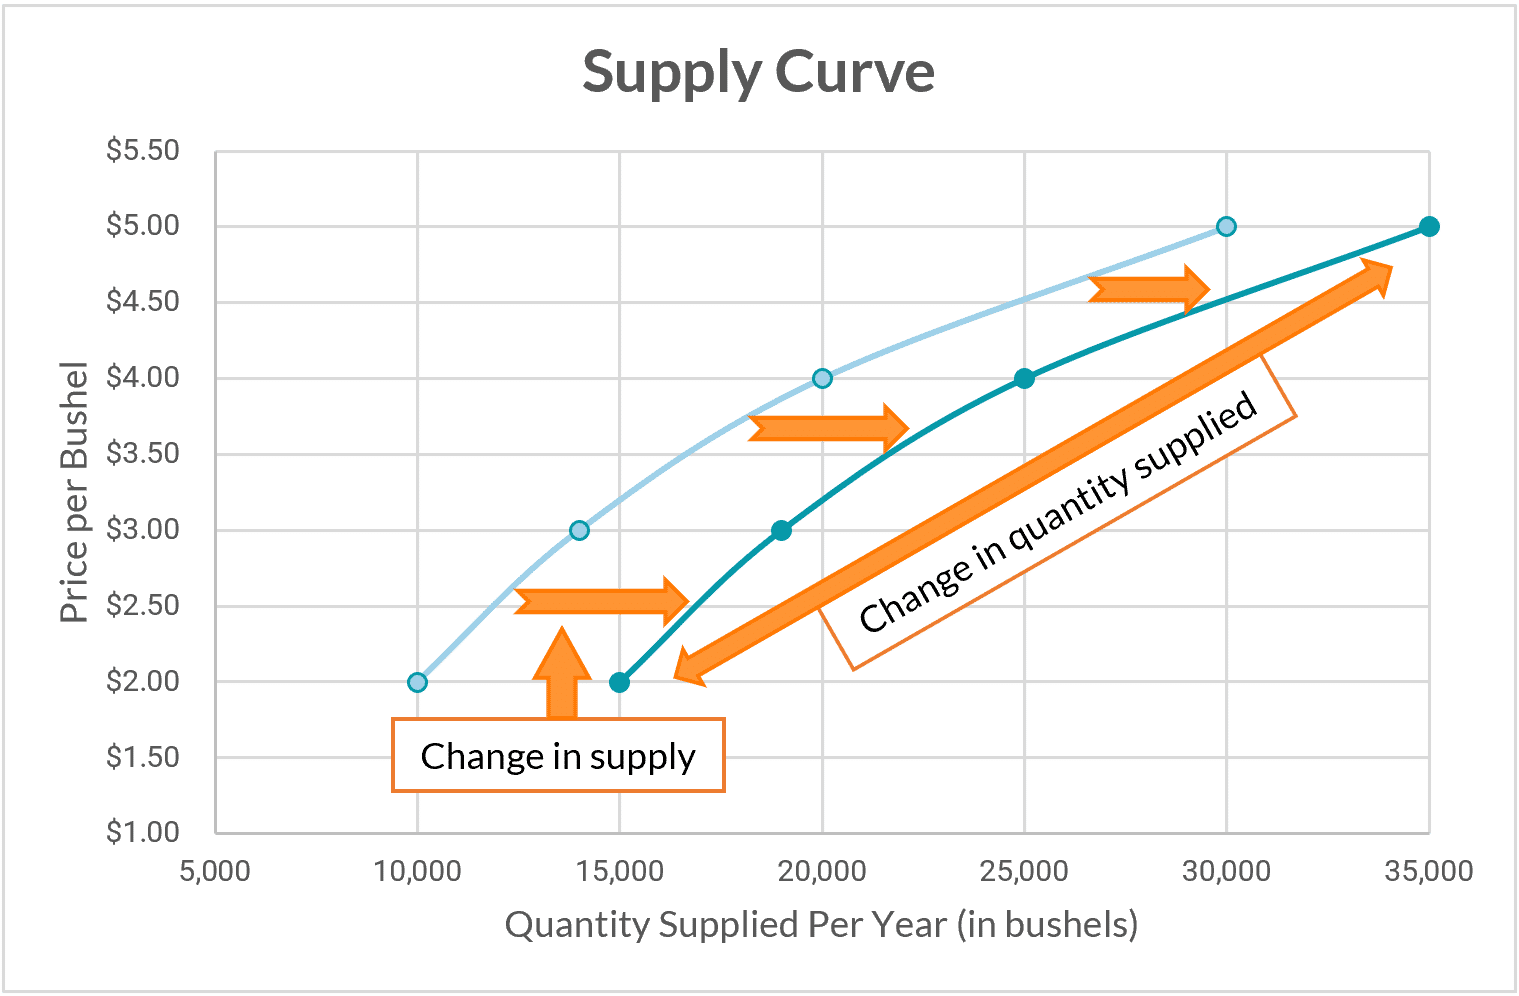
Let's take a closer look at two of these scenarios. What would our supply curve look like if Stalkland farmers implemented a new irrigation technology that improved their crop yields without increasing their production costs? Because they could grow more corn for the same price, they'd be willing to supply more corn than before. This change in supply would result in a greater quantity supplied for each price point, and the entire supply curve would shift to the right. This is what our new supply schedule and supply curve would look like:
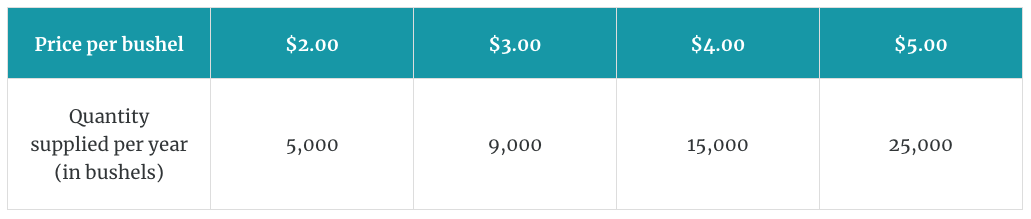
But what if the price of wheat in Stalkland increased, making it more profitable for farmers to grow wheat instead of corn? Farmers would be less willing to supply corn than before because there is a better alternative use for their resources. This would be a negative change in supply, and the entire supply curve would shift to the left, as seen in the next graph.
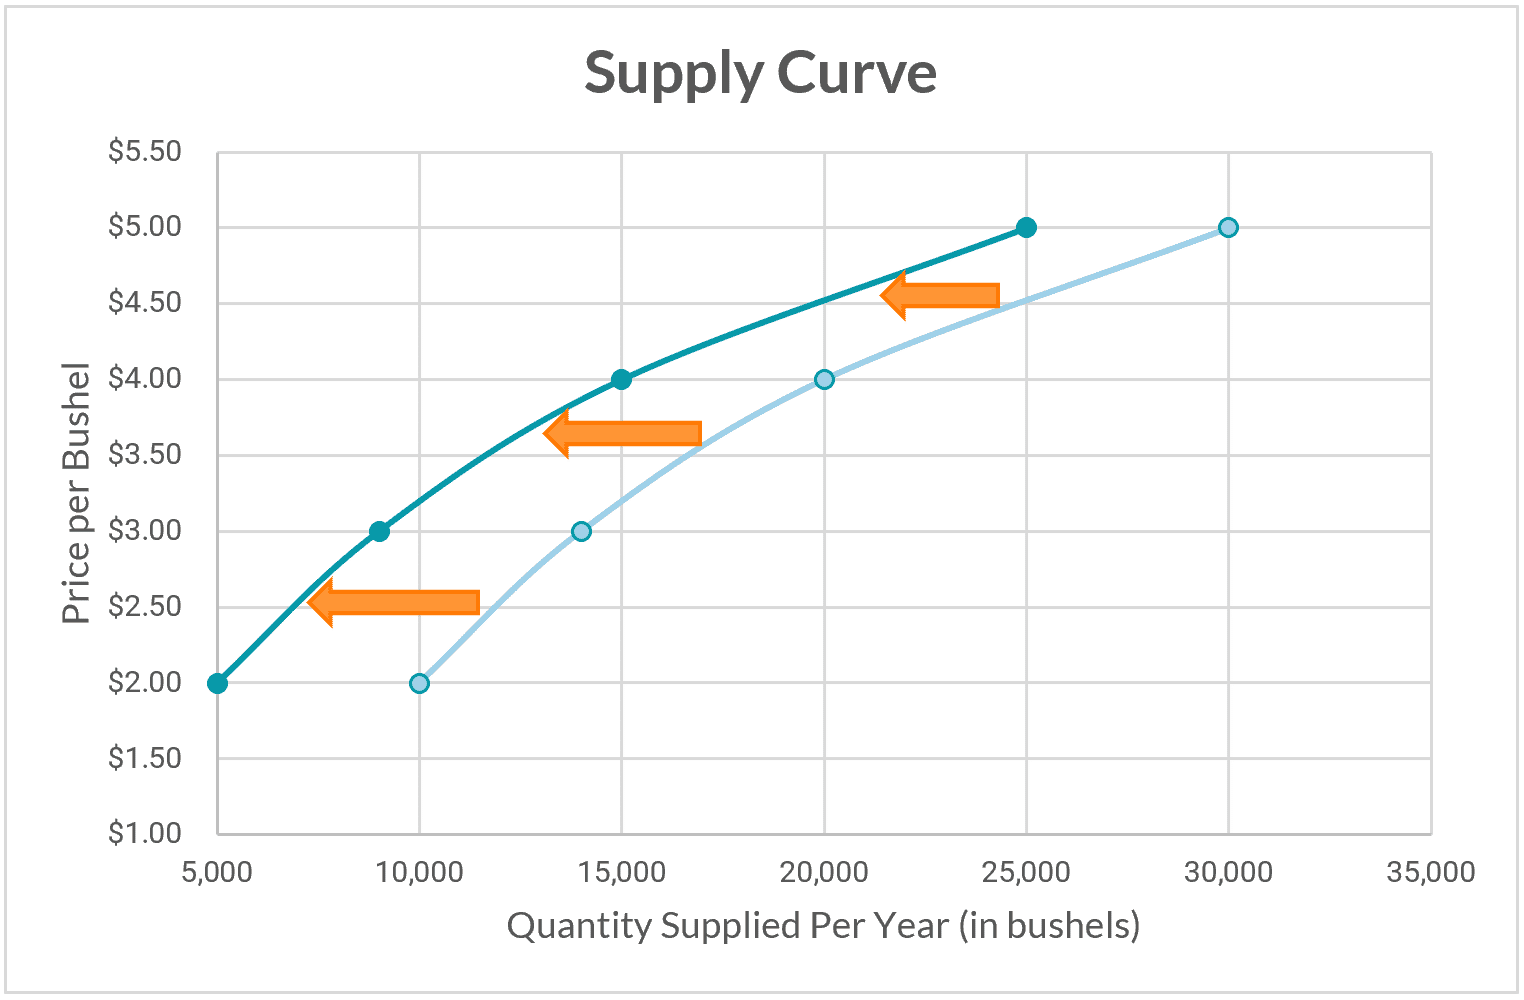
Change in Quantity Supplied vs. Change in Supply
It's important to understand the difference between change in quantity supplied and change in supply. Change in quantity supplied involves moving along the same supply curve, and the movement of the price is the only variable that causes the change. Change in supply occurs due to changes in the determinants of supply and involves a shift of the entire curve itself.
Review of Key Terms
supply: the ability and willingness to produce and sell specific quantities of a good or service at different prices in a specific time period, all things remaining the same
law of supply: producers will make more of a product if the price goes up and less of a product if the price goes down, all things remaining the same
quantity supplied: the quantity of a product that producers are willing to sell at a particular price, all other things remaining the same
change in quantity supplied: change in the number of products producers are willing and able to supply due to changes in price
supply schedule: a table that shows the quantity supplied at different prices, all things remaining the same
supply curve: supply schedule represented as a graph
change in supply: a positive or negative shift in the supply curve due to a change in the determinants of supply
The amount of a good or service that producers are willing and able to supply is an important component of the price system of market economies. However, it's only half of the equation. In the next lesson, we'll discuss the second component—consumer demand.