BMS103 S2
Professional Ethics and Laboratory Safety
Objectives + Prac. Qs
Understand professional ethics in scientific practice
Identify the core ethical principles in science and recognise ethical dilemmas
Define the requirements for working safely in a science laboratory
Practice:
What is the difference between personal and professional ethics?
List the 6 core ethical principles in Science.
Explain why plagiarism is an ethical breach.
Provide examples of PPE worn in the laboratory.
What are the four categories of safety signs?
Which equipment should you use when you work with dangerous chemicals?
Which equipment should you use when you work with dangerous microorganisms?
Laboratories are classified into how many Physical Containment (PC) levels?
Which equipment is typically used to dispose of biological wastes at high temperature and pressure?
Why is laboratory safety essential?
Ethics
Set of moral principles that govern an activity - responsibilities and rights.
Personal vs Professional Ethics
Personal
Learn in everyday life
Not formally recorded
Professional
Learn in workplace
Formally written down to govern unique situations
Similarities
Honesty
Integrity
Respect
Responsibility
Differences
Personal ethics = individual core values + behaviour in aspects of life
Professional ethics = specific guidelines + principles that govern conduct within particular profession
Core Ethical Principles in Science
Honesty - Report data truthfully. Do not fabricate data. Acknowledge limitations.
Integrity - Act with sincerity. Honour agreements
Accountability - Follow institutional and governmental policies and regulations.
Respect - Colleagues, human and animal subjects, the environment (sustainability)
Confidentiality - Protect private information and not disclose to unauthorised parties.
Beneficence - act for the benefit of others, promoting their wellbeing
Ethics in research
Australian code for the responsible conduct of research
Principles of responsible research conduct:
• Honesty, Rigour, Transparency, Fairness, Respect, Recognition, Accountability, Promotion.
Responsibilities of institutions
Responsibilities of researchers
Ethics in Human
National statement on ethical conduct in human research
Values and principles of ethical conduct
Conditions for consent
Ethical issues in recruitment of research participants who may experience increased risk
Research governance and ethics review
Common Ethical Issues
Data fabrication
Violates honest
Wastes resources
Potential harm to society
Plagiarism
Violates intellectual honesty
Disrespects other's work
Misleads public
Conflicts of interest
Violates transparency
Undermines fairness
Disrespects colleagues
Coerced consent
Violates beneficence
Invalidates consent
Erodes trust in research
Misuse of forensic evidence
Violates scientific integrity
Compromises justice
Laboratory Safety
Laboratory Safety
Set of rules, procedures, and practives designed to protect people, property and environment in laboratory setting.
Applies to students, teachers, researchers, technicians
Personal safety
Chemical and biological safety
Equipment safety
Emergency procedures
Behavioural expectations
Training
Personal Safety
Wear personal protective equipment (PPE)
Lab coats - Do NOT wear lab coats outside laboratory
Gloves
Goggles (safety glasses)
Closed-toe shoes
Long hair must be tied back
Laboratory Hazards


Safety Signs
Prohibitory signs
Warning signs
Mandatory signs
Emergency escape and first aid signs

Chemical Hazards
Global harmonised system (GHS) hazard pictohrams for chemical labelling
Found on
Chemical containers
Labels
Safety Data Sheets (SDS)

Working with Dangerous Chemicals
Use a fume hood
Reduces exposure to hazardous fumes
Provides a barrier of protection against uncontrolled reactions
Working with Infectious Microorganisms
Use a biological safety cabinet
Laboratories are classified into physical containment (PC) levels
AKA biosafety levels (BSLs)
Four levels - PC1/2/3/4

Waste Disposal
It is important to dispose of chemical and biological wastes properly
Protect the environment (sustainability)
Chemical wastes are disposed in proper waste containers
According to safety data sheet
Biological wastes are typically autoclaved
High temperature and high pressure
Some biological wastes are incinerated
Emergency Procedures
Know locations of eyewash, safety shower, fire extinguisher, first aid kits, exits
Follow institution’s emergency plan
Contact appropriate emergency services
Laboratory staff will guide you in case of emergency
Laboratory Safety is Essential
Prevents - injuries, exposure, contamination
Protect - expensive and sensitive equipment
Maintain - reliable and valid scientific results
Comply - legal and institutional safety regulations
Monitoring Ethics and Safety
Each institution has specific committees that monitor ethics and safety.
Committees at MU:
Human Ethics Committee
Animal Ethics Committee
Institutional BioSafety Committee
Safety in Research and Teaching Committee
Quantitative literacy
Objectives
Understand decimal places, significant fugures and scientific notation
Be able to convet units
Be able to perform dilution calculations
Be able to perform calculations for specific laboratory techniques including
Serial dilution
Viable counts
Microscope magnification
Be able to differentiate between accuracy and precision
Be able to calculate percentage error in measurement
Be able to differentiate between sensitivity and specificity of a diagnostic test
Definition
Ability to understand, interpret, communicate numbers/mathematical information to:
Solve problems
Make informed decisions
Important in:
Research
Medical treatments
Diagnostic tests
Forensic tests
Math
Decimal Places
Position digits to right of decimal point
Two decimal places means two digits to the right of decimal point
Significant Figures
What:
Figures or digits required for certain accuracy level
Starts from first non-zero digit
Number written to three significant figures will have maximum of three non-zero digits
Rules:
Non-zero digits are significant
Zeros between non-zero digits are significant
Zeros to the right of a decimal point are significant
Zeros to the left of the first non-zero digit are not significant
Zeros at the end of a whole number (i.e. no decimal point) may or may not be significant
Round to SF
Identify last SF
If next digit is 5 or greater, +1 to last SF
If next digit less than 5, leave last SF as is
Scientific Notation
Consider 0.000000234
To 2 dp = 0.00
To 3 SF = 0.000000234
Too long to write
→ 2.34 × 10^-7
Units of Measurement
Important when quanitifying measurements
Measuring ‘a time of 20’ has non meaning without its unit
A time of 20 secs
A time of 20 mins
A time of 20 hrs
We MUST report units of measurement
All units have a symbol
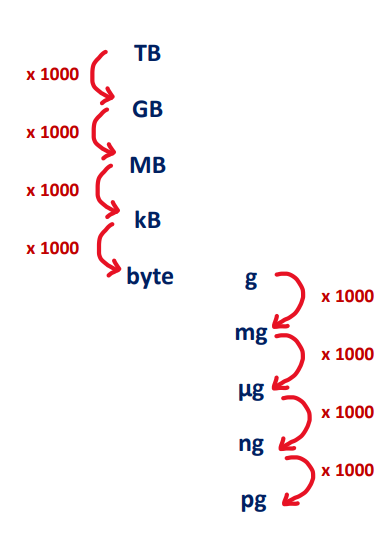
Conversion of units

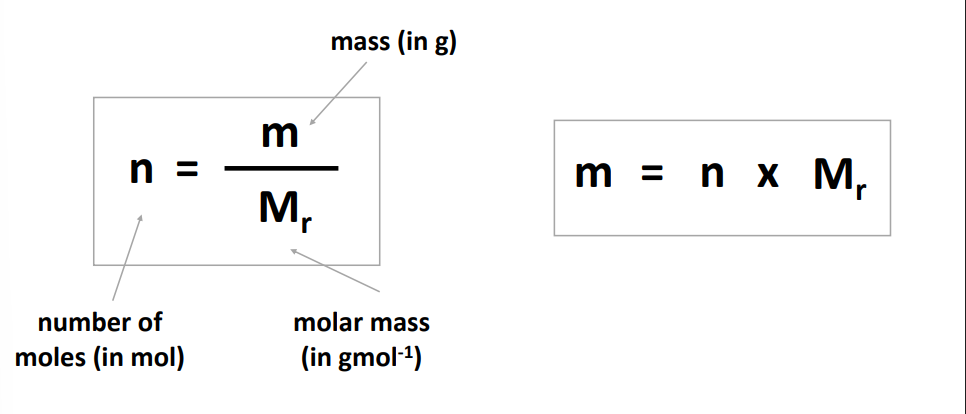
Moles to Mass
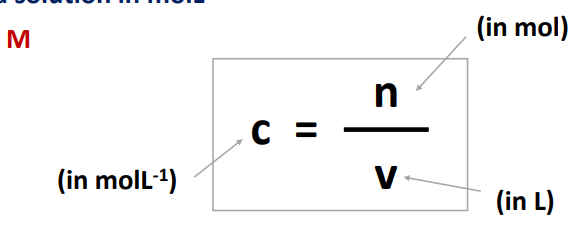
Molarity
Solute + solvent = solution
Measure of number of moles of solute per unit volume of solution
Molarity = concentration of solution in molL^-1
molL^-1 can also be written as M
1 molL^-1 = 1 M
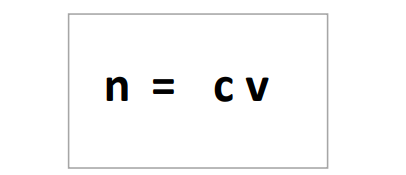
Dilutions and Concentration

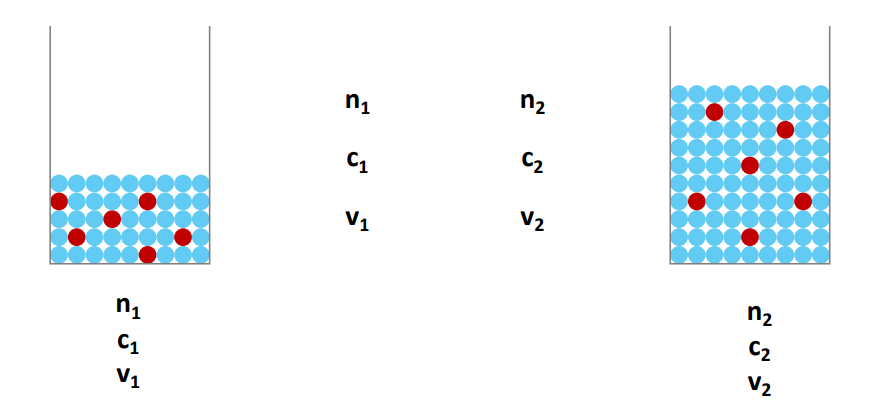

Dilution questions:
What is the final concentration of Reagent X when 200 µL of water is added to 50 µL of 10 mM Reagent X.
What volume of 10 M glucose solution must be used to make a 250 mL solution of 50 mM glucose solution?
Serial Dilutions:


Concentration of Solutions
Mole per unit volume (aka molarity) – in molL-1 or M
Mass per unit volume – in gL-1
Percentage weight by volume – % (w/v)
Percentage volume by volume – % (v/v) • Parts per million – in ppm
Parts per billion – in ppb
Viable Counts Calculation
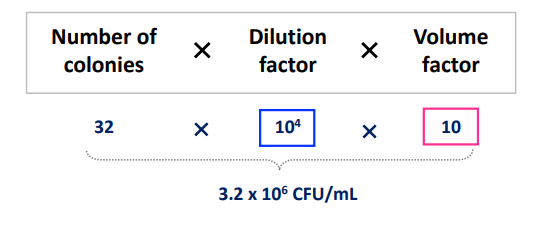
To calculate the concentration of viable bacteria
Each living bacterial cell forms a colony on agar plates
Concentration can be calculated in CFU/mL
CFU = colony-forming units

To calculate concentration of bacteria (in CFU/mL) in the original suspension, use formula:

Magnification on Microscope

Accuracy vs Precision + Errors
Accuracy
Closeness to true/accepted value
Precision
Reproducibility of measurements (closeness to one another)

Errors
Measured as percentage errors
Errors provide information about accuracy of measurement
High % error = low accuracy
Low % error = high accuracy
Diagnostic Test accuracy
True positive = sick person diagnosed sick
False positive = healthy person diagnosed sick
True negative = healthy person not diagnosed sick
False negative = sick person not diagnosed sick

Sensitivity vs Specificity
Sensitivity
Ability to correctly identify true positives

Specificity
Ability to correctly identify true negatives

Example
PCR is golden standard for diagnosing COVID-19
New lateral flow test for c19 is currenly on the market table below shoes performance compared to PCR

Prac Q:
Calculate the sensitivity and specificity of the new lateral flow test
Spectrophotometry
Objectives
Explain principles of spectrophotometric analysis
Identify main features of spectrophotometer + describe how absorbance is measured
Define Beer-Lambert law + explain how it is used to determine concentration of substances in solution
Use
Used by scientists for qualitative and quantitative analysis of substances
Clinical diagnostics
Concentration of clinical markers
Haemoglobin
Glucose
Cholesterol
Molecular research
Concentration of DNA and RNA
Concentration of cellular protein extracts
Biochemistry research
Measure enzymatic activity over time
Principles
Measures intensity of light absorbed by substance in solution
Spectro
Latin - specere - to look at, appearance
Photo
Greek - phos - light
Metry
Greek - metron - to measure
Different substances absorb different wavelengths of light
Electromagnetic Radiation (Light)
Light (EMR)
Form of energy
Made of photons
Energy of one photon is
Directly proportional to frequency (f)
Inversely proportional to wavelength (λ)
7 types of EMR (most to least energetic)
Radio waves
Microwaves
Infrared
Visible light
Ultraviolet
X-rays
Gamma rays
Reading Down the List (Radio → Gamma): Wavelength decreases, while frequency and energy increase.
Reading Up the List (Gamma → Radio): Wavelength increases, while frequency and energy decrease.
(Short wavelength = more energy)
Visible Light
White light has seven colours (ROYGBIV)
Colour depends on energy/frequency/wavelength

Colour of a Solution
All substances contain molecules + electrons that absorb, transmit and reflect certain wavelengths of light
Colour visible represents the reflected light

Absorption Spectrum
Shows which wavelengths of light is absorbed by a substance
Colours absorbed are the colours we do NOT see

Measured using spectrophotometer
SP was set at 400 nm, 401 nm, 402 nm…to 700 nm - recorded absorbance
Spectrophotometer
What?
A spectrophotometer passes monochromatic light through a solution and measures its absorbance
Monochromatic light = one specific wavelength of light (e.g. 600 nm)
Absorbance = measure of amount of light absorbed
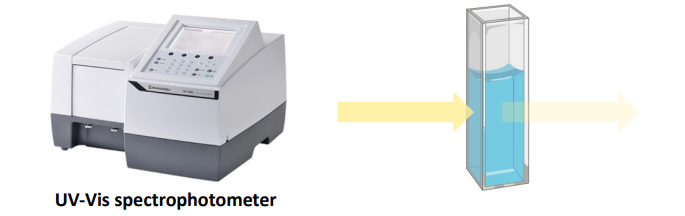
Which wavelengths are absorbed = substance identity
How much light is absorbed = substance quantity
Put solution in cuvette
Open the top hatch on SP and place cuvette inside
On SP press measure after selecting wavelength
SP shines light on cuvette
Some light gets absorbed by solution in cuvette
There will be lower intensity of light passing the cuvette
Which wavelengths are absorbed = substance identity,
How much light is absorbed = substance quantity
Components + Process + Calculations
SP is built up w two parts
Spectromenter
Photometer

White light (or other light - depends on type of SP) passes through collimator
Collimator concentrates light in one direction through monochromator
Monochromator splits the light into each of its colours (different wavelengths)
The wavelengths selectively pass the wavelength selector - the selector slit has a hole to allow which wavelength to pass
After wavelength selection, it passes the sample solution (cuvette). It is usually less intense than I0
Passing light will hit the detector (photocell) and convert it to an absorbance value


t = intensity of transmitted light
0 = intensity of incident light
Transmittance = fraction of incident light transmitted
E.g.
If 90% of light is transmitted, transmittance is 0.9
If solution absorbed 20% of incident light, transmittance is 0.8
Transmittance is always value - amount absorbed


Identifying a Substance
Measure absorbance at different wavelengths
400-700nm, 25nm intervals
Plot absorbance vs wavelength
wavelength = independent variable (x-axis)
absorbance = dependent variable (y-axis)
Compare to known absorption spectra

Beer-Lambert Law

E = constant physical property of analyte
To find E, we can find graph absorbance vs concentration

Determining Concentration

Example Prac:

Standard curve shows absorbance of solutions containing different amounts of analyte P.
Question: give absorbance of solution containing analyte P is 0.70, what is the concentration of analyte P in this solution?
Applications of Spectrophotometry
Determine concentratin of nucleic acids (DNA and RNA)
Both DNA and RNA have a high absorbance at 260m, (UV light)
Determine purity of DNA, RNA, and proteins
A260/A280 is used
Enzyme kinetics
By measuring the concentration of a coloured product over time
Practice Qs
Which colour of light has the longer wavelength – red or green?
What is the meaning of ‘monochromatic’?
How do we calculate Absorbance?
When can we use the Beer-Lambert Law to determine concentration?
What is the wavelength of light at which DNA absorbs maximally?
What is the wavelength of light at which RNA absorbs maximally?
What is the wavelength of light at which proteins absorb maximally?
Agarose Gel Electrophoresis
Objectives
Explain principles of agarose gel electrophoresis
Describe how agarose gel electrophoresis separates DNA Fragments
Outline steps of gel preparation, loading and running
Interpret agarose results
What?
A technique which uses electricity ti separate nucleic acids and proteins based on their size and charge
Relies on properties of charged particles
Unlike charges attract/like charges repel

Charge of DNA
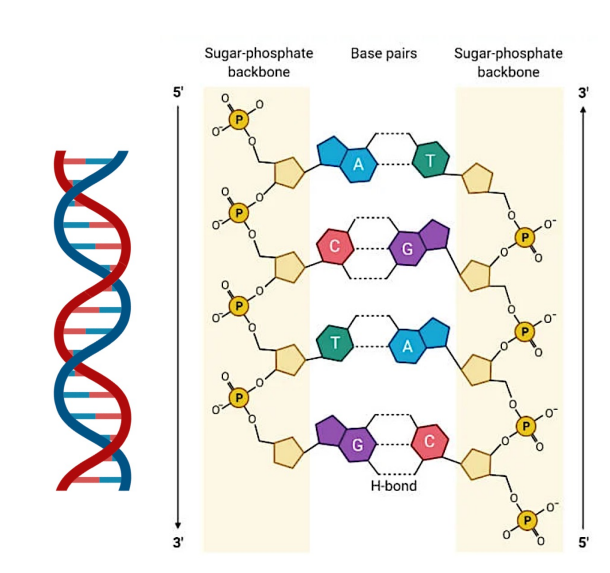
DNA:
Double helix
Direction (5’ to 3’)
DNA made of:
Nitrogenous bases (ATCG)
Deoxyribose sugar
Phosphate backbone
DNA affected by electric field
Due to DNA molecules having same mass to charge ratio
DNA movement depends on size only


Agarose
Linear polymer (polysaccharide) obtained from red algae
Agarose obtained as white powder
Agarose powerder dissolves in near-boiling TAE buffer
TAE = tris-acetate EDTA
Forms a gel when cooled
Gel contains pores


TAE Buffer
Tris-acetate-EDTA - used as solvent
Contains ions to conduct electricity during electrophoresis
Buffer = maintains constant pH
Usually pH 8.3
Can be purchased as 50x TAE
Must dilute using water to 1X TAE before use
1 in 50 dilution
100 mL of 50X TAE in a final volume of 5L
Concentration of Agarose Gel
Given as % (w/v) = mass of agarose in 100 mL of 1X TAE buffer
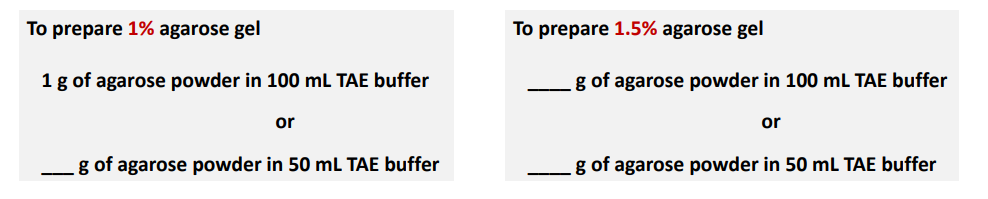
Pore size depends on agarose concentration
Higher = thick gel = smaller pores = separate shorter DNA fragments
Lower = thin gel = larger pores = separate larger DNA fragments
Preparing Agarose Gel
Weigh agarose powder
Add to 1x TAE buffer
Heat to dissolve (in microwave)
Cool and add DNA stain
Ethidium bromide (EtBr) or SYBR green
Allows DNA to be visible
Pour into mold with comb
ALlow gel to set (30-45)
Remove comb to create wells

Preparing and Loading DNA samples
Preparation:
Mix DNA samples with loading dye
LD contains glycerol allowing DNA to sink to bottom of well
LD contains dye allowing monitoring of the run
Mix DNA ladder (DNA marker) with loading dye
DNA ladder contains different DNA
fragments of known sizes (=standard curve)
Loading:
Place gel in gel tank in correct orientation
DNA samples closer to black (-) electrode
Add 1x TAE buffer until gel is immersed
Load DNA ladder in first well
Load each DNA sample in a separate well
Running and Visualising Gel
Running:
Connect electrodes to a power supply
Allow gel to run at 80-100V for 40-60 minutes
DNA will migrate towards positive electrode (anode)
Visualising:
UV light or blue light required
Use transilluminator
DNA stain (in gel) binds to DNA and fluoresces
DNA appears as bright bands