module 7 plant competition
Module 7: Plant Competition 2024
Objectives & Purpose:
Students will briefly review photosynthesis to better understand the precise resources plants require for survival, growth, and reproduction. After gaining an understanding of these requirements, students will be introduced to the concepts of intraspecific competition and interspecific competition and/or allelopathy as they relate to plants, with the ultimate goal of being able to experimentally differentiate between the two phenomena. Taking into consideration what they learned from designing their own, smaller-scale experiments in Module 6: Human Physiology, students will practice using the major steps of the scientific method to plan, execute, and analyze a guided experiment on plant intraspecific competition and interspecific competition/allelopathy using a larger, whole-class data set. Leveraging skills gained in previous modules on experimental design, statistical analyses, and technical writing, students will write the second and final lab report of the semester on these Module 7 experiments. Ultimately, this module allows students not only to gain further experience in experimental design, but also to practice & refine the skills necessary for communicating their science with a broader audience of their peers (fellow scientists!). Students would be wise to review experimental design and technical writing modules (Modules 5 & 6), as well as skim Chapters 10, & 35-37 in the Campbell Biology Urry et al. 2021 textbook on plants to best prepare.
Introduction:
To review some concepts introduced back in Module 4, remember that plants are eukaryotes that photosynthesize using chlorophylls a and b. While other eukaryotic organisms such as brown and red algae, and many protists carry out photosynthesis too, they are not plants. Why? These organisms use chlorophyll c in place of b, and have a different photosynthetic pathway. Additionally, all organisms in the kingdom Plantae have cellulose as a major component of their cell walls, and have plastids (membrane-bound organelles found in the cells of plants, algae, and some other eukaryotic organisms which are considered to be intracellular endosymbiotic descendants of cyanobacteria) bound by NO MORE THAN two plasma membranes. All members of the Kingdom Plantae also store food or chemical energy as starch (not fat). “True” land plants have an alternation of generations with a haploid, multicellular gametophyte and a diploid, multicellular sporophyte stage. Module 7 focuses exclusively on the physiological processes of and ecological interactions among the most diverse and arguably most successful clade of terrestrial plants alive today, the Angiosperms. Students are encouraged to review the Module 4 handout if they need a refresher on the adaptations of the flowering plants.
Table 1. Nutritional strategies (often called nutritional modes) of living things, listing the source of energy and carbon molecules to fuel an organism’s metabolism. While most eukaryotic species are only capable of one of these strategies, many prokaryotic organisms are considered “mixotrophs” because they can switch among strategies depending on the environment they find themselves in.
Nutritional Strategy | Carbon Source | Energy Source | Example Organisms |
|---|---|---|---|
Chemoautotrophy | Inorganic carbon | Chemical gradients | Extremophile Prokaryotes (like those found in deep sea volcanic vents) |
Photoautotrophy | Inorganic carbon | Sunlight | Green Plants, Brown & Red Algae, some Protists (like Euglena), many Prokaryotes (like Cyanobacteria) |
Chemoheterotrophy | Organic carbon | Organic molecules | Virtually all Animals and Fungi, many Protists, many Prokaryotes |
Photoheterotrophy | Organic carbon | Sunlight | Purple non-sulfur bacteria, Heliobacteria, some insects (Vespa orientalis, some aphids). |
Photosynthesis:
Virtually all angiosperms are photoautotrophs, meaning they generate their own chemical energy (in the form of glucose) using a source of inorganic carbon molecules stripped from carbon dioxide gas in the atmosphere. This complicated metabolic process is powered via the energy of sunlight, hence the “photo” as a prefix in “photoautotroph.” See table 1 above above for a full list of nutritional strategies employed by other organisms we have been studying this semester.
While photosynthesis is actually a series of metabolic processes consisting of numerous intermediate molecules and catalysts, we can simplify the overarching chemical reaction to the following equation in figure 1 below for the purposes of this course:
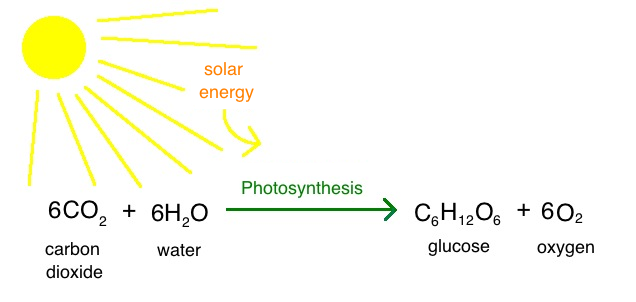
Figure 1. The vastly simplified chemical equation for photosynthesis. Students interested in the full chemical process, divided between the light reactions and the dark reactions, are encouraged to enroll in BISC 1111 next semester (Image credit: Khan Academy).
Given photosynthesis REQUIRES carbon dioxide, water, and sunlight, what structures (via their functions) allow for a plant to successfully undergo this metabolic process? The chloroplasts in the leaves of angiosperms are the primary sites of photosynthesis; however, literally all “green” pigmented plant tissues are at least slight contributors to photosynthesis because the green coloration is due to the presence of chlorophyll in the tissues. Looking closely at the chemical equation, you can see gas exchange plays a key role in a plant’s ability to photosynthesize. To this end, angiosperm leaves have stomata (singular: stoma… some literature will use stomate and stomates which mean the same thing), which are pores found in the epidermis of leaves, stems, and other organs that controls the rate of gas exchange (Figure X below). These openings allow the chloroplasts in the cells’ interior to constantly be provisioned with carbon dioxide, and allows for the waste of photosynthesis (oxygen) to exit from the leaf interior.
The problem with stomates, however, is that water vapor can also move out of the plant when the stomates are open. Remember, terrestrial plants have an enormous number of adaptations to PREVENT water loss (review Module 4), largely because water is necessary for all the plant’s metabolic reactions, not just photosynthesis. The leaf is covered on both sides by an epidermis and a waxy cuticle, which act to minimize water loss. The stomates are like tiny pores in the cuticle that open and close in response to cues from the environment. The pore itself is surrounded by two specialized cells called guard cells that are attached to each other at both ends. The shape of the guard cells is determined by their osmotic pressure or water content. When they are full of water, the guard cells swell and open the pore. A loss of water, in turn, causes the guard cells to become flaccid and thereby closing the opening of the stomata, preventing further water loss and carbon dioxide entry into the plant (figure 2 below). Stomates and their guard cells are scattered throughout the epidermis but in many plants are found only on the lower surface of the leaf.
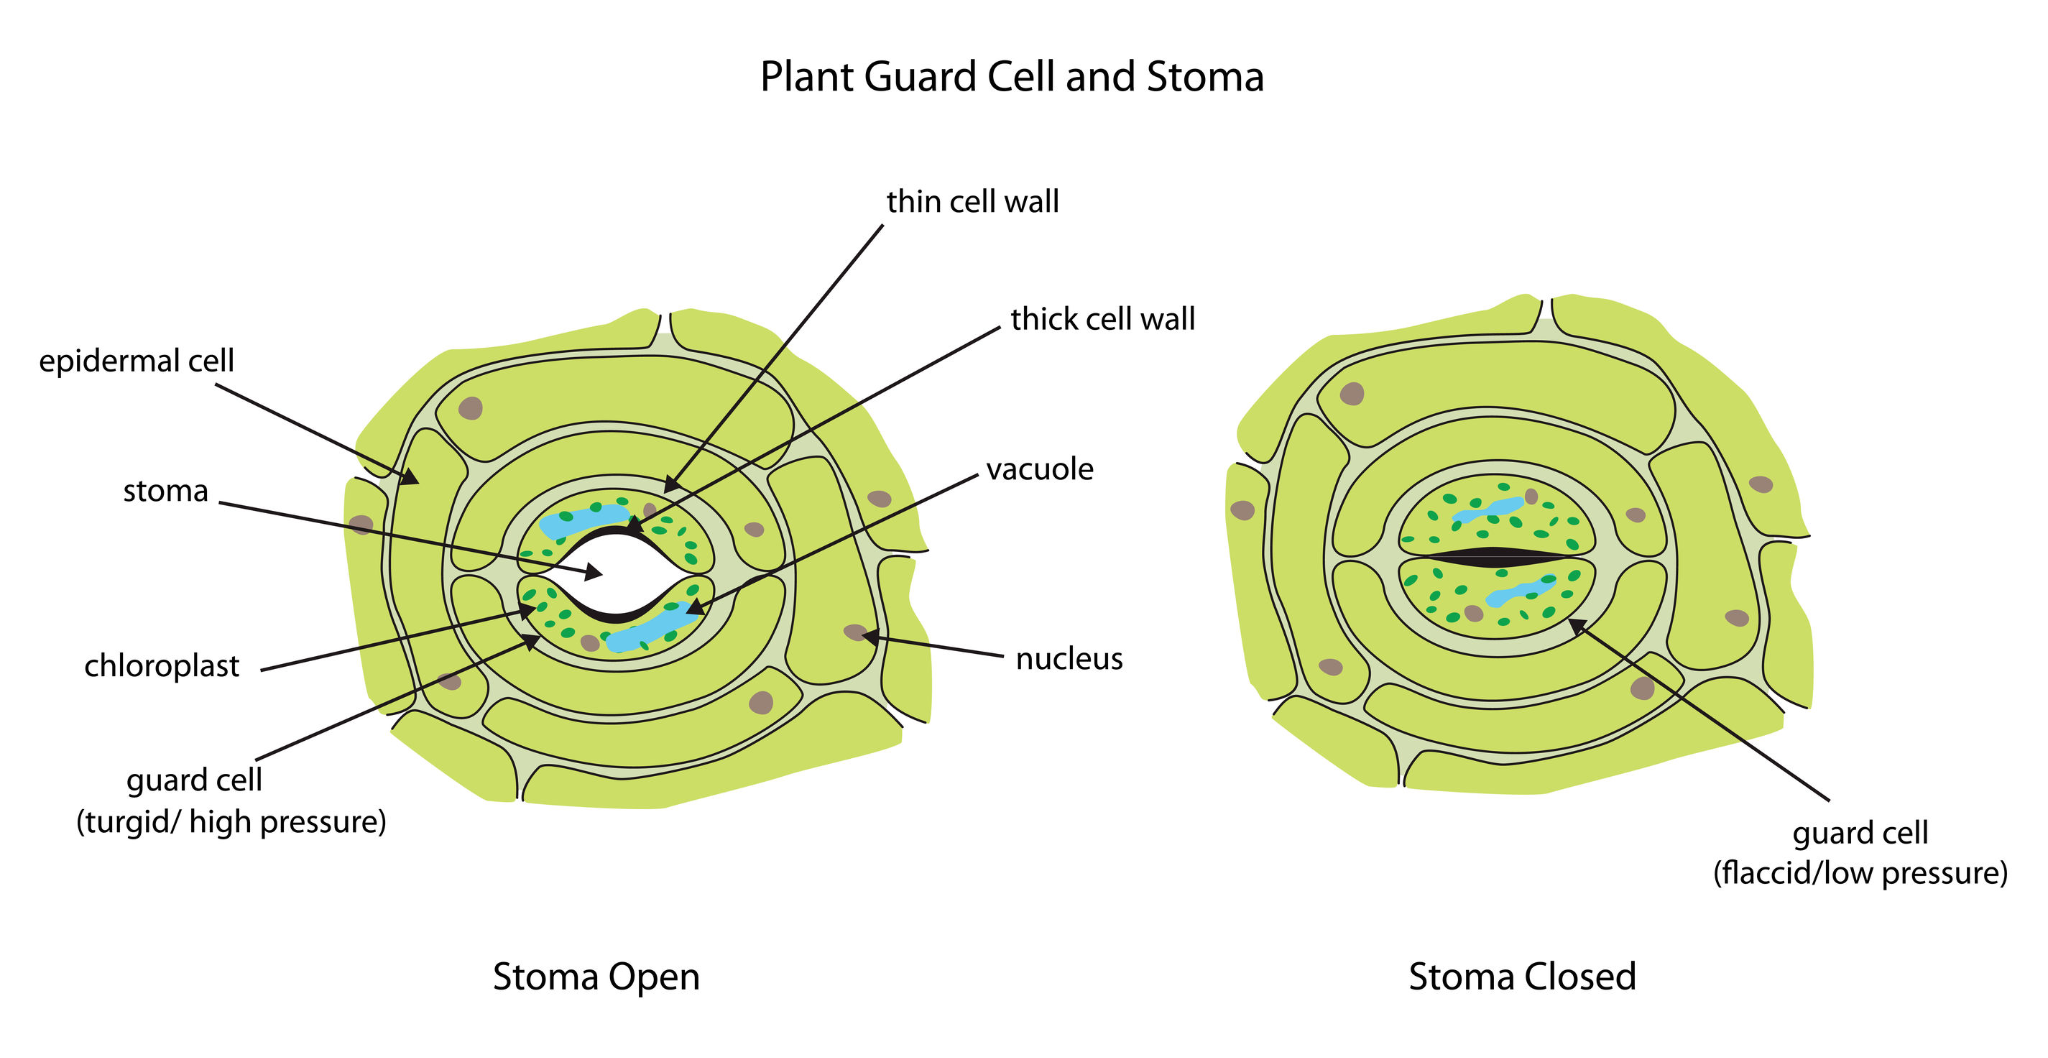
Figure 2. Labeled cartoon schematic of a stoma in the open and closed state. Note that when guard cell osmotic pressure is high (the vacuoles are full in the guard cells), the stoma is set in the open position allowing gasses in and out. When the osmotic pressure in the guard cells is low (the vacuoles are flaccid in the guard cells), the stoma is set in the closed position and gasses cannot freely enter and exit the cell interior (Image credit: Science Learning Hub).
To connect the processes above to some of the plant tissue structures we learned about in Module 4, know that photosynthesis occurs primarily in the mesophyll of leaves, the layer just under the epidermis. It consists of two layers of parenchyma cells, the palisade mesophyll (closely packed cells that do most of the photosynthesis) and the spongy mesophyll (meshwork of cells with many air spaces for the movement of air in and out of the leaf). The sugars produced in the mesophyll move to the rest of the plant through the phloem, part of a bundle of vascular tissue called a vein. Remember, the xylem in the vein transports minerals and water from the roots to the leaves for photosynthesis. See figure 3 below for a labeled diagram of these tissues to orient yourself in the leaf.
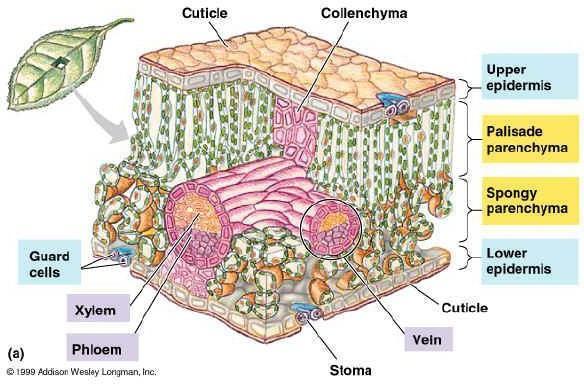
Figure 3. Labeled cartoon diagram of a typical angiosperm leaf in cross section. Note the arrangement of the structures and consider how form dictates and enhances metabolic function as it pertains to photosynthesis.
Competition for Resources:
Competition is an ecological interaction between organisms in which both require a resource (like food, water, habitat, etc…) that is in limited supply. By definition, all forms of competition lower the fitness, or reproductive success, of both organisms involved since the presence of one organism always reduces available resources for the other. This is one of the four main ecological interactions covered in BISC 1112, but for the sake of simplicity Module 7 limits the discussion to competition.
When members of the same species require a resource in short supply, each of them may affect the amount of resource available to the other, perhaps even impacting each other’s biological fitness. This is called intraspecific competition, often resulting in a leveling-off of the population growth curve. On the other hand, when populations of different species compete for a resource in short supply, this is called interspecific competition, which results in negative consequences for both species. While these terms sound confusingly similar, just remember that the United Nations is an INTERnational organization that facilitates cooperation among DIFFERENT nation-states (just as INTERspecific competition occurs between DIFFERENT species). The degree of the availability of the various required resources determines the carrying capacity, and ultimately the maximum population size of each species in a given environment.
Whether between species or within a species, there are three major mechanisms of competition: interference, exploitation, and apparent competition (in order from most direct to least direct). Interference and exploitation competition are often referred to as "real" forms of competition, while apparent competition is not, because organisms do not share a resource, but instead share a predator. We will address apparent competition on another day, but for now let's take a deeper look at the “real” forms of competition.
During interference competition organisms interact directly by fighting for scarce resources; this is why interference competition is often called “contest competition” since the ‘winner’ gets the resources as a sort of prize. A hypothetical animal example of interference competition might be when you and your siblings are physically fighting over the last pancake at the breakfast table. In nature animals fight with one another over resources all the time, like when male bulls fight over female cows (intraspecific), or when lions and hyenas fight over a freshly killed zebra carcass (interspecific).
During exploitation competition, both organisms are using a common limited resource. Instead of physically fighting over it, exploitative competition occurs when resource use by one organism depletes the total amount available for other organisms. These organisms might never interact directly but compete by responding to changes in resource levels. Oftentimes, this phenomenon is referred to as ‘scramble competition’ because the organism that hustles to the resource and monopolizes it most quickly is advantaged. To continue with our earlier example, exploitation competition would be if your parents/guardians made ten pancakes for five total siblings, and breakfast was served on a first-come-first-serve basis. The sibling that wakes up earliest and monopolizes the stack of pancakes is advantaged… the last sibling would arrive at an empty table, never having directly interacted with the others. Very obvious examples of this in nature include a diurnal (day-active) monkey species and a nocturnal (night-active) monkey species that share the same limited food resources, or a plant that indirectly competes with neighboring plants for light, nutrients, and space for root growth.
Interspecific Resource Competition or Allelopathy?:
Since plants are sessile organisms literally rooted to one spot their entire adult lives, plants primarily engage in exploitation competition for the limited resources of nutrients & water in soil, and for sunlight. Such competition could easily be interspecific or intraspecific, depending on species composition of the habitat. Think about it: if two plants are growing right next to each other, there is a finite amount of soil nutrients (like nitrogen, phosphorus, etc…) for each of them to have. In terms of sunlight, the one that grows taller or grows leaves with a larger surface area likely has the ability to monopolize more sunlight throughout the day while “shading out” its competitor.
While plants do not “fight” for resources in the same way animals do, interspecific, interference competition with their most direct neighbors through allelopathy (the production of biochemicals) is relatively common. Two competing species may gain an advantage by negatively influencing the growth of the competitor by adding harmful biomolecules, called allelochemicals, to the environment (harmful to the competitor but not to itself). Allelochemicals are considered secondary metabolites and are not used in the various primary metabolic processes; i.e. secondary metabolites are produced in addition to all the required primary metabolites (such as the ones found in photosynthesis or cell respiration). Often these chemicals are used for defensive purposes or for allelopathic effects.
It can be incredibly difficult to experimentally distinguish allelopathy from resource competition in nature. While allelopathy is generally caused by the addition of a harmful chemical agent to the environment, the negative consequences of exploitative competition emerge from the removal of essential nutrients, sunlight, or water from the immediate environment. Oftentimes, both mechanisms can act simultaneously; the greater the plant diversity in a given community, the more complex the interactions between allelopathy and exploitative competition are likely to be. Moreover, some allelochemicals may function by reducing the bioavailability of nutrients to competitors! Further confounding the issue, the production of allelochemicals can itself be affected by environmental factors such as nutrient availability in the soil, ambient temperature of the environment and pH of the main water source or substrate.
Allelopathic effects are often also difficult to determine in nature because it was found that allelochemicals do not always act directly on the competing plant species but rather indirectly on mutualistic species associated with the competitor. For example, it is thought that the invasive garlic mustard (Alliaria petiolata) non-native to North American temperate forests, is secreting allelochemicals that negatively affect the mutualistic mycorrhizae of native trees, thus weakening their root growth and allowing garlic mustard plants to grow better than their competitors. In brief, mycorrhizae are mutualistic associations of fungi and vascular plant roots wherein the photosynthetic plant supplies organic compounds like sugar to the fungus, and the fungus supplies the plant with water and inorganic nutrients (such as phosphorus or nitrogen) absorbed from the soil. Fossil and genetic evidence suggests this mutualistic relationship is over 400 million years old, and is likely in part responsible for plants invading terrestrial environments in the first place.
Protocols:
Students will complete one of two protocols addressing the overall question “Do competitive interactions affect survival and growth in plants?” Each group of students will be entirely responsible for collecting their own data and taking care of their own plants. However, each group will also be responsible for adding the data they collect to the class spreadsheet shared by your lab instructor, in order for each student to write their own INDIVIDUAL lab report using the ENTIRE CLASS data set addressing BOTH sets of specific experimental questions and hypotheses at the end of this two week long experiment. This is going to require effort, coordination, commitment, and planning on the part of all members. Students who fail to be team players WILL have points deducted from their lab report. This is ultimately an exercise in executing multiple steps of the scientific method, but also in the “soft” skills of experimental science which always includes collaboration and using extensive data sets to answer complex and multifaceted questions.
Overarching Experimental Question: Do competitive interactions affect survival and growth in plants?
Specific Experimental Questions: 1) How does intraspecific competition (density of seeds grown together) affect plant germination speed, vegetative growth rate, and survival chance in [choose radish, sunflower, or marigolds]?
2) How does interspecific competition and/or allelopathy (species identity of seeds grown together) affect plant germination speed, vegetative growth, and survival chance in [2 chosen plant species]?
Hypotheses: 1)H0- Density of seeds per growth pellet will have no effect on mean plant germination speed, no effect on mean plant vegetative growth rate, and no effect on percentage chance of survival in [single plant species].
1)HA- Density of seeds per growth pellet will have an effect on mean plant germination speed, will have an effect on mean plant vegetative growth rate, and will have an effect on percentage chance of survival in [single plant species].
2)H0- Species identity of seeds growing together in the same growth pellet will have no effect on mean plant germination speed, no effect on mean plant vegetative growth rate, and no effect on percentage chance of survival in [any two plant species].
2)HA- Species identity of seeds growing together in the same growth pellet will have an effect on mean plant germination speed, will have an effect on mean plant vegetative growth rate, and will have an effect on percentage chance of survival in [any two plant species].
- Form a group of four total students. There needs to be six groups per class, so in labs with fewer than 24 students there will be a few smaller groups. Groups should not be composed entirely of commuter students because watering outside of class time is REQUIRED for this lab.
- Groups 1-3 will be assigned to prepare the Intraspecific Competition Protocol & Groups 4-6 to prepare the Interspecific Competition / Allelopathy Protocol. HOWEVER, each student will be responsible for using the WHOLE CLASS data set to address BOTH experimental questions and associated hypotheses in their individual lab reports. The lab instructor will provide a link to a shared class data sheet in Google drive where each group will make their final data entries in a timely & orderly manner by the 15th day after planting. Failure to do so will result in responsible groups having 10% taken off their final lab report grade for each day late.
- The class will collectively decide which two plant species they will be using for their experiments. RECORD the identity of species 1 and species 2 in your lab notebook.
- EACH GROUP will discuss & adhere to a daily watering and data collection schedule. Waterings, observations, and measurements MUST BE daily (except for Sundays when the building is locked). Any gap in the data will cause that group to lose points on their lab report.
- Five points EXTRA CREDIT will be awarded to groups for which ALL growth pellets have successful germination of at least one seed AND have all of those plants survive for the duration of the two week experiment AND enter their data into the shared class data sheet by the 15th day after planting. Individuals in groups that fail to meet this bare minimum standard will not be eligible for extra credit on this lab report.
- To maintain optimal temperature and humidity conditions, each growth tray comes with a clear plastic lid which must be placed on top of the growth tray until Professor Manubay removes them from the growth chamber room. Failure to replace the lid after each watering / measurement activity before this time will result in skewed results at best and death of the seedlings at worst (forfeiting extra credit opportunity for everyone).
- READ the homework section at the end of this handout and PLAN with your group prior to leaving today! In your lab notebook, WRITE OUT a daily watering and data collection schedule including all of your group mates. Commitment to this schedule is paramount, so plan accordingly.
- Lab instructors will thoroughly label their growth trays with section numbers, and label the “front” end and the “back” end in order for students to orient their pellets on the tray and in the schematic.
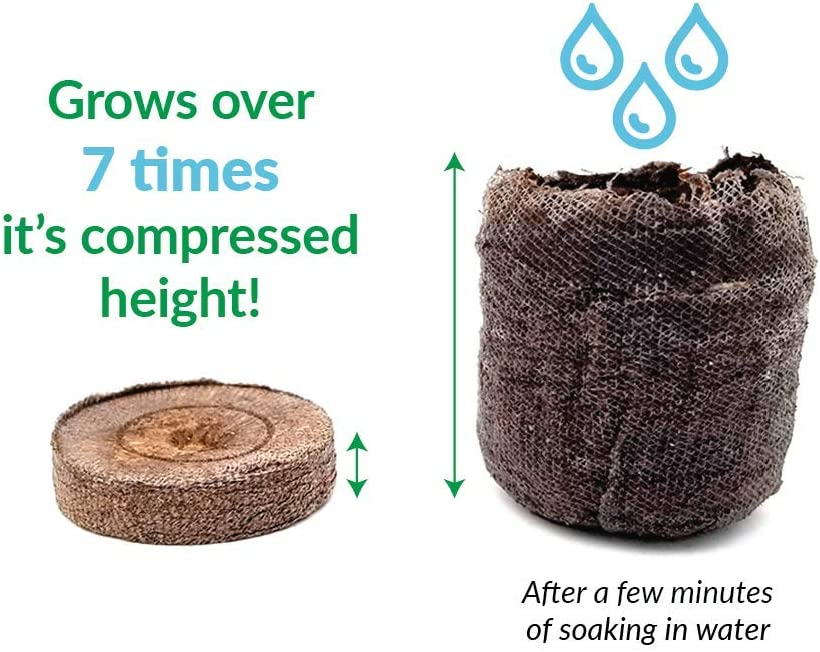
Figure 4. Image of the sphagnum moss growth pellets used in this experiment, in both dehydrated and rehydrated form. Exact soaking time to achieve hydration will depend on ambient conditions, so students MAY need to adjust soak time to achieve right hand image standards.
A. Intraspecific Competition Protocol:
- Each class will begin by soaking their thirty six total growth pellets in approximately ~1 inch of DI water in the provided growth tray for 3 minutes (or until fully hydrated). Your GTA maThe pellet is composed of dead sphagnum moss tissues (a bryophyte!) and should expand to roughly 7x its original volume as it absorbs water.
- Note that the pellet has a side with a perforated circle in the mesh containing the growth medium. This is the TOP of the pellet and, once you remove the circle of mesh, is where you will plant your seeds. You may have to gently tease apart the mesh to widen the area where you will plant your seeds in the growth medium. Note that as the pellet expands, there is a seam in the mesh which you can use to orient yourself and organize your seeds. For example, you might note that you planted a row of sunflower seeds on the side of the pellet with the seam and a row of radish seeds opposite of the seam.
- Carefully arrange each soaked growth pellet into the growth tray provided. Students MUST record in their lab notebook schematic which pellets they prepared. The information on the schematic MUST include the assigned pellet number, the group number, the lab section number, AND the contents of the pellet (seed type and number).
- Students MUST take notes and/or draw a schematic diagram in their lab notebook denoting the exact placement of their seeds within each pellet and the physical location of their six pellets, because erroneously watering/measuring the wrong ones in the coming weeks will render your data unusable. Consider, when a different person comes in each day to care for the plants, how else can you be certain you and your team members are measuring the same seedling in your shared data tables UNLESS you all have the exact same understanding of seed placement and identity within the pellet?
- Take your rehydrated pellets back to your lab bench using a dissecting tray to transport them. You will work in this dissecting tray to plant your seeds as directed below.
- Use the table below to determine exactly how each of your pellets will be prepared:
Pellet 1 | 2 seeds (species 1) |
|---|---|
Pellet 2 | 2 seeds (species 2) |
Pellet 3 | 4 seeds (species 1) |
Pellet 4 | 4 seeds (species 2) |
Pellet 5 | 6 seeds (species 1) |
Pellet 6 | 6 seeds (species 2) |
- When placing seeds in the rehydrated growth pellets, students should attempt to spread them as evenly as possible. To prepare the pellet for seeding, poke a number of small (< half centimeter deep) holes in the topsoil with the tip of a pencil or pen equal to the number of seeds being put in the pellet. EACH SEED should have its own hole!
- Use the tip of a pencil or pen to close the hole once the seed is inside, to bury it and prevent desiccation.
- Once ALL groups have planted ALL seeds in all their growth pellets, and schematics have been drawn/notes taken on precise placement, the lab instructor will lead the entire class into Bell Hall 201. The lab instructor will place the cover on the tray and place the whole growth tray under a grow lamp, making sure EVERY student knows exactly which tray is theirs and where to find materials in Bell Hall 201.
- Pellets MUST be watered with 3mL DI water EVERY day (except weekends). Use the provided 3mL transfer pipettes in Bell Hall 201 to accomplish this.
- During these daily waterings, students should be writing observations in their lab notebook (and share those with their group), recording the 1st day they see germination in EACH seed in EACH growth pellet, and once germination has commenced, taking DAILY height measurements of EACH seedling in EACH growth pellet with the provided rulers (in millimeters).
- After these daily watering and measurement activities, students are responsible for placing the clear plastic covering back over the growth tray, to maintain the greenhouse effect, which keeps the seedlings in optimal temperature and humidity conditions. Failure to do so will result in slowed growth and/or death of the seedlings, skewing results and forfeiting opportunity for extra credit.
B. Interspecific Competition / Allelopathy Protocol:
- Each class will begin by soaking their thirty six total growth pellets in approximately ~1 inch of DI water in the provided growth tray for 3 minutes (or until fully hydrated). The pellet is composed of dead sphagnum moss tissues (a bryophyte!) and should expand to roughly 7x its original volume as it absorbs water.
- Note that the pellet has a side with a perforated circle in the mesh containing the growth medium. This is the TOP of the pellet and, once you remove the circle of mesh, is where you will plant your seeds. You may have to gently tease apart the mesh to widen the area where you will plant your seeds in the growth medium. Note that as the pellet expands, there is a seam in the mesh which you can use to orient yourself and organize your seeds. For example, you might note that you planted a row of sunflower seeds on the side of the pellet with the seam and a row of radish seeds opposite of the seam.
- Carefully arrange each soaked growth pellet into the growth tray provided. Students MUST record in their lab notebook schematic which pellets they prepared. The information on the schematic MUST include the assigned pellet number, the group number, the lab section number, AND the contents of the pellet (seed types and numbers).
- Students MUST take notes and/or draw a schematic diagram in their lab notebook denoting the exact placement of their seeds within each pellet and the physical location of their six pellets, because erroneously watering/measuring the wrong ones in the coming weeks will render your data unusable. Consider, when a different person comes in each day to care for the plants, how else can you be certain you and your team members are measuring the same seedling in your shared data tables UNLESS you all have the exact same understanding of seed placement and identity within the pellet.
- Take your rehydrated pellets back to your lab bench using a dissecting tray to transport them. You will work in this dissecting tray to plant your seeds as directed below.
- Use the table below to determine exactly how each of your pellets will be prepared:
Pellet 1 | 1 seed (species 1) & 1 seed (species 2) |
|---|---|
Pellet 2 | 1 seed (species 1) & 1 seed (species 2) |
Pellet 3 | 2 seed (species 1) & 2 seed (species 2) |
Pellet 4 | 2 seeds (species 1) & 2 seeds (species 2) |
Pellet 5 | 3 seeds (species 1) & 3 seeds (species 2) |
Pellet 6 | 3 seeds (species 1) & 3 seeds (species 2) |
- When placing seeds in the rehydrated growth pellets, students should attempt to spread them as evenly as possible. To prepare the pellet for seeding, poke a number of small (< half centimeter deep) holes in the topsoil with the tip of a pencil or pen equal to the number of seeds being put in the pellet. EACH SEED should have its own hole!
- Use the tip of a pencil or pen to close the hole once the seed is inside, to bury it and prevent desiccation.
- Once ALL groups have planted ALL seeds in all their growth pellets, and schematics have been drawn/notes taken on precise placement, the lab instructor will lead the entire class into Bell Hall 201. The lab instructor will place the cover on the tray and place the whole growth tray under a grow lamp, making sure EVERY student knows exactly which tray is theirs and where to find materials in Bell Hall 201.
- Pellets MUST be watered with 3mL DI water EVERY day (except weekends). Use the provided 3mL transfer pipettes in Bell Hall 201 to accomplish this.
- During these daily waterings, students should be writing observations in their lab notebook (and share those with their group), recording the 1st day they see germination in EACH seed in EACH growth pellet, and once germination has commenced, taking DAILY height measurements of EACH seedling in EACH growth pellet with the provided rulers (in millimeters).
- After these daily watering and measurement activities, students are responsible for placing the clear plastic covering back over the growth tray, to maintain the greenhouse effect, which keeps the seedlings in optimal temperature and humidity conditions. Failure to do so will result in slowed growth and/or death of the seedlings, skewing results and forfeiting opportunity for extra credit.
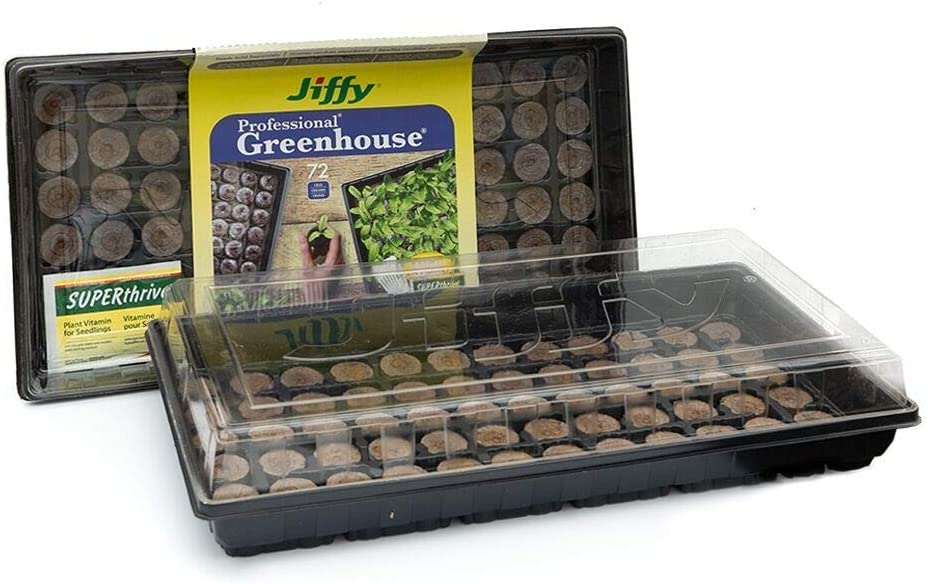
Figure 5. Image shows the dehydrated growth pellets placed in their growing trays. Note how the clear plastic lid fits over the growth tray, creating a greenhouse like microhabitat with optimum temperature and humidity conditions for seedling growth (once water is added). Students MUST replace the clear plastic lid on the tray after each bout of watering or measuring to maintain these conditions until Dr. Manubay removes it at his discretion!
Clean-Up:
- Wipe down all lab surfaces (especially ones dirt from the growth pellets has accumulated) with ethanol using paper towels.
- Place prepared growth trays in Bell Hall 201 under a growth lamp, ensuring that your class’s tray is fully and clearly labeled with tape (Section number and a “front,” “back, “left, and “right” designation).
- Throw all used paper towels into the normal garbage.
- Return and neatly organize all equipment to the student benches.
- Push in all chairs before you are dismissed.
Homework: Watering and Data Collection
See the “Assignments” tab on Blackboard for the specific due date, format, and more information on writing up this Module’s lab report. The lab report will be due the week of April 14th at the start of YOUR LAB SECTION. Data collection should be completed daily for two weeks (14 days) after planting. The only day of the week where data collection is not required is Sunday because the building is closed to students; however, students have swipe access on Saturday during business hours. Someone from your group must volunteer to water and measure on Saturdays.
Groups are responsible for entering the requested data into the shared class data sheet by day 15 after planting. For each day late the data is not entered into the class spreadsheet, that GROUP will have a 10% penalty applied to their lab report. Please pay attention to Blackboard announcements from your lab instructor on the off chance that data collection period needs to be extended.
Keeping track of your data can be a challenge with these long term experiments. That is why it is absolutely vital to discuss, plan, and RECORD that plan with your group PRIOR to leaving the lab today the exact schedule of watering, observations, and data collection. Wrapped into this conversation should be how and in what format you will be sharing data with one another & in what medium. The easiest way to share the data each individual person is recording in their lab notebook every day is to simply set up a shared Google document for observations/notes. The easiest way to share seed germination data, seedling height data, and seedling survival data is to make a single Google sheets page shared between your group members. These shared documents are DISTINCT FROM the shared class Google Sheet where your group will be entering your finalized, curated data to share with the class for everyone’s lab reports.
Table 2. Below is an example of how students might schedule their watering and measuring duties with their group members. Make a table like this in your lab notebooks and ADHERE to the schedule. If you are sick and can’t take your assigned day, communicate with your group to coordinate a replacement. “Ex.” in the table means for example.
Day (since planting) | Date | Responsible Group Member |
|---|---|---|
0 (planting day) | Calendar date (ex. 03/19/2023) | Group member name (ex. Aidan Manubay) |
1 | 03/20/2022 | ex. Karen Walker |
2 | …and so on… | …and so on… |
3 | ||
4 | ||
5 | ||
6 | ||
7 | ||
8 | ||
9 | ||
10 | ||
11 | ||
12 | ||
13 | ||
14 |
Table 3. Below is an example of how students might construct a table in their lab notebooks and in a shared Google Sheet to measure “days to germination” metric for the INTRAspecific competition protocol. ASK YOURSELVES, how would this table be arranged differently for the INTERspecific competition protocol? “Ex.” in the table means for example.
Growth Pellet # | Seed Species Identity | Seed # | Days to Germination |
|---|---|---|---|
1 | ex. radish | 1 | # days to germinate |
1 | ex. radish | 2 | ex. 5 days |
2 | ex. sunflower | 1 | ex. 6 days |
2 | ex. sunflower | 2 | … |
3 | ex. radish | 1 | |
3 | ex. radish | 2 | |
3 | ex. radish | 3 | |
3 | ex. radish | 4 | |
4 | ex. sunflower | 1 | |
4 | ex. sunflower | 2 | |
4 | ex. sunflower | 3 | |
4 | ex. sunflower | 4 | |
5 | ex. radish | 1 | |
5 | ex. radish | 2 | |
5 | ex. radish | 3 | |
5 | ex. radish | 4 | |
5 | ex. radish | 5 | |
5 | ex. radish | 6 | |
6 | ex. sunflower | 1 | |
6 | ex. sunflower | 2 | |
6 | ex. sunflower | 3 | |
6 | ex. sunflower | 4 | |
6 | ex. sunflower | 5 | |
6 | ex. sunflower | 6 |
Table 4. Below is an example of how students might construct a table in their lab notebooks and in a shared Google Sheet to measure “height of seedling” metric for the INTERspecific competition protocol. ASK YOURSELVES, how would this table be arranged differently for the INTRAspecific competition protocol? “Ex.” in the table means for example. “...” is an ellipsis that represents separate height measurement columns for days 2-6 and days 8-13 respectively.
Growth Pellet # | Seed Species Identity | Seed # | Height (mm) Day 0 (planting day) | Height (mm) Day 1 | … | Height (mm) Day 7 | … | Height (mm) Day 14 |
|---|---|---|---|---|---|---|---|---|
1 | ex. radish | 1 | ex. 0 | ex. 0 | … | ex. 2 | … | ex. 7 |
1 | ex. sunflower | 2 | ex. 0 | ex. 0 | … | ex. 1.5 | … | ex. 8.5 |
2 | ex. radish | 1 | ||||||
2 | ex. sunflower | 2 | ||||||
3 | ex. radish | 1 | ||||||
3 | ex. radish | 2 | ||||||
3 | ex. sunflower | 3 | ||||||
3 | ex. sunflower | 4 | ||||||
4 | ex. radish | 1 | ||||||
4 | ex. radish | 2 | ||||||
4 | ex. sunflower | 3 | ||||||
4 | ex. sunflower | 4 | ||||||
5 | ex. radish | 1 | ||||||
5 | ex. radish | 2 | ||||||
5 | ex. radish | 3 | ||||||
5 | ex. sunflower | 4 | ||||||
5 | ex. sunflower | 5 | ||||||
5 | ex. sunflower | 6 | ||||||
6 | ex. radish | 1 | ||||||
6 | ex. radish | 2 | ||||||
6 | ex. radish | 3 | ||||||
6 | ex. sunflower | 4 | ||||||
6 | ex. sunflower | 5 | ||||||
6 | ex. sunflower | 6 |
Calculating Metrics to Add to the Class Shared Google Sheet & Applicable Stat Tests for Lab Reports:
- How to calculate average germination speed per pellet -
- Intraspecific competition protocol: sum the number of days to germination for each seed in a single pellet, then divide by the number of seeds in the pellet. Intraspecific competition pellet 6 example: (days to germinate of seed 1 + days to germinate of seed 2 + days to germinate of seed 3 + days to germinate of seed 4 + days to germinate of seed 5 + days to germinate of seed 6)/ total number of seeds = average days to germination in pellet 6. Using mock data → (6 + 4 + 7 + 5 + 4 + 5) / 6 seeds = 5.16 days to germination on average in pellet 6 of the intraspecific competition treatment.
- Interspecific competition protocol: this differs from the intraspecific competition protocol example in that students must calculate the average germination speed for EACH SPECIES in each pellet separately and report those values separately on the class spreadsheet. Interspecific competition pellet 3 example using mock data: (days to germinate of sunflower seed 1 + days to germinate of sunflower seed 2) / (total number of sunflower seeds) = average days to germination of sunflowers in pellet 3. With mock numbers: (5 + 7)/(2) = 6 days for average sunflower germination in pellet 3. To calculate this value for the other species, (days to germinate of radish seed 1 + days to germinate of radish seed 2) / (total number of radish seeds) = average days to germination of radishes in pellet 3. With mock numbers: (4 + 6)/(2) = 5 days for average radish germination in pellet 3.
- Since the class is dealing with means of data sets here, the applicable statistical test here (in the tool kit for this class at least) would be a series of t-tests to address your hypothesis regarding average germination speed among treatments. Brainstorm with your group: what type of t-test would be appropriate here (review lecture for Module 6 if stuck)? What subsets of the data would you be comparing to address the specific hypotheses surrounding BOTH intraspecific and interspecific hypotheses?
- How to calculate average vegetative growth rate per pellet -
- Intraspecific competition protocol: determine how many days the plant was actually growing vegetative structures (shoots, stems, & leaves) by subtracting days to germination from the total days of measurement (should be 14 days for everyone) for EACH seed in EACH pellet. This number is the total number of days the seedling was growing vegetative structures in your experiment. Then, take the final height measurement in mm of EACH seedling in EACH pellet and divide those heights by that seedlings’ total days of vegetative growth. Finally, average those values by summing them together and dividing by the total number of seedlings, which is the average vegetative growth rate of all seedlings in a single pellet. Intraspecific competition pellet 4 example using mock data: you’ve determined the four seeds in this pellet have 7, 8, 6, and 9 days of vegetative growth respectively AND that the final height in mm of each of these seeds is 9.5, 10. 5.5, and 12 respectively. Mean vegetative growth rate in mm/day in pellet 4 is then ((9.5mm / 7 days)+(10mm / 8 days)+(5.5mm / 6 days)+(12mm / 9 days))/ 4 total seedlings) = 1.21 mm per day of growth.
- Interspecific competition protocol: this differs from the intraspecific competition protocol example in that students must calculate the average vegetative growth rate for EACH SPECIES in each pellet separately and report those values separately on the class spreadsheet. Determine how many days each plant was actually growing vegetative structures (shoots, stems, & leaves) by subtracting days to germination from the total days of measurement (should be 14 days for everyone) for EACH seed of EACH species in EACH pellet. This number is the total number of days the seedling was growing vegetative structures in your experiment. Then, take the final height measurement in mm of EACH seedling of EACH species in EACH pellet and divide those heights by that seedlings’ total days of vegetative growth. Finally, average those values of EACH SPECIES by summing them together and dividing by the total number of seedlings of EACH SPECIES, which is the average vegetative growth rate of all seedlings of each species in a single pellet. Interspecific competition pellet 1 example using mock data: you’ve determined the single radish seedling in pellet 1 and the single sunflower seedling in pellet 1 have 7 and 9 days of vegetative growth respectively. You’ve determined the final height of the radish seedling to be 12mm and the final height of the sunflower seedling to be 7 mm. Vegetative growth rate in mm/day for pellet 1 radish is (12mm)/(7days) = 1.71 mm per day, and vegetative growth rate in mm/day for pellet 1 sunflower is (7mm)/(9days) = 0.78 mm per day.
- Since the class is dealing with means of data sets here, the applicable statistical test here (in the tool kit for this class at least) would be a series of t-tests to address your hypothesis regarding growth rates among treatments. Brainstorm with your group: what type of t-test would be appropriate here (review lecture for Module 6 if stuck)? What subsets of the data would you be comparing to address the specific hypotheses surrounding BOTH intraspecific and interspecific hypotheses?
- How to calculate percent survival per pellet -
- Intraspecific competition protocol: the number of seedlings alive per growth pellet at the end of the experiment divided by the number of seeds that were planted in that pellet times one hundred. Intraspecific competition pellet 2 example using mock data: two seeds were planted but only one survived to the end of the experiment so (½) x (100) = 50% survival rate of seeds in pellet 2.
- Interspecific competition protocol: this differs from the intraspecific competition protocol example in that students must calculate the percent survival for EACH SPECIES in each pellet separately and report those values separately on the class spreadsheet. The fundamental calculation is the same, with the number of seedlings of one species alive per growth pellet at the end of the experiment divided by the number of seeds OF THAT SPECIES that were planted in that pellet times one hundred. Interspecific competition pellet 4 example using mock data: two radish seeds planted AND two marigold seeds planted in pellet 4, with only one of each species surviving to the end of the data collection period. So (1 surviving radish seedling/ 2 total radish seeds planted) x (100) = 50% survival of radish seedlings AND (1 surviving marigold seedling/ 2 total marigold seeds planted) x (100) = 50% survival of marigold seedlings in pellet 4.
- Since you are all going to take care of these plants to the best of your ability, we might naturally expect 100% survival of seeds in each pellet. If it is the case that we have that expected value, and we are working with proportional data, a series of Chi Square tests would be appropriate for this metric. Brainstorm with your group: what type of Chi Square tests would be appropriate here (review lecture for Module 6 if stuck)? What subsets of the data would you be comparing to address the specific hypotheses surrounding BOTH intraspecific and interspecific hypotheses?