Data Analysis
Data Analysis
Introduction to Data Analysis
Data analysis is the process of inspecting, cleaning, transforming, and modeling data to discover useful information, draw conclusions, and support decision-making.
In 8th grade, students are introduced to basic concepts and techniques of data analysis.
Collecting Data
Data can be collected through surveys, experiments, observations, or existing sources.
Students learn to identify the population, sample, and variables in a data set.
They understand the importance of collecting unbiased and representative data.
Organizing and Summarizing Data
Data can be organized using tables, charts, and graphs.
Students learn to create frequency tables, histograms, bar graphs, and line plots to summarize data.
They interpret measures of central tendency (mean, median, mode) and measures of spread (range, interquartile range).
Analyzing Categorical Data
Categorical data represents characteristics or qualities that cannot be measured numerically.
Students learn to analyze categorical data using frequency tables, bar graphs, and pie charts.
They interpret the data to identify patterns, trends, and relationships.
Analyzing Numerical Data
Numerical data represents quantities that can be measured or counted.
Students learn to analyze numerical data using measures of central tendency and measures of spread.
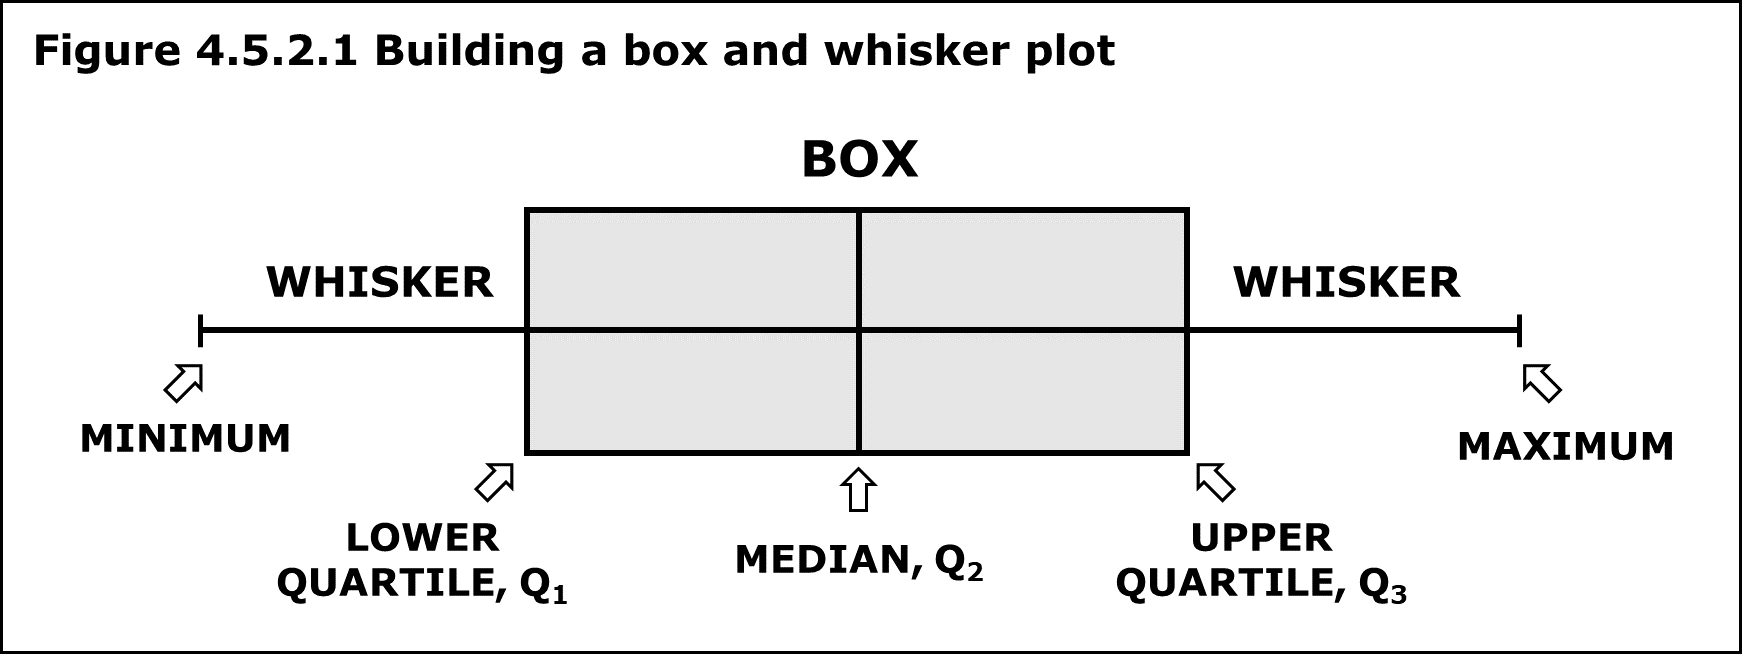
They create and interpret box plots, line plots, and scatter plots to visualize numerical data.
Probability and Statistics
Students are introduced to basic concepts of probability and statistics.
They learn to calculate probabilities of simple and compound events.
They understand the difference between theoretical and experimental probability.
Drawing Conclusions and Making Inferences
Students learn to draw conclusions and make inferences based on data analysis.
They use evidence from the data to support their conclusions.
They understand the limitations and potential biases in data analysis.
Important Phrases and Concepts:
Minimum - the smallest data entry in a data set
Maximum - the largest data entry in a data set
Q1 - the first 25% of data
Q3 - the last 25% of data
Median - the middle point of a data set
Mode - the most commonly occurring number in a data set
Mean - the average of the data set
IQR - the middle 50% of data, found with the formula Q1-Q3
Range - the spread of the data, found with subtracting the minimum from the maximum
Measure of Center - mean, median, and mode
Measure of Spread - range and IQR
Five Number Summary - minimum, Q1, median, Q3, maximum