Lecture 4 - Factorial Designs
Factorial Designs
Introduction to Factorial Designs
Involves two or more independent variables (Factors) impacting one or more dependent variables.
Allows exploration of complex behavior influenced by multiple factors concurrently.
Learning Objectives
Understand the definition and structure of factorial designs.
Identify and interpret main effects and interactions.
Review various types of factorial designs (between-participants, within-participants, mixed).
Conduct statistical analysis relevant to factorial designs.
Structural Components of Factorial Designs
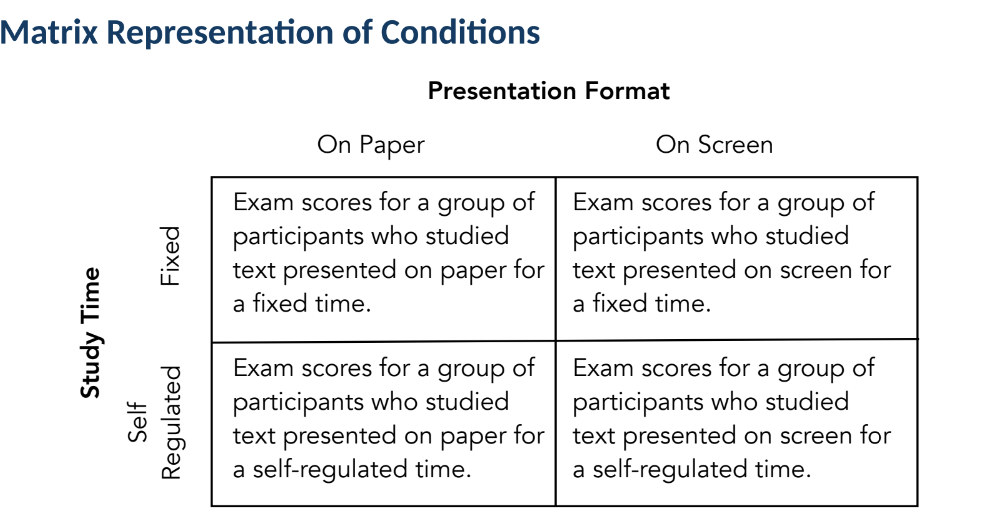
Example Study: Ackerman & Goldsmith (2011)
Factorial design = when something has more than one independent variable
Objective: Analyze how presentation format and study time influence retention. One group had a time limit on revision, and the other group does not
Independent Variables:
Presentation Format: Paper vs. Screen
Study Time: Fixed vs. Self-regulated
Dependent Variable: Exam scores from a multiple-choice test.
Matrix Representation of Conditions
Conditions based on combinations of the two independent variables:
Studying text on paper vs. screen under fixed and self-regulated conditions.
Terminology in Factorial Designs
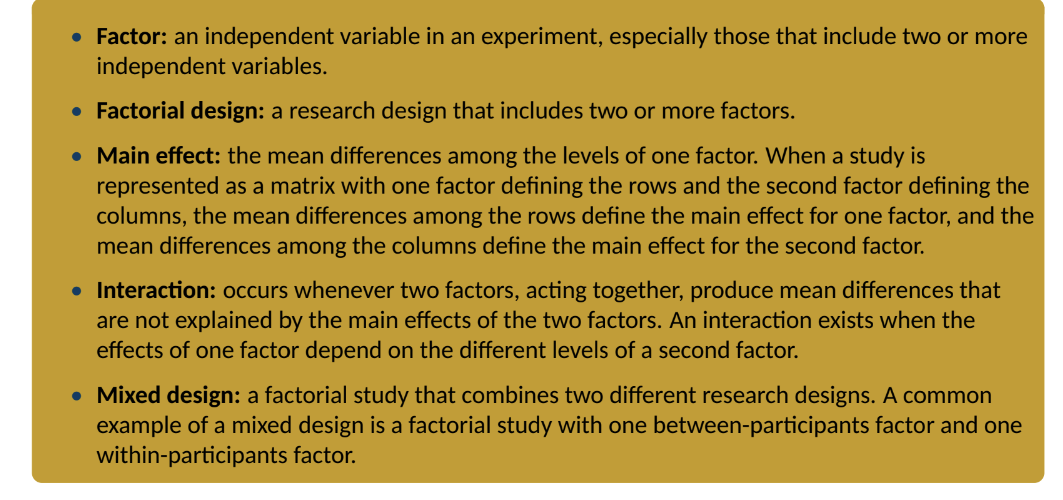
Factor: An independent variable in factorial designs.
Factorial Design: Design incorporating at least two factors.
Types of Designs:
Two-factor Design: Examples include the Ackerman study.
Notation: Described as "2x2" for two factors each with two levels.
Total Treatment Conditions: Determined by multiplying levels of each factor (e.g., 2x3x2 = 12 conditions).
Main Effects and Interactions
Definition of Main Effects
Mean differences for levels within a single factor are termed main effects.
Two-factor designs yield two main effects—each factor's independent impact on the dependent variable.
Represented through matrices: mean differences across rows and columns indicate the main effect for each factor.
A factorial design allows researchers to examine how unique combinations of factors acting together influence behaviour
it generates two sources of information
main effects
interaction between factors
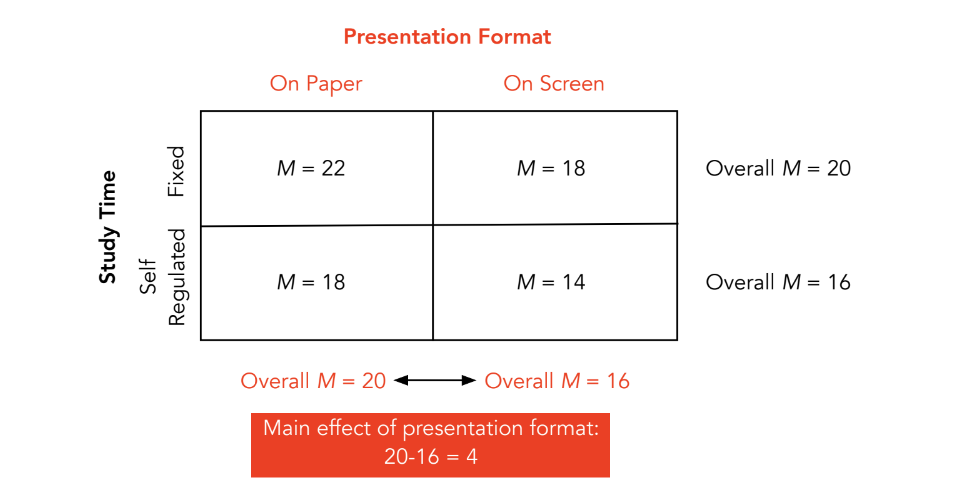
Example Calculations
Given hypothetical scores:
Presentation Format
On Paper
On Screen
Study Time
Fixed
M = 22
M = 18
Self Regulated
M = 18
M = 14
Overall Mean Scores:
On Paper: M = 20
On Screen: M = 16
main effect of presentation format
Main Effects Calculation:
Main effect of presentation format: 20 - 16 = 4;
Main effect of study time: 20 - 16 = 4.
add 22 + 18 / 2
add 18 + 14/2
Understanding Interactions
An interaction occurs when the effect of one factor changes across the levels of another factor.
Without Interaction: Main effects are observed independently of the levels of the second factor.
With Interaction: The influence of one factor is contingent on the level of another factor, reflecting a non-independent relationship.
Identifying Interactions
Data Matrix Comparison:
Mean differences in rows or columns indicate interactions.
Visual Representation:
Line graphs aid in detecting interactions; non-parallel lines suggest interactions between factors.
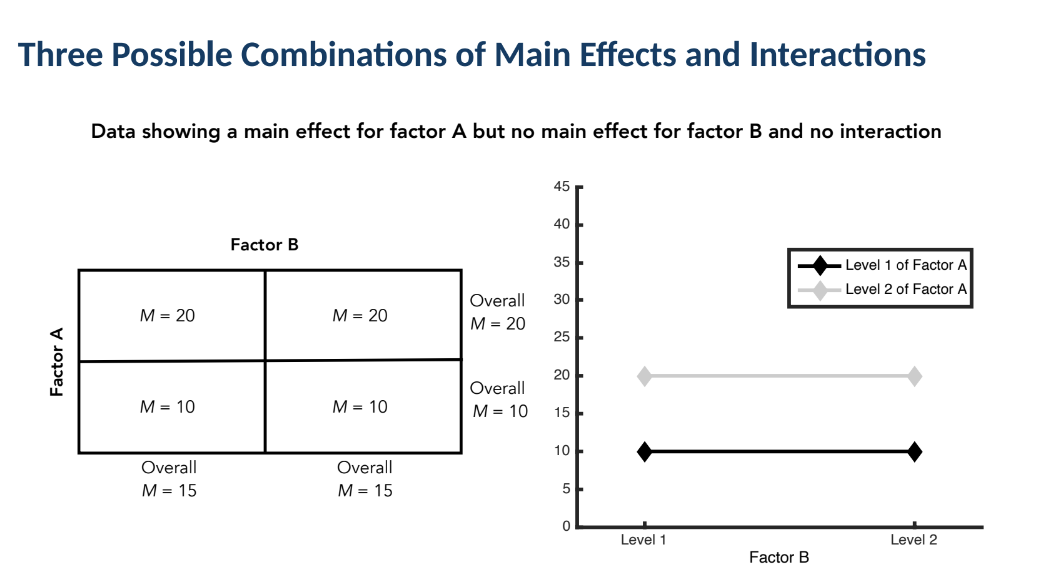
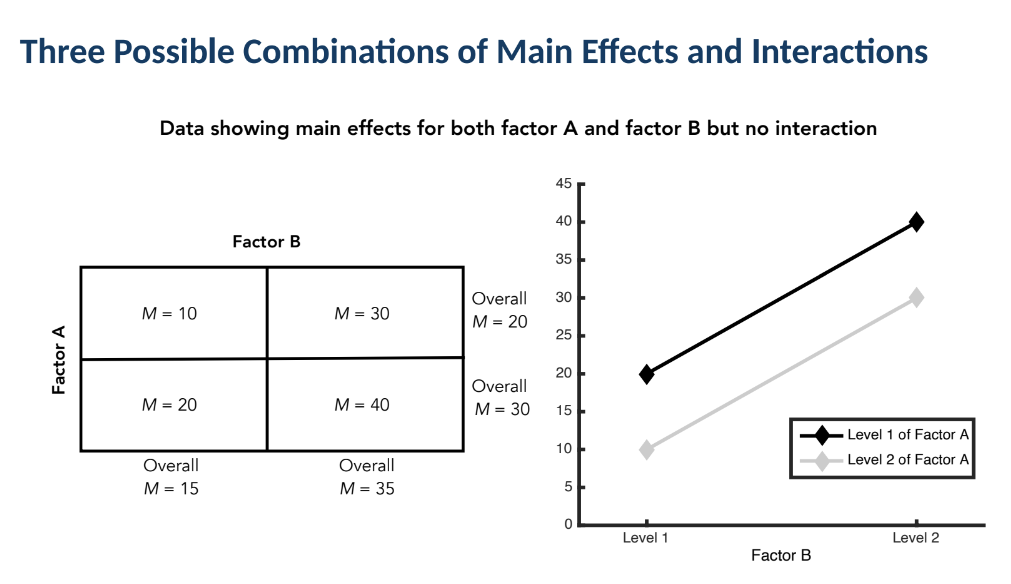
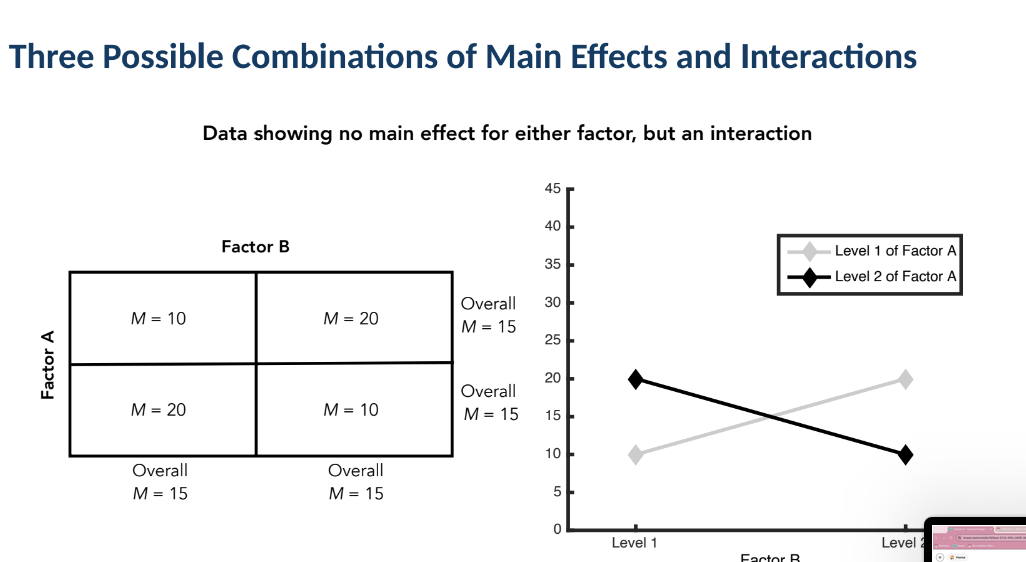
o identify an interaction in a data matrix, we compare the mean differences in anyindividual row (or column) with the mean differences in other rows (or columns)
If the size and direction of differences in one row (or column) are the same as thecorresponding differences in other rows (or columns) there is no interaction
If the differences change from one row (or column) to another, there is evidence ofan interaction
For example, in the data just examined, the two means in the top row are 20 and 20,whereas in the bottom row they are 20 and 12
As the mean difference changes from the top to the bottom row, these data indicatethe presence of an interaction
Typically, it is easier to detect the presence or absence of an interaction by plottingthe data visually as a line graph
For a two-factor study, one factor is chosen as the independent variable to appear onthe horizontal axis
Different lines are then plotted, each representing a different level of the secondindependent variable•
When the results of a two-factor study are graphed, the existence of nonparallellines (lines that cross or converge) is an indication of an interaction between factors
Interpreting main effect and interactions
In a two-factor study, mean differences between columns and between rows describe the main effects; mean differences between cells describe the interaction
However, these mean differences are merely descriptive
They must be evaluated by a statistical test (discussed later) before they can be considered significant
Until the data are analysed by statistical test, you should exert caution interpreting the results of a factorial stud
Even if a statistical analysis reveals significant effects, you must still interpret data cautiously
In particular, if the analysis yields a significant interaction, then the main effects, whether significant or not, may not present an accurate picture of the data
Remember, the main effect for one factor is obtained by averaging all the differences of the second factor
Since each main effect is an average, it may not accurately represent any of the individual effects used to compute that average
Children watching a large amount of educational TV programs get better grades than children watching a small amount
Concluding from the absence of a main effect of viewing habits that TV viewing has no effect on subsequent grades would be highly misleading
Independance of main effect and intercations
A two-factor study allows us to evaluate three separate sets of mean differences:
1. Mean differences from the main effect of factor A
2. Mean differences from the main effect of factor B
3. Mean differences from the interaction between factors
The three sets of mean differences are separate and completely independent
A two-factor study may therefore yield any possible combination of main effects and interaction
Statistical Analysis of Factorial Designs
Conducting ANOVA
Factorial ANOVA: Used to analyze results from factorial designs, assessing main effects and interactions.
Each factor's main effects and interactions are tested separately through hypothesis tests.
Evaluation determines if observed differences are statistically significant.
Types of Factorial Designs
Between-Participants Designs
Involves different participants across treatment conditions; requires a larger sample size.
Confounding variables can increase variance; prone to individual differences.
The advantages and disadvantages of such a design are the same as those highlighted in previous lectures
One disadvantage merits further comment; specifically, between-participants designs require a large number of participants
In factorial designs, this problem is often worsened because a multi-factor study typically has more treatment conditions than a single-factor study
For example, with 30 participants per treatment group a 2 × 4 factorial design has 8treatment conditions and requires a total of 240 (8 × 30) participant
Another disadvantage of between-participants designs is that individual differences can become confounding variables and increase the variance of scores
On the positive side, a between-participants design is not subject to order effects
Such designs are best suited to when lots of participants are available, individualdifferences are small, and order effects are likel
Within-Participants Designs
Same participants across all conditions; reduces individual differences but increases testing fatigue.
The advantages and disadvantages of such a design are the same as those highlighted in previous lectures
A particular disadvantage for a factorial study is the number of treatment conditions a participant must undergo
In a 2 × 4 factorial study, for example, each participant must complete 8 different treatment conditions
This can be time-consuming, introduce testing effects (e.g., fatigue or practice effects), and make it more difficult to counterbalance the design to control for order effects
On the positive side, within-participants designs require fewer participants and reduce problems associated with individual differences
Such designs are best suited to situations in which individual differences are large,and there is little reason to expect order effects to be large and disruptive
Mixed Designs
Combines between- and within-participants factors to balance the advantages and disadvantages of each.
Sometimes the advantages of a between-participants design apply to one factor, whereas the advantages of a within-participants design apply to another factor
For example, one might want to use a within-participants design to take maximum advantage of a small group of participants
However, if one factor is expected to produce large order effects, then a between-participants design should be used for that factor
A mixed design is a factorial design with one between-participants factor and one within-participants factor
Pre- and Post-Test Control Group Designs
Measures treatment effects through comparisons of treatment and control groups before and after interventions.
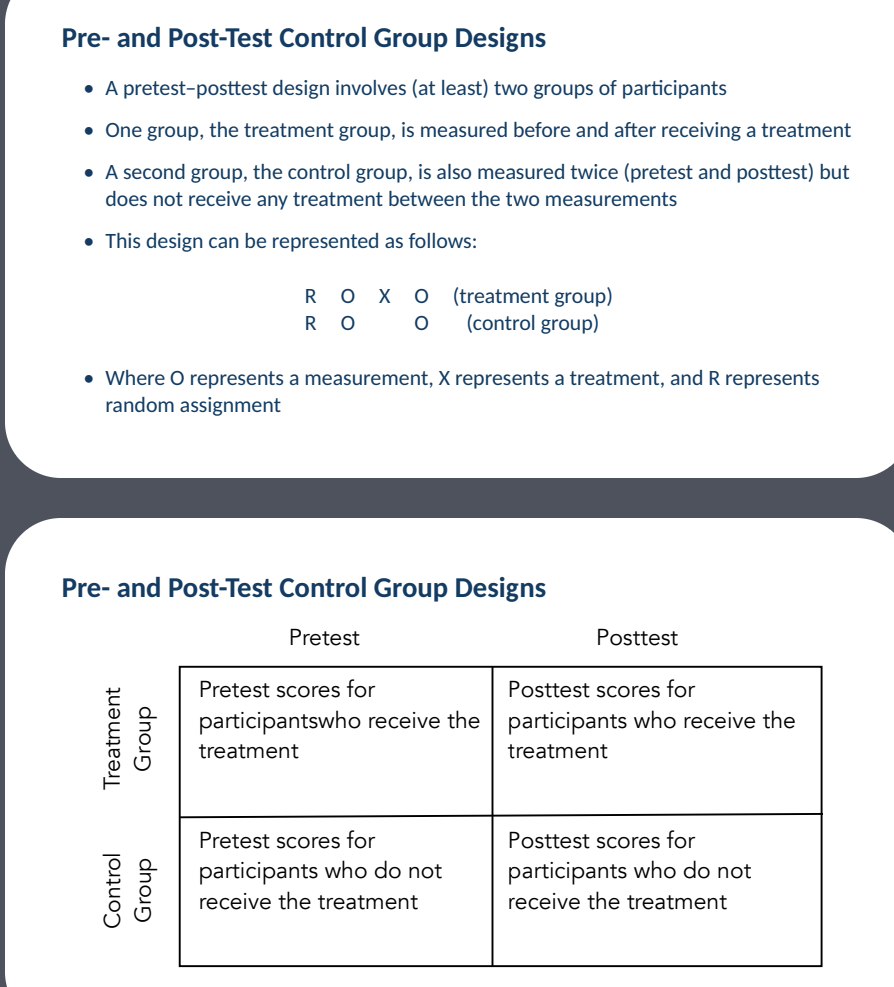
This design is an example of a two-factor mixed design
One factor, treatment/control, is a between-participants factor
The other factor, pretest-posttest, is a within-participants factor
Higher-Order Factorial Designs
Incorporate three or more factors; increase complexity significantly.
Yield more potential interactions, including three-way interactions that are challenging to interpret.
Higher-order factorial designs are those that incorporate three or more factors
Although powerful, such designs introduce additional complexity
For example, a three-factor design has three factors (A, B, & C) and produces threemain effects• It also generates three two-way interactions A × B, B × C, A × C
Additionally, the extra factor introduces the potential for a three-way interaction: A× B × C
two-way interaction, such as A × B, indicates that the effect of factor A depends on the levels of factor B
The A × B × C three-way interaction indicates that the two-way interaction betweenA and B depends on the levels of factor C
A three-way interaction can be a challenge to interpret, especially if there are more than two levels within a factor
It is much harder to interpret a four-way (or higher) interaction• Although it is possible to add factors to a study without limit, studies incorporating more than three factors can yield complex results that are difficult to interpret
Statistical analysis of factorial design
The analysis of a factorial design is undertaken using factorial ANOVA
The version used depends on whether the design is between-participants,within-participants, or mixed
The two-factor ANOVA conducts three separate hypothesis tests:
one to evaluate the main effect of factor A
one to evaluate the main effect of factor B
one to evaluate the interaction
The test uses an F-ratio to determine whether the actual mean differences in the data are significantly larger than expected by chance
Key Terms and Definitions
Factor: An independent variable within a factorial design.
Main Effect: Difference in mean across the levels of a single factor.
Interaction: Unique differences in means that are not explained by main effects.
Mixed Design: Combines both between-participants and within-participants methodologies.