AP Microeconomics - Semester 1
Unit 1: Basics of Economics
Markets
When certain conditions are met, markets will allocate resources efficiently (efficient allocation).
When those conditions fail, markets fail to allocate resources efficiently.
AP Microeconomics Common Thread: Marginal Analysis.
Marginal Analysis (core relationships)
Marginal Benefit = Marginal Cost (MB = MC).
Other common marginal equalities in microeconomics:
MSB = MSC
MRP = MFC
MR = MC
These equalities guide decisions about whether to increase, decrease, or maintain activity levels.
Resource allocation under marginal analysis focuses on incremental changes, not total costs/benefits.
UNIT 1: BASIC ECONOMIC CONCEPTS
Enduring Understanding (CBA-2)
To determine the optimal level at which to pursue an activity whose total benefits exceed total costs, rational economic agents compare marginal benefits and marginal costs.
Learning Objectives (CBA-2):
A. Define the key assumptions of consumer choice theory.
B. Explain how a rational consumer decision-making process uses marginal benefits and marginal costs (with tables/graphs as appropriate).
C. Calculate how rational consumer decision-making uses MB and MC.
Essential Knowledge (CBA-2.A)
A1: Consumers face constraints and must make optimal decisions given these constraints.
A2: In rational consumer choice, consumers aim to maximize total utility.
A3: Diminishing marginal utility: each additional unit consumed provides less additional satisfaction.
A4: Consumers allocate limited income to purchase a combination of goods that maximizes utility by equating or comparing marginal utility per dollar across goods.
Exclusion: Indifference curves are beyond scope; equating MU per price ratios is within scope.
Learning Objective (CBA-2.B)
B1: Define marginal analysis and related terms.
B2: Explain decisions using marginal analysis.
Essential Knowledge (CBA-2.B)
B1: Marginal analysis compares the additional benefit of increasing an activity with the additional cost; MB vs MC informs whether to increase, decrease, or maintain.
B2: Optimal quantity is not affected by sunk costs or fixed past benefits.
B3: Optimal quantity is achieved where MB = MC or where total benefit is maximized.
Pro Tip: Marginal Analysis is the common thread throughout microeconomics.
The Scope of Economics
Microeconomics: focuses on individual industries and decision-making units (firms and households).
Macroeconomics: studies aggregates (income, output, employment) at a national scale.
The Study of Economics
Economics is the study of how individuals and societies choose to use scarce resources provided by nature and prior generations.
Why Study Economics?
Three fundamental concepts: Opportunity cost, Marginalism, and Efficient markets.
A key reason: develop a way of thinking about decisions and trade-offs.
Opportunity Cost
The best alternative forgone when a choice is made.
Arises because time and resources are scarce; nearly all decisions involve trade-offs.
Marginalism
When weighing costs and benefits, consider only costs/benefits arising from the decision (ignore sunk costs).
For example, when deciding whether to produce more output, consider only marginal cost, not sunk cost.
Sunk costs: costs that cannot be avoided regardless of future choices.
Efficient Markets
An efficient market eliminates profit opportunities almost instantaneously; there is no free lunch.
Profit opportunities are rare because many people search for them at any time.
More Reasons to Study Economics
Economics studies societal and global resource allocation.
Helpful for voters; voting decisions require understanding economics.
Money and financial systems are important but not the most fundamental issue in economics.
The Diverse Fields of Economics
Microeconomic concerns: Production/Output in individual industries and businesses; prices of goods/services; distribution of income and wealth; employment by industry.
Macroec onomics concerns: National production/output; total wages; GDP; inflation; unemployment; national income.
The Method of Economics
Normative economics (policy economics): analyzes outcomes, judges them good or bad, and may prescribe actions.
Positive economics: studies economic behavior without judgments; describes what exists and how it works.
Positive Economics Components
Descriptive economics: data describing phenomena.
Economic theory: models of behavior (theory is a set of cause/effect statements).
Empirical economics: data collection and use to test theories.
Theories and Models
Theory: general cause/effect statements; involves models and variables.
Model: formal statement of a theory; describes relationships between two or more variables.
Ockham’s razor: simplifications help avoid unnecessary detail.
Theories and Models (continued)
Variable: a measurable factor that can change.
Ceteris paribus (all else equal): study the relationship between two variables while holding others constant.
Ceteris paribus is part of abstraction to focus on key relationships.
Pitfalls in Theory Building
Post Hoc Fallacy: assuming that because A happened before B, A caused B.
Fallacy of Composition: what is true for a part is not necessarily true for the whole; models that work for individuals may fail for the whole.
Economic Policy Criteria for Judging Outcomes
Efficiency (allocative efficiency): producing what people want at the least cost.
Equity (fairness of outcomes).
Growth (increase in total output).
Stability (steady or growing output with low inflation and full employment of resources).
Reading and Understanding Graphs
Cartesian plane points (X,Y) represent variable pairs.
In simple causation, X causes Y (relationship is causal).
Reading Between the Lines
A line on a graph is a continuous set of (X,Y) values.
A relationship can be negative or positive depending on the slope.
Positive and Negative Relationships
A downward-sloping line indicates a negative relationship: as X increases, Y decreases.
Upward-sloping line indicates a positive relationship: both increase together.
The Components of a Line
Algebra: Y = a + bX
Y = dependent variable
X = independent variable
a = Y-intercept (value of Y when X = 0)
b = slope (rate of change in Y per unit change in X)
Interpretations:
b > 0: positive relationship
b < 0: negative relationship
Different Slope Values (examples of slope b)
Example slopes (illustrative):
b =
5/10 = 0.5
15/10 = 1.5
7/10 = 0.7
-0.7 etc.
Note: slope magnitude reflects how steep the line is; a steeper slope means greater change in Y for a unit change in X.
Strength of the Relationship Between X and Y
A relatively flat line: changes in X have little influence on Y.
A relatively steep line: changes in X have a large influence on Y.
The Difference Between a Line and a Curve
Line: equal increments in X lead to constant increases in Y.
Curve: equal increments in X lead to diminishing (or increasing, depending on the curve) changes in Y.
Interpreting the Slope of a Curve
Graph A: positive and decreasing slope.
Graph B: negative slope, then positive slope.
Graph C: negative and increasing relationship.
Graph D: negative and decreasing slope.
Production Possibilities & Markets
What is Production?
Production: process of transforming resources into useful forms.
Resources refer to inputs provided by nature or previous generations that can be used indirectly or directly to satisfy human wants.
Categories:
Capital resources
Human resources
Natural resources
Three Basic Questions (societal decisions)
What will be produced?
How will it be produced?
Who will get what is produced?
Three Basic Questions – Allocation and Distribution
Allocation of Resources
Distribution of output
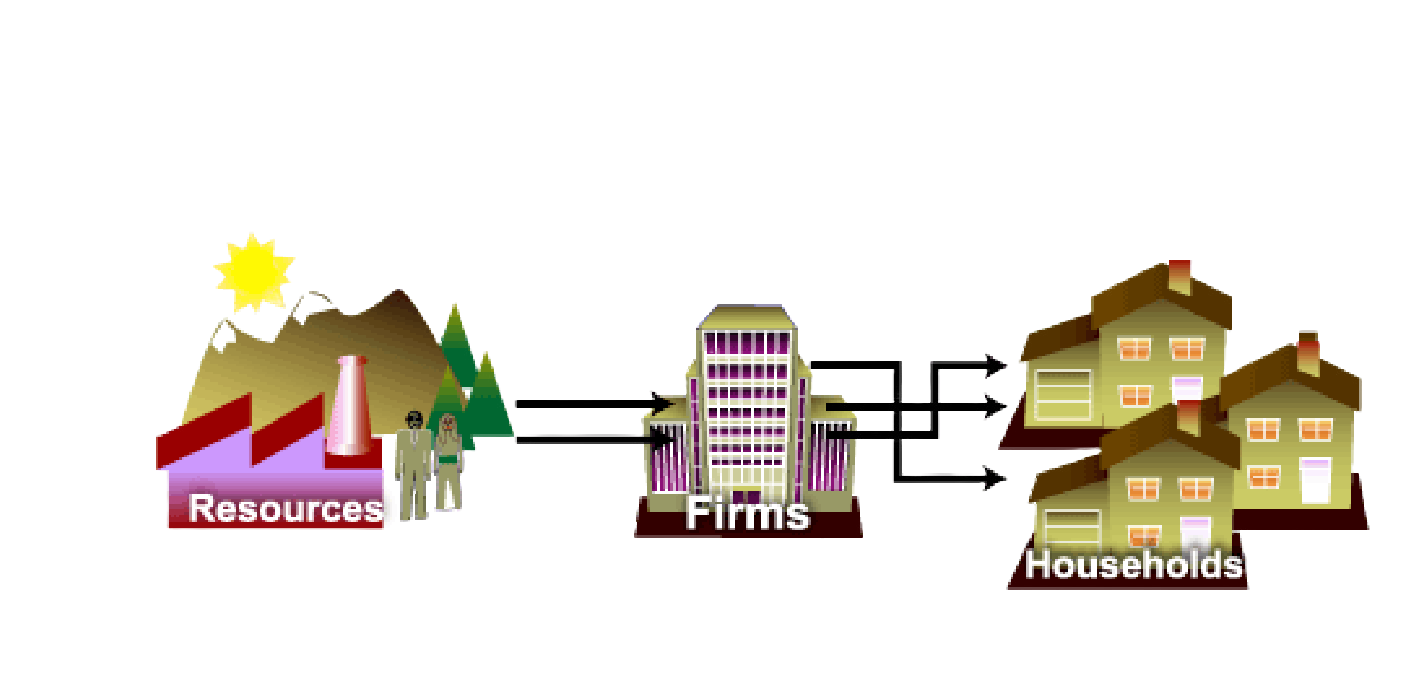
Actors involved: Resources, Firms, Households
Specialization, Exchange and Comparative Advantage
David Ricardo developed the theory of comparative advantage to explain the benefits of specialization and free trade.
By focusing on the production of goods and services in which they have a lower opportunity cost, countries and individuals can engage in trade that maximizes overall economic efficiency and increases total output. This leads to greater availability of products and promotes economic growth, as resources are allocated more effectively across different sectors.
Core concept: Opportunity cost governs comparative advantage.
Opportunity Cost (reiterated for this topic)
What we forgo when making a decision; central to comparative advantage analysis.
Specialization and Free Trade Impacts
According to the theory of competitive advantage (comparative advantage), specialization and free trade benefit all trading parties, even those that could produce more efficiently overall.
Absolute vs Comparative Advantage (example)
Country A vs Country B production per day:
Country A: Food = 6, Clothing = 3
Country B: Food = 1, Clothing = 2
Interpretation: A has absolute advantage in both goods. It had comparative advantage in the production of food.
Comparative advantage analysis based on opportunity costs:
For food: 1 unit of food costs country A 1/2 a unit of clothing; for country B, 1 unit of food costs 2 units of clothing.
For clothing: 1 unit of clothing costs country A 2 units of food; for country B, 1 unit of clothing costs 1/2 unit of food.
Conclusion from the example
Country A should specialize in producing food; Country B should specialize in producing clothing.
Specialization also helps develop skills and raise productivity.
Output per day of work: Food and Clothing
Country A: Food = 6, Clothing = 3
Country B: Food = 1, Clothing = 2
Weighing Present and Expected Future Costs and Benefits
Investment is the process of using resources to produce new capital.
Capital is the accumulation of past investment.
Because resources are scarce, the opportunity cost of every capital investment is forgone present consumption.
Capital Goods and Consumer Goods
Consumer goods: goods produced for present consumption.
Capital goods: goods used to produce other goods or services over time.
The Production Possibility Frontier (PPF)
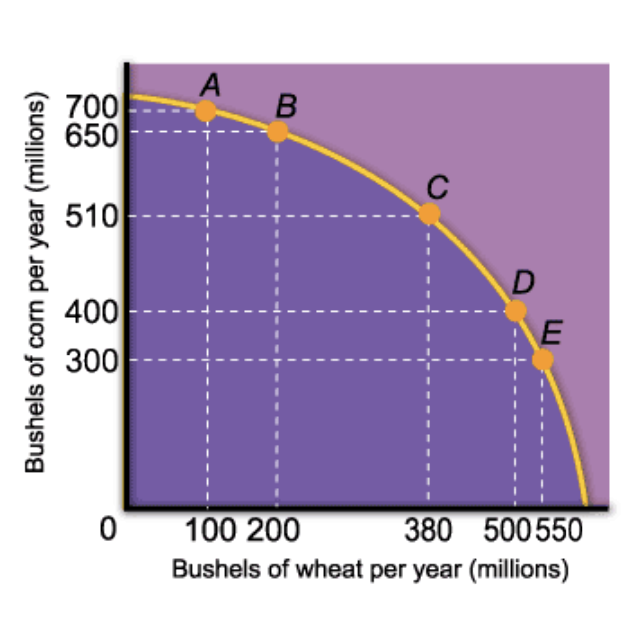
A graph showing all combinations of goods/services that can be produced when all resources are used efficiently.
The PPF curve has a negative slope, indicating the trade-off between two goods.
Slope of the PPF is the Marginal Rate of Transformation (MRT).
Anything on curve = Max Resources
Points inside the curve are inefficient.
Point H (inside) indicates unemployment or inefficient use of resources.
Point F (outside the curve) is desirable but unattainable with current resources.
Point C (on the curve) is a possible efficient production point.
Movement along the curve illustrates opportunity cost: increasing capital goods requires sacrificing consumer goods.
Law of Increasing Opportunity Cost: The concave shape of the PPF shows that as output of one good increases, increasingly more of the other must be sacrificed.
Economic Growth
Definition: an increase in total output of the economy.
Causes: capital accumulation and technological advances.
Mechanism: outward shift of the PPF; growth allows more of both goods to be produced.
Not all sectors grow equally; historical productivity gains may be larger in some goods (e.g., corn vs wheat).
The Economic Problem
Core question: with scarce resources, how do large societies answer the three basic economic questions?
Economic systems: Command economies, Laissez-faire economies, Mixed systems.
The Economic Problem – Systems
Command economy: central government sets output targets, incomes, and prices.
Laissez-faire economy: individuals and firms pursue self-interests with minimal central direction; the free-market system is central.
Market: an institution through which buyers and sellers exchange.
Laissez-Faire Economies: The Free Market
Consumer sovereignty: consumers ultimately decide what will be produced by choosing what to purchase.
Free enterprise: producers must plan, organize, and coordinate production in a free market.
The distribution of output is decentralized and depends on income and wealth.
Coordinating mechanism: price. Price reflects what society is willing to pay and is neutral between consumers and producers.
Mixed Systems, Markets, and Governments
Markets are not perfect; governments play a major role in:
Minimize market inefficiencies
Provide public goods
Redistribute income
Stabilize the macroeconomy
Promote low unemployment
Promote low inflation