2.3 Population Composition Notes
Age structure is the proportion of the total population in each age group
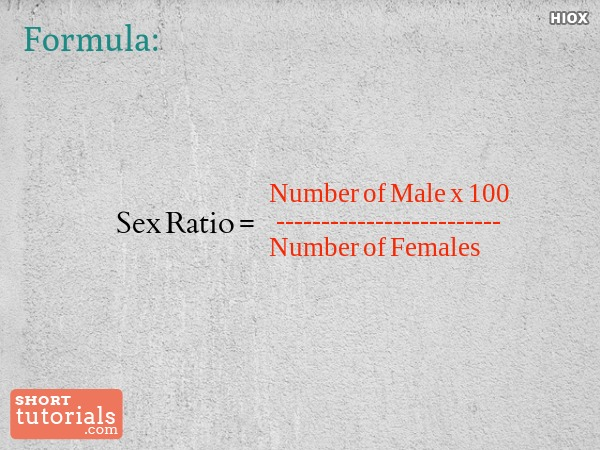
Sex ratios is the number of males per 100 females in a population. If this ratio is less than 100, there are more female births. If the ratio is equal to 100, the births between males and females are even. Lastly, if the ratio is greater than 100, there are more male births.
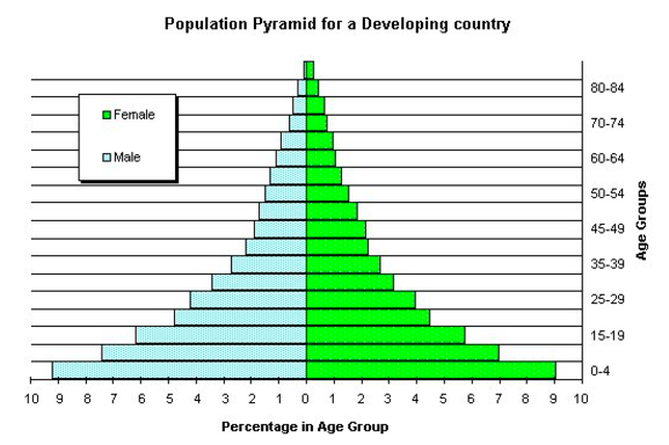
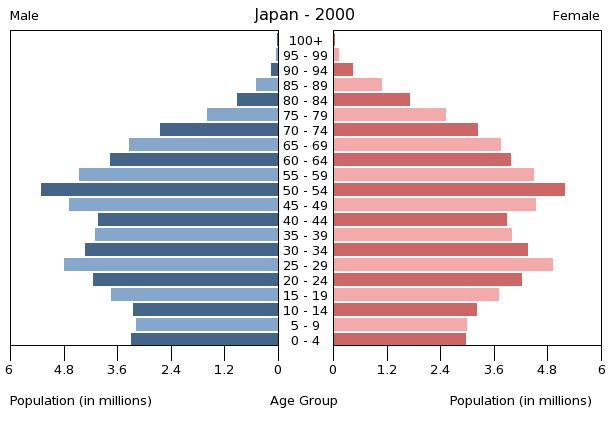
}}Population pyramids are simply an age-sex structure, the sex is on the horizontal axis and age cohorts are on the vertical axis. There are different types of population pyramids.}}
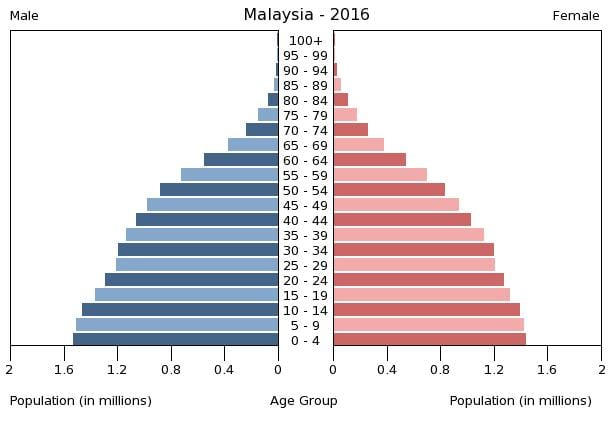
- Wide base and narrow head means that a population is growing rapidly
- Narrow base while still being bigger than the rest means a population is growing slowly
- When the middle is its widest portion, growth is slowing
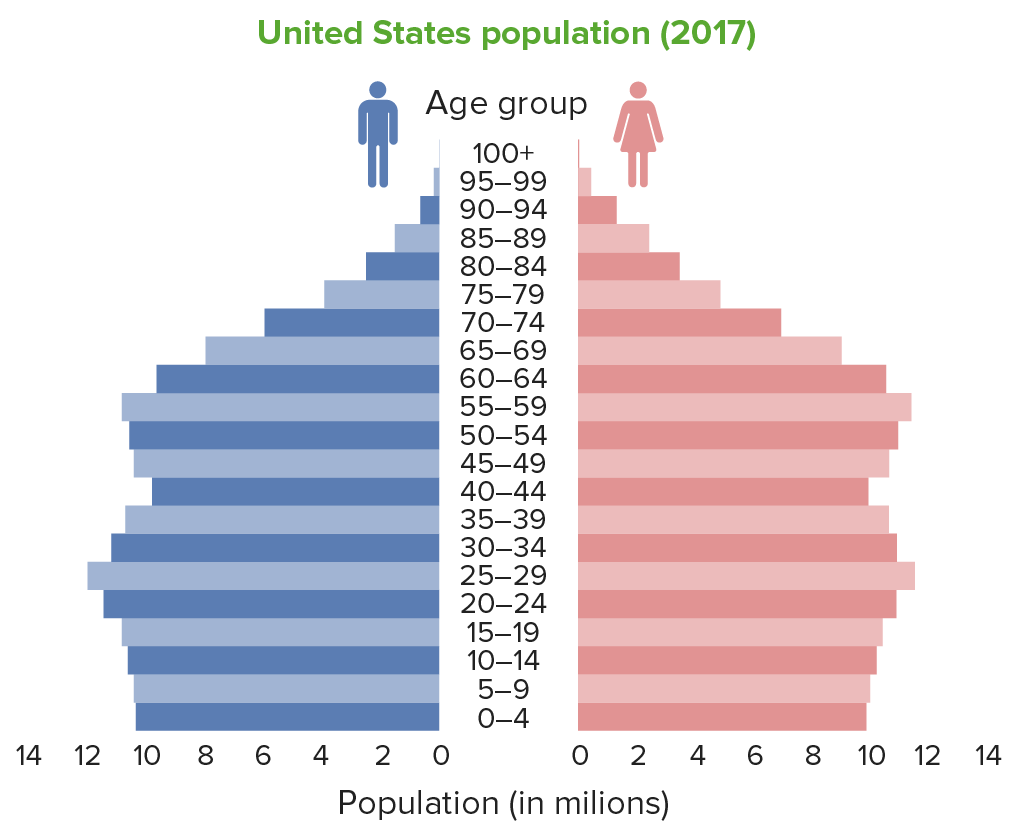
- Narrow (trophy shaped pyramid) with a larger top indicates population decline
2.3 IMPORTANT VOCABULARY
Population Pyramid- Tool based only on age and gender data, it can provide information on birth rates, death rates, how long people live on average and, economic development
Cohorts- The vertical axis which shows age groups
Birth Deficit- The slowdown of births
Baby Boom- Once hostilities end and peace resumes, the birth rate often spikes
Baby Bust- Once the boom ends, birth rates are lower for a number of years
Echo (Boom)- A significant increase in births that shows up as a bulge in the pyramid caused by an earlier baby boom
Potential Workforce- People whose ages are 15-64, this is the group that is expected to be the society’s labor force
Dependent Population- People under 15 or over 64, this group is considered too young or too old to work full-time and, therefore, are assumed to rely on the economically active workforce to keep society running
Dependency Ratio- The comparison between the size of the potential workforce and the dependent population