1.3-1.4
Symmetry- a distribution is (roughly) symmetric where the right and left sides almost mirror each other (Bell Curve) 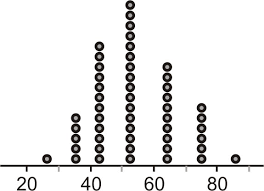
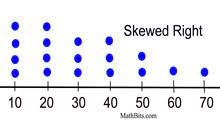
Skewed to right- Bulk of Data is to the left (Data is longer to right)
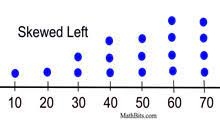
Skewed to left- Bulk of Data is to the right (Data is longer to the left)
Describing overall pattern
Shape
Symmetry and Skewness
Centers
Mean (Average), Median (Middle), Mode (Occurs the most)
Variability
Spread (Range, Deviation)
Outliers- Piece of data that stands out from the overall pattern
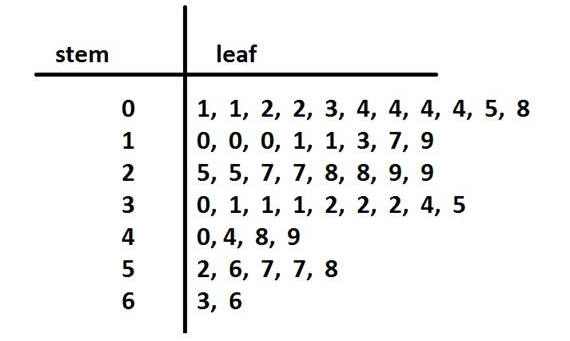
Stem plot- Shows data values separated into 2 parts, Stem and Leaf
Stem
Everything but the final digit
Written from Least to Greatest
Leaf
The final digit
Written from Least to Greatest from the appropriate stem