ULTRASOUND
HISTORY OF UTZ
Early Foundations (1700s–1800s)
1794 – Lazzaro Spallanzani discovers bat echolocation (echo concept)
1842 – Christian Doppler formulates the Doppler Effect principle
1877 – Lord Rayleigh publishes The Theory of Sound—foundational for acoustic theory
1880 – Pierre & Jacques Curie discover the piezoelectric effect
Industrial Origins (1900s–1930s)
1912–1917 – Titan collisions spark sonar research. Paul Langevin invents a quartz-based sonar transducer for submarine detection
1928–1930s – Sergei Sokolov and others apply ultrasonic flaw detection in metallurgy
Early Medical Innovations (1940s–1950s)
1942 – Karl Dussik performs the first medical ultrasound (hyperphonography of the brain)
1948–1950 – George Ludwig explores ultrasound for gallstones; John Wild and John Reid produce early A-mode breast and bowel scans, publishing in The Lancet and Science
1951 – AIUM is founded; early handheld B-mode contact scanners developed
1953–1954 – Inge Edler and Hellmuth Hertz produce the first M-mode echocardiograms using a repurposed flaw detector
1955–1957 – Shigeo Satomura introduces continuous-wave (CW) Doppler for detecting heart and blood flow in humans. NEC commercializes a Doppler Rheograph in 1959
Advancements in Imaging & Global Contributions (1960s–1970s)
1960 – Cieszyński pioneers intravascular and intracardiac ultrasound
1961–1962 – George Kossoff, David Robinson, and William Garrett at Australia’s Commonwealth Acoustic Laboratories develop the first obstetric images using a water-coupled echoscope
1965–1969 – The team introduces grayscale imaging and creates the UI Octoson—Australia’s rapid, multi-transducer water-bath scanner
Late 1960s – Doppler advances: pulsed Doppler and intravascular scanning emerge; Tom Brown and Ian Donald develop the compound contact B-mode obstetric scanner
Commercial Growth & Corporate Innovations (1970s–1990s)
1970s – Major manufacturers like Siemens, Toshiba, Aloka, and Hitachi release commercial ultrasound systems
1977/78 – Siemens launches the TOMOSON (first compound scanner); by 1979, they release the real-time Diasonics RA-1 and Echopan KS for echocardiography
1980s–1990s – Siemens introduces portable systems like SONOLINE 1000, linear/sector Sonoline SL, and color Doppler systems such as Q2000
1987–1990s – The first 3D ultrasound systems are developed and widely applied clinically
Modern & Emerging Technology (2000s–Present)
2000s – 4D ultrasound introduced; contrast-enhanced ultrasound (CEUS) with microbubbles reaches clinical use
2010s–2020s – Advances include elastography, POCUS (point-of-care ultrasound), handheld devices, AI-assisted imaging, and fusion imaging with CT/MRI (not yet widely documented, but widely acknowledged in contemporary ultrasound development).
Group 1
The Sound Spectrum – Our Audible Window into the World
Think of the sound spectrum like the colors of light. Light has red to violet; sound has low to high frequencies. But unlike light, our ears don’t “see” all of it — only a portion.
Infrasound (<20 Hz): Deep rumbles, earthquakes, volcanoes, elephant calls. You don’t hear them well, but you feel them as vibrations.
Audible sound (20 Hz–20 kHz): The music of life — speech, instruments, nature.
Ultrasound (>20 kHz): Too high for us to hear. Bats and dolphins use it to navigate. Humans use it for medical imaging, cleaning, and industry.
👉 Key idea: As you move higher in the spectrum, the detail increases, but the distance decreases. (Deep drum beats travel far; a bird chirp fades quickly.)
2. Waves – The Language of Sound
Sound does not travel in space; it needs a medium (air, water, tissue, or solid). It moves as a longitudinal wave: compressions (molecules packed together) and rarefactions (molecules spread apart).
Important Relationships
Velocity (v) = Frequency (f) × Wavelength (λ)
Like a seesaw: if one goes up, the other goes down (when velocity is constant).
Frequency ↑ → Wavelength ↓ (inversely proportional).
Example: Higher notes on a piano have shorter wavelengths.Frequency ↑ → Pitch ↑ → Energy ↑ (directly proportional).
Example: A whistle has more “energy” in its tone than a bass drum.Velocity depends on the medium, not the sound.
In air: ~343 m/s
In water: ~1500 m/s
In steel: ~5900 m/s
Why? Because denser and more elastic materials transmit vibrations faster.
👉 Analogy: Imagine children passing a message down a line. If they’re packed tightly (like molecules in steel), the message moves quickly. If they’re spread out (like in air), it’s slower.
3. Terminologies (Explained Deeply)
Piezoelectric Effect
The workhorse of ultrasound.
Crystals like quartz or lead zirconate titanate vibrate when an electric current is applied.
The vibration produces sound waves (usually ultrasound).
When sound bounces back (echoes), the same crystals convert it back into electricity → image on the screen.
👉 Without piezoelectricity, no ultrasound scanning would exist.
Velocity (v)
Speed of sound in a medium. Depends on:
Density (ρ): How heavy-packed molecules are.
Elasticity (E): How easily molecules return to shape after compression.
Formula (simplified):
v=ElasticityDensityv = \sqrt{\frac{Elasticity}{Density}}v=DensityElasticity
👉 Denser doesn’t always mean faster — steel is dense but also very elastic, so sound flies through it. Fat is denser than muscle but less elastic, so sound travels slower in fat.
Frequency (f)
Number of cycles per second. Determines pitch.
Low frequency = bass notes.
High frequency = treble notes.
In ultrasound:
Low frequency (2–5 MHz) → deeper penetration, less detail.
High frequency (7–15 MHz) → shallow penetration, more detail.
👉 Like camera settings: low frequency is wide-angle (big picture), high frequency is zoom-in (fine detail).
Wavelength (λ)
The distance between two compressions.
Short wavelength = more detail (like small brush strokes in painting).
Long wavelength = less detail but goes farther.
Hertz (Hz)
The unit of frequency. Named after Heinrich Hertz.
1 Hz = 1 cycle per second.
1000 Hz = 1 kilohertz (kHz).
1,000,000 Hz = 1 megahertz (MHz).
Ultrasound usually uses 2–15 MHz.
Soundwave
The actual traveling disturbance — the push and pull of molecules.
Mechanical: Needs a medium.
Longitudinal: Molecules move parallel to the wave’s direction.
👉 Different from light, which is electromagnetic and transverse.
Attenuation
Loss of strength as sound travels. Caused by:
Absorption: Energy turned into heat.
Reflection: Bounces back at boundaries.
Scattering: Spread in many directions (common in soft tissue).
👉 Higher frequency attenuates more. That’s why deep imaging (like in the abdomen) uses low frequency.
Acoustic Impedance (Z)
A property of the medium:
Z=ρ×vZ = \rho \times vZ=ρ×v
(density × velocity).
It decides how much sound enters or reflects at a boundary.
Acoustic Mismatch
When two tissues have very different impedances (like air vs tissue), most of the sound reflects.
Example: That’s why ultrasound gel is applied — to remove air between probe and skin (air = terrible mismatch).
Sound Intensity Notation (I)
Intensity = Power / Area (W/m²).
Expressed in decibels (dB).
Decibels are logarithmic — each 10 dB increase means 10× more intensity.
👉 Example:
30 dB = whisper.
60 dB = conversation.
120 dB = pain threshold.
In ultrasound, intensity must be controlled to avoid tissue heating.
4. Pulling It All Together
When sound is created (via piezoelectric effect), it travels at a certain velocity depending on the medium. Its frequency determines pitch and resolution, while its wavelength decides penetration. Along the journey, sound attenuates — weakened by absorption and reflection. When it hits a boundary with different acoustic impedance, part of it reflects, part continues.
By measuring these reflections (echoes), technology like ultrasound paints an image of what’s inside.
Conclusion
Sound is not merely “noise.” It is a dance of waves, frequencies, and energies interacting with the world. Understanding terms like frequency, wavelength, attenuation, and impedance helps us predict how sound will behave in real situations.
👉 Remember:
Frequency and wavelength are opposites.
Velocity depends on the medium.
Attenuation eats away energy.
Impedance controls reflection.
With these in mind, sound becomes not just something to hear, but something to use, measure, and understand.
Group 2
Physical Principles of Diagnostic Ultrasound
1. Nature of Ultrasound
Ultrasound is simply sound waves with frequencies above 20,000 Hz, beyond the human hearing range. In medicine, we usually use 2–15 MHz. The special properties of these waves allow us to create images of tissues inside the body.
a. Wave Equation
The basic relationship of any wave is:
v=f×λv = f \times \lambdav=f×λ
v = velocity (speed of sound in the medium)
f = frequency (Hz)
λ = wavelength (m)
👉 In medical ultrasound, velocity is almost constant in soft tissue (~1540 m/s), so when frequency increases, wavelength must decrease.
High frequency → short wavelength → better resolution, but less penetration.
Low frequency → long wavelength → deeper penetration, but less detail.
b. Resonance
Resonance occurs when a structure vibrates at its natural frequency due to incoming sound waves.
In ultrasound, resonance enhances echoes.
Example: Small structures like bubbles or air pockets can resonate, creating strong signals (but also artifacts in imaging).
👉 Clinically, resonance can sometimes distort the image, but can also be useful for identifying gas or microbubbles in contrast imaging.
c. Acoustic Intensity and Power
Power (W): The total energy per unit time produced by the transducer.
Intensity (W/m²): Power distributed over an area (beam cross-section).
I=PAI = \frac{P}{A}I=AP
Ultrasound systems carefully limit intensity to avoid bioeffects like heating or cavitation. This is why diagnostic ultrasound is considered safe when used properly.
👉 Clinical note: Doppler modes usually use higher intensities than B-mode imaging.
2. Acoustic Reflection
When ultrasound encounters a boundary between two tissues, some energy is reflected, some is transmitted, and some is scattered. Reflection is what produces the echoes that form an image.
a. Acoustic Impedance (Z)
Defined as:
Z=ρ×vZ = \rho \times vZ=ρ×v
where ρ = density, v = velocity.
Each tissue has a specific impedance.
A large difference in impedance between two tissues → strong reflection.
Example: Soft tissue (~1.63 MRayls) vs air (~0.0004 MRayls) = huge mismatch, almost total reflection (why gel is required).
b. Reflectivity
The fraction of the sound that reflects at a boundary depends on the impedance difference:
R=(Z2−Z1Z2+Z1)2R = \left(\frac{Z_2 - Z_1}{Z_2 + Z_1}\right)^2R=(Z2+Z1Z2−Z1)2
If impedances are similar → weak reflection (good transmission).
If impedances differ greatly → strong reflection (poor transmission).
👉 Example: Tissue–bone interface produces a bright echo but no penetration beyond bone.
c. Scattering
Occurs when sound hits small structures (smaller than the wavelength), like red blood cells.
Produces echoes in all directions.
This is the principle behind Doppler imaging — scattered echoes from moving blood cells allow us to measure flow.
👉 Without scattering, we couldn’t see blood flow in vessels.
3. Acoustic Absorption and Attenuation
As ultrasound travels through tissue, energy is lost. This process is called attenuation.
a. Acoustic Absorption
The main form of attenuation.
Sound energy is converted into heat.
Higher frequency = more absorption.
👉 That’s why we don’t use very high frequencies for deep organs.
b. Scattering Contribution
Besides absorption, scattering also contributes to attenuation, since scattered energy does not return to the transducer.
c. Overall Attenuation
The total weakening of the beam is expressed as:
Attenuation (dB)=α×f×d\text{Attenuation (dB)} = \alpha \times f \times dAttenuation (dB)=α×f×d
α = attenuation coefficient (dB/cm·MHz)
f = frequency (MHz)
d = depth (cm)
👉 Clinical rule of thumb: Attenuation ≈ 0.5 dB per cm per MHz in soft tissue.
So:
5 MHz beam at 10 cm depth → 25 dB loss.
10 MHz beam at 10 cm depth → 50 dB loss.
This is why higher frequencies give sharp images only at shallow depths.
Conclusion
Diagnostic ultrasound rests on three pillars:
Nature of Ultrasound – governed by the wave equation, resonance, and intensity.
Acoustic Reflection – determined by impedance differences, reflection, and scattering.
Attenuation – the energy loss through absorption and scattering, limiting penetration.
👉 In practice:
Choose low frequency for deep organs (e.g., liver, kidney).
Choose high frequency for superficial structures (e.g., thyroid, vessels, tendons).
Always remember: Without reflection, no image. Without attenuation, no depth limit. Without scattering, no Doppler.
Group 3
I. The Ultrasound Machine – The Heart of the System
Now, my dear students, when you stand in front of an ultrasound machine, remember: it is not just a box with a screen. It is the culmination of over a century of discovery, trial, and refinement.
Main Parts and Their Functions:
Control Console / Panel
This is where the operator interacts with the system. Every knob and button has a purpose — adjusting depth, gain, frequency, or focus.
A skilled technologist doesn’t just “press buttons” but understands how each setting changes the image and the safety of the exam.
Central Processing Unit (CPU)
The “brain.” It interprets returning signals and turns them into images. Modern CPUs can process thousands of echoes in microseconds to give us real-time visualization.
Display Monitor
Where the final image appears. What you see here is not the actual anatomy, but a representation created by echoes. The clarity of this image depends on how well the machine and the operator work together.
Transducer / Probe
This is the soul of the machine. It is both the mouth (sending sound) and the ears (listening for echoes). Without it, the system is mute and deaf.
Amplifiers & Image Storage
Amplifiers make weak echoes strong enough to be seen.
Storage systems allow us to record findings for diagnosis and medico-legal documentation.
II. The Transducer – The True Workhorse
Let’s dwell on this, because the probe is where the real magic happens.
Parts of the Transducer:
Piezoelectric Crystals – the heart. They vibrate when electricity is applied, producing sound waves. And when echoes return, they vibrate again, creating an electrical signal. This “duality” is what makes ultrasound possible.
Backing/Damping Material – controls the ringing of the crystal. Without this, the sound pulse would be too long, blurring the image. Shorter pulses mean sharper axial resolution.
Matching Layer – a thin barrier between the crystal and the patient’s skin. Without this, most sound would bounce back because of impedance mismatch. It ensures energy enters the body.
Acoustic Lens / Electronic Focusing – narrows the beam, so we can focus on a precise area. The narrower the beam, the sharper the lateral resolution.
Housing and Cable – protection and connection to the machine.
Beam Focusing:
In the old days, physical lenses or curved crystals were used. Now, electronic phasing allows us to focus the beam dynamically. This means we can sharpen images at different depths — a powerful advantage in diagnostic imaging.
III. The Ultrasonic Beam & Resolution
You must understand that an ultrasound image is only as good as the beam that creates it.
Axial Resolution (front-to-back clarity)
The ability to separate two points that lie along the same line as the beam.
It depends on pulse length. Shorter pulses (from higher frequencies and better damping) produce finer detail.
Lateral Resolution (side-to-side clarity)
The ability to distinguish structures lying beside each other.
It depends on the beam width. A narrow beam, especially with focusing, improves lateral resolution.
👉 In practice:
Axial resolution is generally better than lateral.
That’s why good focusing techniques and correct probe selection matter greatly.
IV. Operational Modes of Ultrasound
Each mode was invented for a purpose. Let’s go through them as if we are walking through history:
A-Mode (Amplitude Mode)
The earliest mode. Just spikes on a graph, each spike representing an echo.
Rare today, but still used in ophthalmology to measure eye dimensions.
B-Mode (Brightness Mode)
The revolution that gave us 2D images. Each echo becomes a dot with brightness proportional to echo strength. Combined, these dots form cross-sectional images.
This is what most people think of when they hear “ultrasound.”
M-Mode (Motion Mode)
Instead of a still image, M-mode traces moving structures over time.
It is invaluable in cardiology for studying valve motion and fetal heartbeat.
Real-Time Imaging
By rapidly refreshing B-mode images, we get a moving “movie” of internal structures.
Real-time ultrasound allows us to guide needles, follow fetal movements, and study organ motion instantly.
Doppler Mode
Here, we apply the Doppler effect to sound. Moving red blood cells changes the frequency of returning echoes.
This lets us measure direction and speed of blood flow, vital in vascular and cardiac studies.
Color Doppler adds visual flow mapping, making diagnosis quicker and clearer.
Linear Mode (Linear Array Transducer)
Produces a rectangular image.
Best for superficial and vascular structures (thyroid, breast, arteries).
Sector Mode (Phased Array Transducer)
Produces a pie-slice image.
Excellent for deep imaging through small windows (cardiac, abdomen), where access is limited.
Closing Perspective
Now, after decades of seeing ultrasound evolve, I want you to remember this:
Ultrasound is safe because it uses sound, not ionizing radiation.
But its safety does not mean we should be careless — poor technique can still harm patients by misdiagnosis.
Mastery of ultrasound requires both technical knowledge (understanding beams, probes, modes) and artistic skill (knowing how to angle, press, and interpret).
In the hands of a skilled radiologic technologist or sonographer, ultrasound becomes more than a machine — it becomes an extension of your senses, allowing you to see what the naked eye never could.
Group 4
Ultrasound Factoring and Image Recording
I. ULTRASOUND FACTORING
Ultrasound factoring refers to the key technical controls that adjust and improve the quality of the ultrasound image. These factors help the operator produce clear, detailed, and accurate results.
1. Time-Gain Compensation (TGC)
Definition:
Time-Gain Compensation (TGC) is a control that adjusts the brightness of echoes at different depths to make the image uniform.
Explanation:
As ultrasound waves travel deeper into the body, they weaken (this is called attenuation). The echoes from deeper tissues become dimmer.
TGC corrects this by increasing the amplification of deeper echoes so that all structures, whether near or far, appear with similar brightness.
In simpler words:
TGC balances the brightness — near and deep tissues look equally clear.
Importance:
Provides even brightness throughout the image.
Helps differentiate tissues clearly.
Reduces the need to re-scan.
💡 Think of TGC as adjusting the lighting of deeper organs so they look as bright as those near the surface.
2. Power Input / Output Gain
Definition:
Power or output gain controls the strength (amplitude) of the sound waves emitted by the transducer.
Explanation:
Output Gain: Increases or decreases the power of the sound beam sent into the body.
Input Gain (Receiver Gain): Adjusts how strongly the returning echoes are displayed.
Too much power: Can make the image overly bright and may increase patient exposure (though still safe).
Too little power: Produces dark, unclear images.
Importance:
Enhances image brightness and contrast.
Maintains diagnostic quality.
Keeps scanning safely by using only the required power level.
💡 A skilled sonographer always finds the right balance — clear image, minimal exposure.
3. Mode Display Selection
Definition:
Mode display selection refers to choosing the type of ultrasound display mode that best fits the examination.
Explanation:
Different modes show echoes in various ways:
A-mode: One-dimensional spikes.
B-mode: Two-dimensional grayscale image.
M-mode: Motion over time (e.g., heartbeat).
Doppler mode: Blood flow direction and velocity.
Importance:
Helps visualize structures accurately.
Allows proper diagnosis based on what needs to be seen — structure, motion, or flow.
💡 Right mode = right information. Each display serves a unique clinical purpose.
II. IMAGE RECORDING
Once the ultrasound image is produced, it must be recorded or stored for documentation, review, and diagnosis.
Image recording methods have evolved—from old photographic film to digital storage.
1. Photographic Recording
Definition:
Photographic recording captures ultrasound images on film using light-sensitive paper or film.
Explanation:
The monitor image is photographed through a camera system attached to the ultrasound machine.
Older systems used chemical development (darkroom process).
Importance:
Provides permanent hard-copy records.
Useful for patient files and clinical reports.
💡 Though rare today, it’s the foundation of ultrasound documentation.
2. Video Tape Recorders (VTR)
Definition:
Video tape recorders capture real-time ultrasound scans on magnetic tapes.
Explanation:
Used mostly in earlier decades for continuous or dynamic studies (e.g., fetal movements, heart function).
The ultrasound signal is recorded and replayed on video monitors.
Importance:
Allowed review of moving images.
Useful for teaching and case studies.
💡 Think of it as the “old-school DVR” of ultrasound — recording live motion for later playback.
3. Polaroid Photography
Definition:
Polaroid cameras were once attached directly to ultrasound monitors to take instant photos of frozen frames.
Explanation:
Provided quick, self-developing prints for reports and records.
No need for film development.
Importance:
Fast and convenient.
Used when immediate image copies were required (especially OB/GYN scans).
💡 Instant results — snap and wait a few seconds for the image to appear.
4. Multiformat Cameras
Definition:
Multiformat cameras record multiple ultrasound images onto a single sheet of film.
Explanation:
The system arranges several frames (often 4, 6, or 9 images) onto one film.
Used in hospitals to save film and show the progression of movement (like fetal or cardiac scans).
Importance:
Efficient and organized.
Helpful in comparing images side by side.
💡 A single film showing different moments — like a story told through pictures.
5. Setting Up the Photographic System
Steps and Key Points:
Check the camera connection to the ultrasound console.
Adjust brightness and contrast on the monitor before capturing.
Select appropriate image frames (frozen or dynamic).
Ensure proper film loading and orientation.
Perform a test print to verify clarity.
Label and store images properly with patient name, date, and study type.
Importance:
Ensures high-quality, identifiable, and well-organized records.
Prevents confusion and maintains patient safety standards.
💡 A clean setup means a clean image — precision starts with preparation.
III. Summary (by the Old Pro 🧓)
In ultrasound, image quality depends not only on the machine’s technology but also on the operator’s adjustments and recording technique.
TGC keeps brightness even.
Power and gain control image strength.
Mode selection chooses how we see structures and motion.
Recording systems — whether film, video, or digital — preserve the results for study, diagnosis, and history.
Ultrasound, my dear students, is not just about seeing what’s inside; it’s about mastering how to capture and control sound — with precision, patience, and practice.
Group 5
Artifacts and Anatomical Presentation in Ultrasonography
(September 6)
I. ARTIFACTS AND PITFALLS IN ULTRASONOGRAPHY
Ultrasound artifacts are false appearances or distortions seen on the image that do not represent the real structure of the tissue.
They are caused by the interaction of sound waves with different tissues, reflective surfaces, or beam properties.
While some artifacts can confuse interpretation, others are useful clues to identify certain pathologies.
1. Reverberation Artifact
Definition:
Reverberation occurs when the ultrasound beam bounces back and forth between two strong reflectors, causing multiple equally spaced echoes to appear on the image.
Appearance:
Looks like several parallel, evenly spaced lines beneath a strong echo.
Commonly seen behind the pleura, diaphragm, or metal objects (like surgical clips).
Cause:
Sound waves repeatedly reflect between the probe and a strong reflector before returning to the transducer.
Clinical Example:
Air in bowel loops or pleural line may cause reverberation.
Metallic objects (needles, catheters) produce this artifact.
📸 Sample Image Suggestion:
(Insert image showing parallel lines beneath a bright interface — labeled “Reverberation Artifact.”)
2. Acoustic Shadowing
Definition:
Acoustic shadowing appears as a dark band or shadow behind a strongly attenuating structure that blocks the ultrasound beam.
Cause:
The sound cannot pass through very dense or reflective materials such as bone, stones, or calcifications.
Appearance:
Dark shadow beneath bright, reflective surfaces.
Clinical Example:
Gallstones or kidney stones cause distinct acoustic shadows.
📸 Sample Image Suggestion:
(Insert gallbladder ultrasound showing bright stones with dark posterior shadow — label as “Acoustic Shadowing.”)
3. Reverse Shadowing (Posterior Enhancement
Definition:
Reverse shadowing, or posterior acoustic enhancement, is the opposite of shadowing — it appears as an area of increased brightness behind a structure that transmits sound very well.
Cause:
Occurs behind fluid-filled structures (like cysts or bladder) because sound travels easily through them, so more echoes return from deeper tissues.
Appearance:
Bright area beneath a cystic or fluid-filled organ.
Clinical Example:
Seen behind the urinary bladder, simple cysts, or the gallbladder.
📸 Sample Image Suggestion:
(Insert an image of a liver cyst or bladder showing bright enhancement beneath.)
4. Effect of Beam Width
Definition:
Beam width artifact happens when the ultrasound beam is wider than the structure being imaged.
Cause:
Echoes from outside the central beam area are falsely assigned to the wrong location on the image.
Appearance:
Blurring or haziness around small structures.
It may appear as false echoes near cystic margins.
Clinical Example:
Small cysts may appear to have debris inside when actually caused by the beam width effect.
📸 Sample Image Suggestion:
(Insert image showing fuzzy edges of a cyst due to beam width artifact.)
5. Effects of Ascites
Definition:
Ascites (free fluid in the abdomen) affects how sound travels and reflects.
Effect:
Fluid provides an acoustic window, improving visualization of abdominal organs.
May cause enhanced echoes or floating artifacts due to moving bowel loops.
Clinical Example:
Helps visualize the liver and spleen more clearly in ascitic patients.
It can also cause misinterpretation of organ boundaries.
📸 Sample Image Suggestion:
(Insert image showing anechoic (black) ascitic fluid between bowel loops and liver surface.)
II. ANATOMICAL PRESENTATION DURING REAL-TIME SCANNING
Ultrasound allows real-time visualization of anatomical structures, their movements, and possible abnormalities. Two common specialized applications are cranial and eye (ocular) ultrasound.
A. Cranial Ultrasound
Definition:
Cranial ultrasound uses sound waves to visualize the brain structures, mostly in infants whose fontanelles are still open.
Anatomy Visualized:
Lateral ventricles
Third and fourth ventricles
Cerebellum
Corpus callosum
Choroid plexus
Midline structures
Indications:
Detection of intraventricular hemorrhage
Hydrocephalus (fluid accumulation in the brain ventricles)
Periventricular leukomalacia
Brain malformations
Monitoring premature infants
Probe Used:
Sector or phased-array transducer
Frequency: 5–7.5 MHz (higher for neonates)
Technique:
Patient (infant) lies supine.
Apply coupling gel on the anterior fontanelle (soft spot).
Scan in coronal and sagittal planes through the fontanelle.
Adjust gain and depth for clear ventricular and midline visualization.
Common Pathologies and Sample Images:
Hydrocephalus – enlarged ventricles filled with fluid.
📸 (Insert image showing dilated ventricles labeled “Hydrocephalus.”)Intraventricular Hemorrhage – echogenic (bright) clots inside ventricles.
📸 (Insert image showing bright spots in ventricles labeled “IVH.”)Cystic Lesions or Abscesses – fluid-filled cavities with enhancement.
📸 (Insert labeled image “Cerebral Cyst.”)
B. Eye (Ocular) Ultrasound
Definition:
Ocular ultrasound is used to visualize the structures within the eye and orbit using high-frequency probes.
Anatomy Visualized:
Cornea
Lens
Retina and vitreous body
Optic nerve
Orbital muscles and fat
Indications:
Retinal detachment
Vitreous hemorrhage
Ocular tumors or masses
Foreign bodies
Optic nerve swelling (papilledema)
Probe Used:
High-frequency linear probe (7.5–12 MHz)
Small footprint for orbital scanning.
Technique:
Patient closes the eye gently.
Apply a small amount of sterile gel over the closed eyelid.
Use light contact to avoid pressure on the eye.
Scan in transverse and longitudinal planes.
Adjust depth and focus for posterior chamber visualization.
Common Pathologies and Sample Images:
Retinal Detachment – appears as a bright, curved membrane floating within the vitreous.
📸 (Insert labeled image “Retinal Detachment.”)Vitreous Hemorrhage – low-level echoes filling the vitreous cavity.
📸 (Insert labeled image “Vitreous Hemorrhage.”)Ocular Tumor (Melanoma) – solid mass with internal echoes.
📸 (Insert labeled image “Ocular Melanoma.”)
III. Summary (by the Old Pro 🧓)
Artifacts remind us that not everything seen on an ultrasound screen is real — sometimes, it’s physics playing tricks on our eyes.
Learning to recognize and interpret these artifacts separates the student from the skilled sonographer.
Reverberation shows repeated echoes.
Shadowing hides what’s behind dense structures.
Posterior enhancement brightens areas behind fluid.
Beam width distorts small details.
Ascites changes how we see abdominal organs.
Meanwhile, real-time cranial and ocular scanning proves how powerful ultrasound is — letting us see the brain and eyes safely, without radiation.
Every echo tells a story — our job is to listen carefully and know what’s real and what’s an artifact.
Group 6
THYROID AND BREAST ULTRASOUND
I. THYROID ULTRASOUND
A. Anatomy
The thyroid gland is a butterfly-shaped organ located in the lower front part of the neck, just below the Adam’s apple.
It consists of:
Two lobes (right and left) are connected by a thin bridge called the isthmus.
Lies anterior to the trachea and below the larynx.
Surrounded by important structures like the carotid arteries, jugular veins, and parathyroid glands (small, round glands at the posterior surface).
🧠 Function: The thyroid produces hormones (T3 and T4) that regulate metabolism, growth, and energy use.
B. Indications
Thyroid ultrasound is done to:
Evaluate enlargement (goiter)
Detect nodules, cysts, or tumors
Assess thyroiditis (inflammation)
Guide fine-needle aspiration biopsy (FNAB)
Monitor post-surgical or cancer follow-up
C. Probe Used
High-frequency linear transducer:
7.5–15 MHz
→ provides excellent resolution for superficial structures like the thyroid.
D. Techniques / Procedure
Patient Preparation:
No fasting required.
Remove necklaces; expose the neck area.
Pillow under shoulders to slightly extend the neck.
Patient Position:
Supine position with the neck slightly extended.
The sonographer stands beside the patient’s head.
Scanning Planes:
Transverse (cross-section): Shows both lobes and isthmus.
Longitudinal (sagittal): Measures lobe length and evaluates texture.
Procedure Steps:
Apply coupling gel to the anterior neck.
Start scanning from the superior pole to the inferior pole of each lobe.
Assess echogenicity, size, and vascularity.
Compare both lobes for symmetry.
If nodules are seen → measure 3 dimensions (L × W × H) and check calcifications, borders, and blood flow (using Doppler mode).
E. Normal Ultrasound Appearance
Homogeneous (evenly gray) echotexture.
Smooth margins.
Slightly hyperechoic (brighter) than adjacent muscles.
📸 Sample Image Description:
A normal thyroid appears as a smooth, symmetric structure with fine, uniform echoes; the trachea appears as a dark circular shadow in the midline.
F. Common Thyroid Pathologies
Pathology | Description | Ultrasound Appearance | (Sample Image Description) |
|---|---|---|---|
Goiter | Enlarged thyroid gland | Enlarged, may be heterogeneous | Lobulated outline, mixed echoes |
Thyroid cyst | Fluid-filled sac | Anechoic (black), thin wall, posterior enhancement | Round black area in the thyroid |
Thyroiditis (e.g., Hashimoto’s) | Inflammation due to an autoimmune attack | Heterogeneous, hypoechoic, increased vascularity | “Patchy” thyroid pattern |
Thyroid nodule (benign) | Localized overgrowth of tissue | Solid or mixed echo, smooth border | Oval mass inside lobe |
Thyroid carcinoma | Malignant tumor | Irregular margins, microcalcifications, hypoechoic | Small solid lesion with bright white dots |
Thyroid metastasis | Spread from other cancers | Multiple hypoechoic nodules | Several irregular gray spots |
II. BREAST ULTRASOUND
A. Anatomy
The breast is composed of:
Lobes and lobules (milk-producing glands)
Ducts (carry milk to nipple)
Adipose tissue (fat)
Fibrous connective tissue
Lies over the pectoralis major muscle, extending from the 2nd to the 6th ribs.
🧠 Function: To produce and transport milk; also part of the hormonal balance in females.
B. Indications
Palpable breast lump or mass
Pain or tenderness
Nipple discharge
Screening in young women with dense breasts
Follow-up after mammography or biopsy
Guidance for cyst aspiration or needle biopsy
C. Probe Used
High-frequency linear transducer (7.5–15 MHz)
→ Ensures high-resolution imaging for superficial breast structures.
D. Techniques / Procedure
Patient Preparation:
No special prep needed.
Remove upper garments and jewelry.
Patient lies on her back with the arm raised behind her head (side to be scanned).
Position:
Supine oblique with a pillow under the shoulder to flatten the breast.
Procedure Steps:
Apply generous gel.
Use radial and anti-radial planes (like spokes of a wheel).
Scan the entire breast, including the axillary tail (underarm).
Evaluate size, shape, margins, echogenicity, and posterior acoustic features.
Use Doppler mode for vascular lesions.
E. Normal Ultrasound Appearance
Skin: Thin, echogenic (bright) line.
Subcutaneous fat: Hypoechoic (dark).
Glandular tissue: Mixed echogenic pattern.
Cooper’s ligaments: Echogenic linear structures.
📸 Sample Image Description:
A normal breast ultrasound shows alternating bright and dark layers—skin, glandular tissue, fat, and muscle.
F. Common Breast Pathologies
Pathology | Description | Ultrasound Appearance | (Sample Image Description) |
|---|---|---|---|
Simple cyst | Benign fluid-filled sac | Anechoic (black), smooth walls, posterior enhancement | Round dark area |
Fibroadenoma | Common benign solid tumor | Oval, well-defined, homogenous, parallel to the skin | Smooth oval gray mass |
Abscess / Mastitis | Infection or inflammation | Irregular, fluid with debris, hypervascular | Mixed echoes with thick walls |
Breast carcinoma | Malignant lesion | Irregular, hypoechoic, spiculated margins, shadowing | Star-shaped or rough-edged dark mass |
Fat necrosis | Injury-related | Complex mass, calcified | Irregular bright echoes |
Intraductal papilloma | Growth inside the milk duct | Small solid mass within the duct | Bright spot along the duct pathway |
G. Real-Time Technique Observation
Move the probe slowly and adjust the gain for better tissue contrast.
Compare with the opposite breast for asymmetry.
Record suspicious findings in multiple planes.
🧠 Summary Table
Exam | Probe | Patient Position | Common Indications | Key Findings |
|---|---|---|---|---|
Thyroid Ultrasound | 7.5–15 MHz Linear | Supine, neck extended | Goiter, nodule, thyroiditis | Homogeneous gland or nodules |
Breast Ultrasound | 7.5–15 MHz Linear | Supine oblique, arm raised | Mass, pain, discharge, follow-up | Cyst, fibroadenoma, carcinoma |
💡 Important Notes
Both thyroid and breast ultrasounds use no radiation — they’re safe and noninvasive.
Doppler mode adds blood flow information, helpful in detecting tumors and inflammation.
Consistency and comparison with prior studies are key to accurate diagnosis.
Group 7
LIVER, GALLBLADDER, SPLEEN, PANCREAS, WHOLE ABDOMEN, HBT, AND UPPER ABDOMEN ULTRASOUND
I. LIVER ULTRASOUND
A. Anatomy
The liver is the largest internal organ, located in the right upper quadrant of the abdomen beneath the diaphragm.
It has two main lobes (right and left) separated by the falciform ligament and receives blood from:
Hepatic artery (oxygenated blood)
Portal vein (nutrient-rich blood from intestines)
It also produces bile, stores glycogen, and detoxifies harmful substances.
B. Indications
Jaundice or abnormal liver enzymes
Right upper quadrant pain
Hepatomegaly (enlarged liver)
Suspicion of fatty liver, cirrhosis, cysts, or tumors
Monitoring of chronic liver disease
Pre- or post-operative evaluation
C. Probe Used
Curvilinear transducer, frequency 3–5 MHz (for general liver survey)
A linear probe (7–10 MHz) may be used for superficial lesions.
D. Patient Preparation & Position
Fasting for 6–8 hours to reduce bowel gas and distend the gallbladder.
Position: Supine, or left lateral decubitus to access intercostal spaces.
E. Scanning Technique
Start with subcostal and intercostal approaches.
Examine the right and left lobes, portal vein, hepatic veins, and biliary tree.
Evaluate echogenicity, size, surface contour, and vascular structures (using Doppler).
F. Normal Appearance
Homogeneous medium-level echoes
Smooth margins
Size: about 13–15 cm (midclavicular line)
G. Common Pathologies
Pathology | Description | Ultrasound Appearance |
|---|---|---|
Fatty liver (Hepatic steatosis) | Fat accumulation in liver cells | Hyperechoic (brighter), sound attenuation |
Cirrhosis | Chronic scarring and fibrosis | Coarse texture, irregular surface, nodular contour |
Liver cyst | Benign fluid-filled lesion | Anechoic (black), thin walls, posterior enhancement |
Hepatoma (HCC) | Malignant tumor | Hypoechoic/heterogeneous, irregular border, vascular |
Metastasis | Secondary cancer deposits | Multiple irregular lesions, target appearance |
📸 Sample Image:
Fatty liver: liver brighter than the kidney.
Cyst: a round black circle with a bright back wall.
HCC: irregular gray mass with internal blood flow.
II. GALLBLADDER ULTRASOUND
A. Anatomy
The gallbladder is a pear-shaped sac located under the right lobe of the liver.
It stores and concentrates bile, which aids in the digestion of fats.
B. Indications
Right upper quadrant pain
Jaundice
Suspected gallstones (cholelithiasis)
Gallbladder inflammation (cholecystitis)
C. Probe Used
Curvilinear transducer (3–5 MHz)
D. Patient Prep & Position
Fasting for 6–8 hours for gallbladder distension.
Supine and left lateral decubitus positions are used to shift stones.
E. Technique
Scan longitudinally and transversely.
Identify neck, body, and fundus.
Look for stones, wall thickening, or sludge.
Use Doppler to differentiate vessels from ducts.
F. Pathologies
Pathology | Description | Ultrasound Appearance |
|---|---|---|
Cholelithiasis | Gallstones | Echogenic foci with acoustic shadowing |
Cholecystitis | Inflammation | Thick wall (>3mm), pericholecystic fluid, positive Murphy sign |
Sludge | Bile stasis | Low-level echoes, no shadow |
Polyps | Small growths | Echogenic, non-shadowing, fixed to the wall |
📸 Sample Image:
Gallstones appear as bright white dots with dark acoustic shadows beneath them.
III. SPLEEN ULTRASOUND
A. Anatomy
The spleen lies in the left upper quadrant (LUQ), posterior to the stomach and under the diaphragm.
It filters blood, stores red cells, and helps with immune function.
B. Indications
Trauma (suspected rupture)
Splenomegaly (enlargement)
Blood disorders (anemia, leukemia)
C. Probe Used
Curvilinear (3–5 MHz)
D. Technique
Scan in left lateral decubitus or right oblique position.
Examine length, texture, and vessels.
E. Normal Appearance
Crescent shape, homogenous echotexture
Slightly more echogenic than the liver
Size: 8–12 cm long
F. Pathologies
Pathology | Description | Ultrasound Appearance |
|---|---|---|
Splenomegaly | Enlarged spleen | Increased length >12 cm |
Splenic cyst/abscess | Fluid collection | Anechoic or complex mass |
Rupture (trauma) | Injury | Irregular contour, free fluid |
📸 Sample Image:
Enlarged spleen fills LUQ; cyst shows a black circular lesion.
IV. PANCREAS ULTRASOUND
A. Anatomy
The pancreas lies behind the stomach, extending from the duodenum (head) to the spleen (tail).
It produces digestive enzymes and insulin.
B. Indications
Epigastric pain
Suspected pancreatitis or cyst
Diabetes assessment
Pancreatic tumor
C. Probe
Curvilinear (3–5 MHz)
Higher frequency (7–10 MHz) for thin patients
D. Technique
Fasting for 6–8 hrs to reduce gas.
Use the left lobe of the liver as an acoustic window.
Scan transversely and longitudinally.
E. Normal Appearance
Homogeneous, slightly hyperechoic compared to liver.
Head, body, and tail visible.
F. Pathologies
Pathology | Description | Ultrasound Appearance |
|---|---|---|
Pancreatitis | Inflammation | Enlarged, hypoechoic, irregular margins |
Pancreatic cyst | Fluid-filled sac | Anechoic, well-defined |
Pancreatic cancer | Malignant tumor | Hypoechoic mass, ductal dilation |
Calcification | Chronic pancreatitis | Bright foci with shadowing |
📸 Sample Image:
The inflamed pancreas looks swollen and dark; the cyst appears round and black.
V. WHOLE ABDOMEN ULTRASOUND
A. Purpose
A comprehensive examination covering all major abdominal organs — liver, gallbladder, pancreas, spleen, kidneys, bladder, and aorta.
B. Indications
Abdominal pain, mass, or trauma
General health screening
Preoperative evaluation
C. Probe & Prep
Curvilinear (3–5 MHz)
Fasting 6–8 hrs
D. Technique
Systematic scanning from RUQ → LUQ → pelvis.
Evaluate organ size, echotexture, vascularity, and presence of masses or fluids.
VI. HEPATOBILIARY TRACT (HBT) ULTRASOUND
A. Focus
Examines the liver, gallbladder, and bile ducts to assess bile flow and detect obstruction.
B. Indications
Jaundice, biliary obstruction
Gallstones
Biliary atresia in infants
C. Technique
Trace the common bile duct (CBD) from the porta hepatis to the pancreas.
Measure CBD (normal: ≤6 mm adults).
Check for dilatation or stones.
VII. UPPER ABDOMEN ULTRASOUND
A. Includes
Liver, gallbladder, pancreas, spleen, and kidneys (upper poles).
B. Indications
Epigastric or RUQ pain
Vomiting, suspected ulcer, or tumor
C. Technique
Same as the whole abdomen but focused on the upper quadrant organs.
🧠 SUMMARY TABLE
Organ | Probe | Position | Prep | Key Findings |
|---|---|---|---|---|
Liver | 3–5 MHz Curvilinear | Supine/Lt. decubitus | Fasting | Fatty liver, HCC |
Gallbladder | 3–5 MHz Curvilinear | Supine/Lt. decubitus | Fasting | Stones, cholecystitis |
Spleen | 3–5 MHz Curvilinear | Rt. oblique | Fasting | Splenomegaly |
Pancreas | 3–5 MHz Curvilinear | Supine | Fasting | Pancreatitis, cyst |
Whole Abdomen | 3–5 MHz Curvilinear | Supine | Fasting | Survey of all organs |
HBT | 3–5 MHz Curvilinear | Supine | Fasting | Bile duct obstruction |
Upper Abdomen | 3–5 MHz Curvilinear | Supine | Fasting | Liver, GB, pancreas, spleen |
Group 8
I. HEART AND VASCULAR ULTRASOUND
Purpose:
Evaluation of cardiac structure, function, and major vessels to detect abnormalities in heart chambers, valves, and blood flow.
Probe:
Phased-array transducer (2–5 MHz for adults)
Technique:
Patient supine or left lateral decubitus
Standard echocardiographic windows: parasternal, apical, subcostal, suprasternal
Use 2D imaging, Doppler, and M-mode for a comprehensive assessment
II. 2D ECHOCARDIOGRAPHY WITH DOPPLER
Purpose:
Assess heart chambers, wall motion, and valve morphology
Measure blood flow velocity and direction
Doppler Techniques:
Color Doppler: visualizes flow patterns, detects regurgitation or shunts
Spectral Doppler: quantifies flow velocity (continuous-wave or pulsed-wave)
Clinical Indications:
Valvular heart disease
Heart failure
Congenital heart defects
Murmur evaluation
Images Placeholder:
📎 2D Echo with Doppler showing mitral regurgitation

III. 2D ECHOCARDIOGRAPHY WITH LV STRAIN
Purpose:
Quantitative assessment of left ventricular (LV) myocardial deformation
Detects early systolic dysfunction before EF decreases
Technique:
2D speckle-tracking echocardiography
Longitudinal, circumferential, and radial strain measured
Clinical Indications:
Chemotherapy monitoring
Subclinical cardiomyopathy
Ischemic heart disease
Images Placeholder:
📎 LV Strain bullseye map
IV. LOWER EXTREMITY ARTERIAL AND VENOUS DUPLEX SCAN
Purpose:
Evaluate arterial flow for stenosis/occlusion
Detect venous thrombosis or insufficiency
Probe:
Linear transducer (5–12 MHz)
Use color, spectral, and B-mode imaging
Technique:
Supine or slightly rotated
Scan common femoral, superficial femoral, popliteal, posterior tibial, and dorsalis pedis vessels
Clinical Indications:
Peripheral arterial disease
Deep vein thrombosis (DVT)
Chronic venous insufficiency
Images Placeholder:
📎 Lower extremity arterial stenosis
📎 DVT in the femoral vein


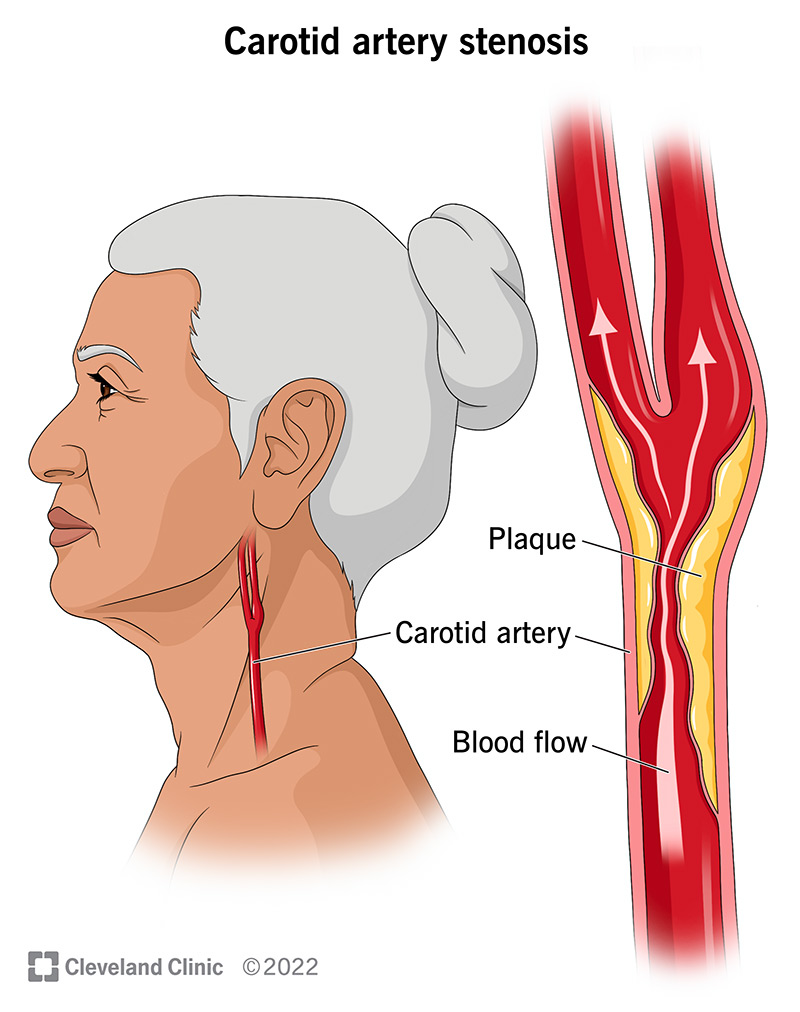
V. CAROTID DUPLEX SCAN
Purpose:
Assess carotid arteries for stenosis or plaque formation
Evaluate risk for stroke
Probe:
Linear transducer (7–12 MHz)
Technique:
Supine with neck slightly extended
Scan the common carotid, internal carotid, and external carotid in longitudinal and transverse planes
Clinical Indications:
Carotid atherosclerosis
Transient ischemic attack (TIA) or stroke risk
Images Placeholder:
📎 Carotid plaque with stenosis
VI. UPPER EXTREMITY ARTERIAL AND VENOUS DUPLEX SCAN
Purpose:
Detect arterial stenosis or occlusion
Evaluate venous thrombosis or insufficiency
Technique:
Linear probe, patient supine with arm slightly abducted
Assess subclavian, axillary, brachial, radial, and ulnar vessels
Clinical Indications:
Upper limb ischemia
Catheter-related thrombosis
Venous insufficiency
Images Placeholder:
📎 Upper extremity arterial stenosis
📎 Upper extremity DVT
VII. 24-HOUR HOLTER MONITORING
Purpose:
Continuous ECG monitoring over 24 hours
Detect arrhythmias, pauses, and conduction abnormalities
Technique:
Electrodes applied to the chest
Patient keeps an activity diary
Data analyzed for heart rate variability, arrhythmia frequency
Clinical Indications:
Palpitations
Syncope
Atrial fibrillation screening
Images Placeholder: Holter ECG strip showing ventricular ectopy

VIII. 24-HOUR AMBULATORY BLOOD PRESSURE MONITOR (ABPM)
Purpose:
Continuous blood pressure measurement over 24 hours
Detect hypertension patterns, nocturnal dipping, and white coat hypertension
Technique:
A cuff applied to the upper arm measures at regular intervals
Patient keeps a diary of activities and symptoms
Clinical Indications:
Suspected hypertension
Resistant hypertension
Monitoring therapy effectiveness
Images Placeholder:
🧓 FINAL NOTE FROM A SEASONED CLINICIAN
“The heart and vessels speak in motion and flow. Listen carefully with your eyes, measure precisely, and combine technology with clinical judgment. Machines show patterns, but the patient tells the story.”
Group 9
I. KIDNEY ULTRASOUND
Purpose:
Evaluate renal size, shape, echotexture, and presence of calculi, cysts, obstruction, or masses.
Probe:
Curvilinear transducer (3.5–5 MHz) for adults
Linear probe (5–12 MHz) for superficial evaluation
Technique:
Patient supine or lateral decubitus
Scan the kidneys in longitudinal and transverse planes
Measure renal length, cortical thickness, and echogenicity
Assess renal vessels with Doppler if needed
Normal Appearance:
Smooth, oval shape
Cortex is slightly hypoechoic compared to the liver
Medulla hypoechoic
Renal sinus echogenic
Common Pathologies:
Pathology | Sonographic Features | Image Placeholder |
|---|---|---|
Hydronephrosis | Dilated collecting system | 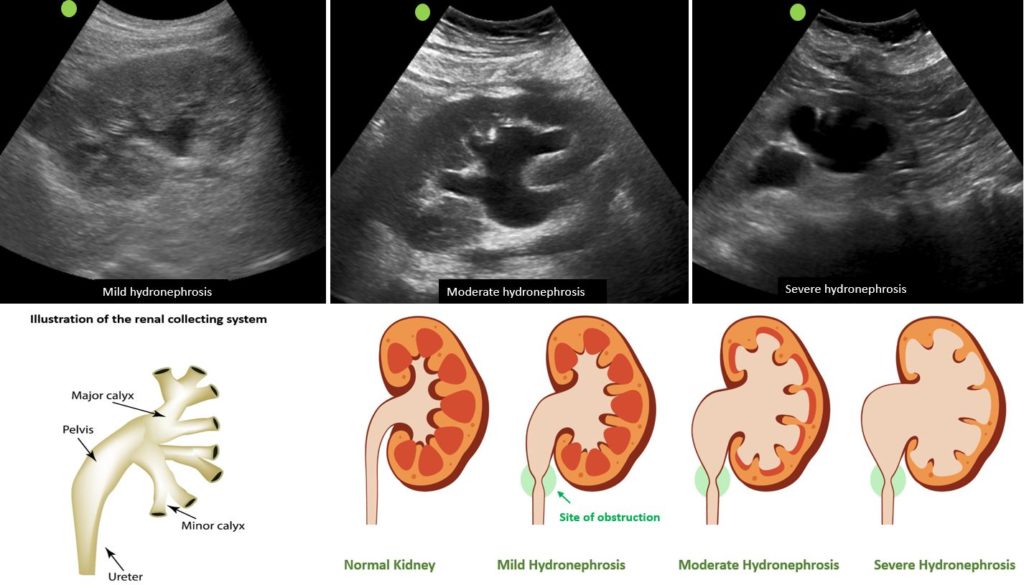 |
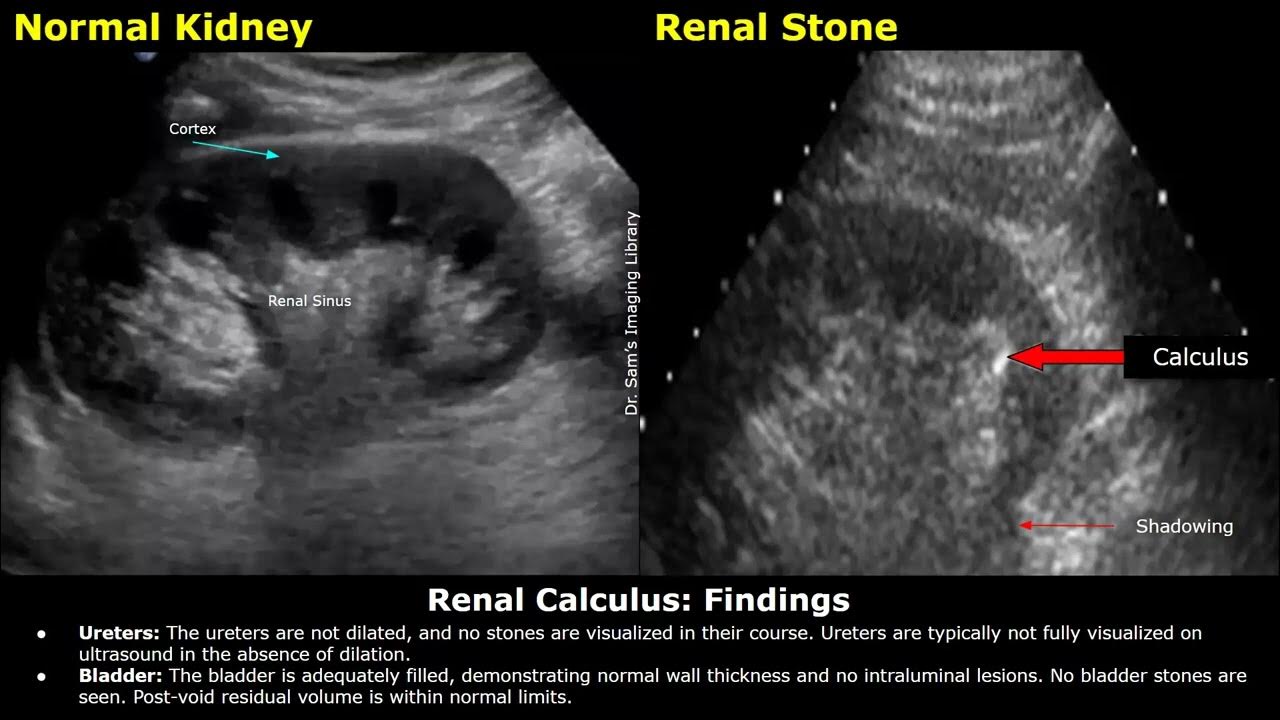
Renal calculi | Echogenic foci with posterior shadowing |  |
Cyst | Anechoic, thin wall, posterior enhancement | 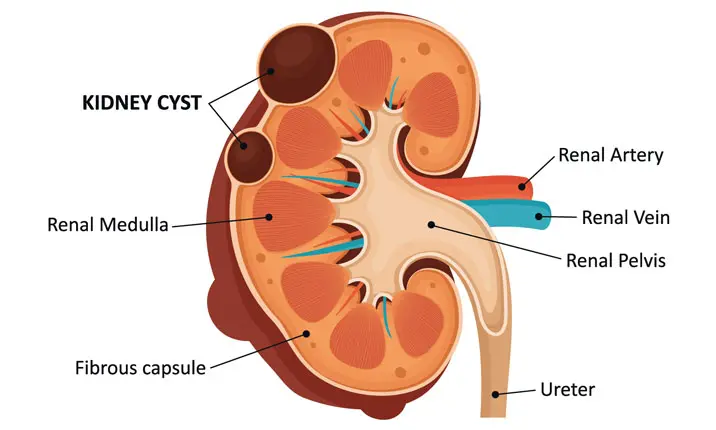 |
Tumor | Solid, heterogeneous mass | 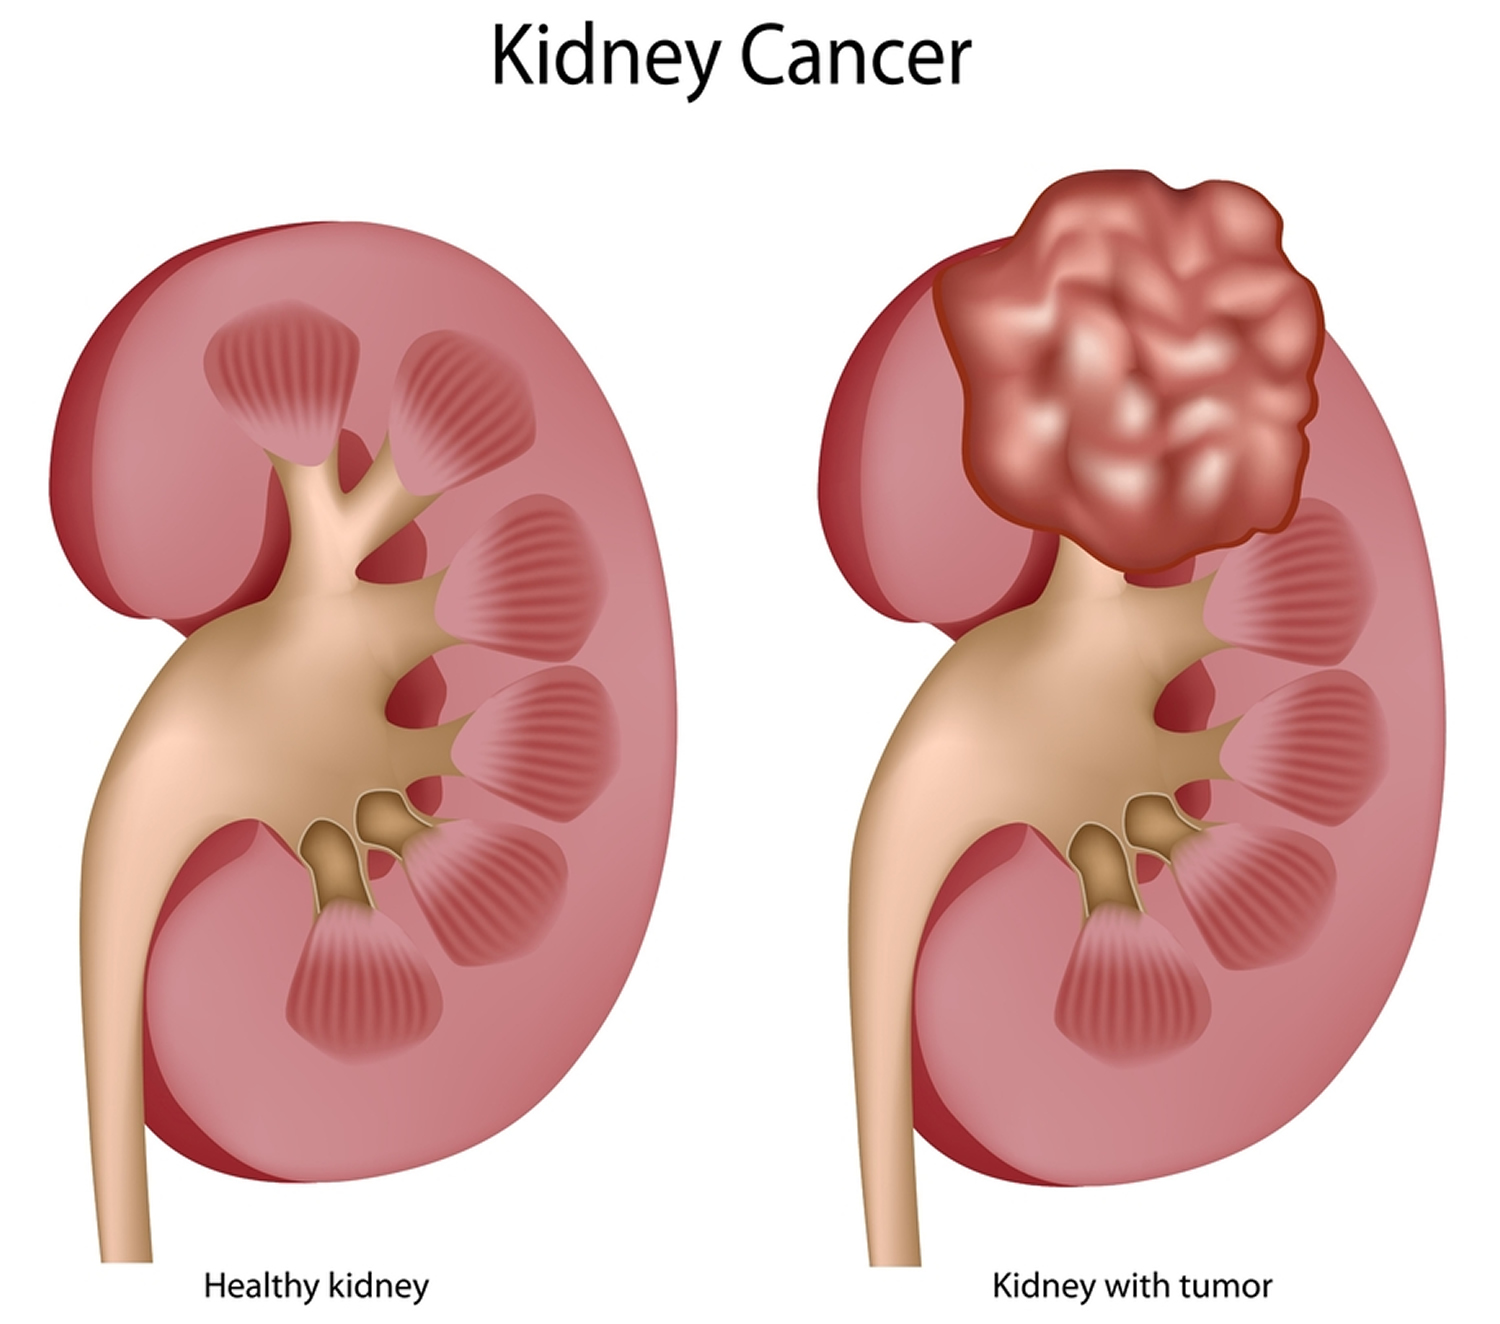 |
II. PROSTATE ULTRASOUND
Purpose:
Assess prostate size, shape, and pathology, including enlargement, nodules, or masses.
Probe:
Transabdominal: Curvilinear (3–5 MHz)
Transrectal (if indicated): Endocavitary probe investigation (5–9 MHz)
Technique:
Patient supine, bladder moderately full (transabdominal)
Scan in transverse and longitudinal planes
Measure prostate volume: (L × W × H × 0.52)
Normal Appearance:
Homogeneous, smooth contour
Symmetrical lobes
Transitional and peripheral zones are distinguishable
Common Pathologies:
Pathology | Sonographic Features | Image Placeholder |
|---|---|---|
Benign prostatic hyperplasia | Enlarged gland, heterogeneous | 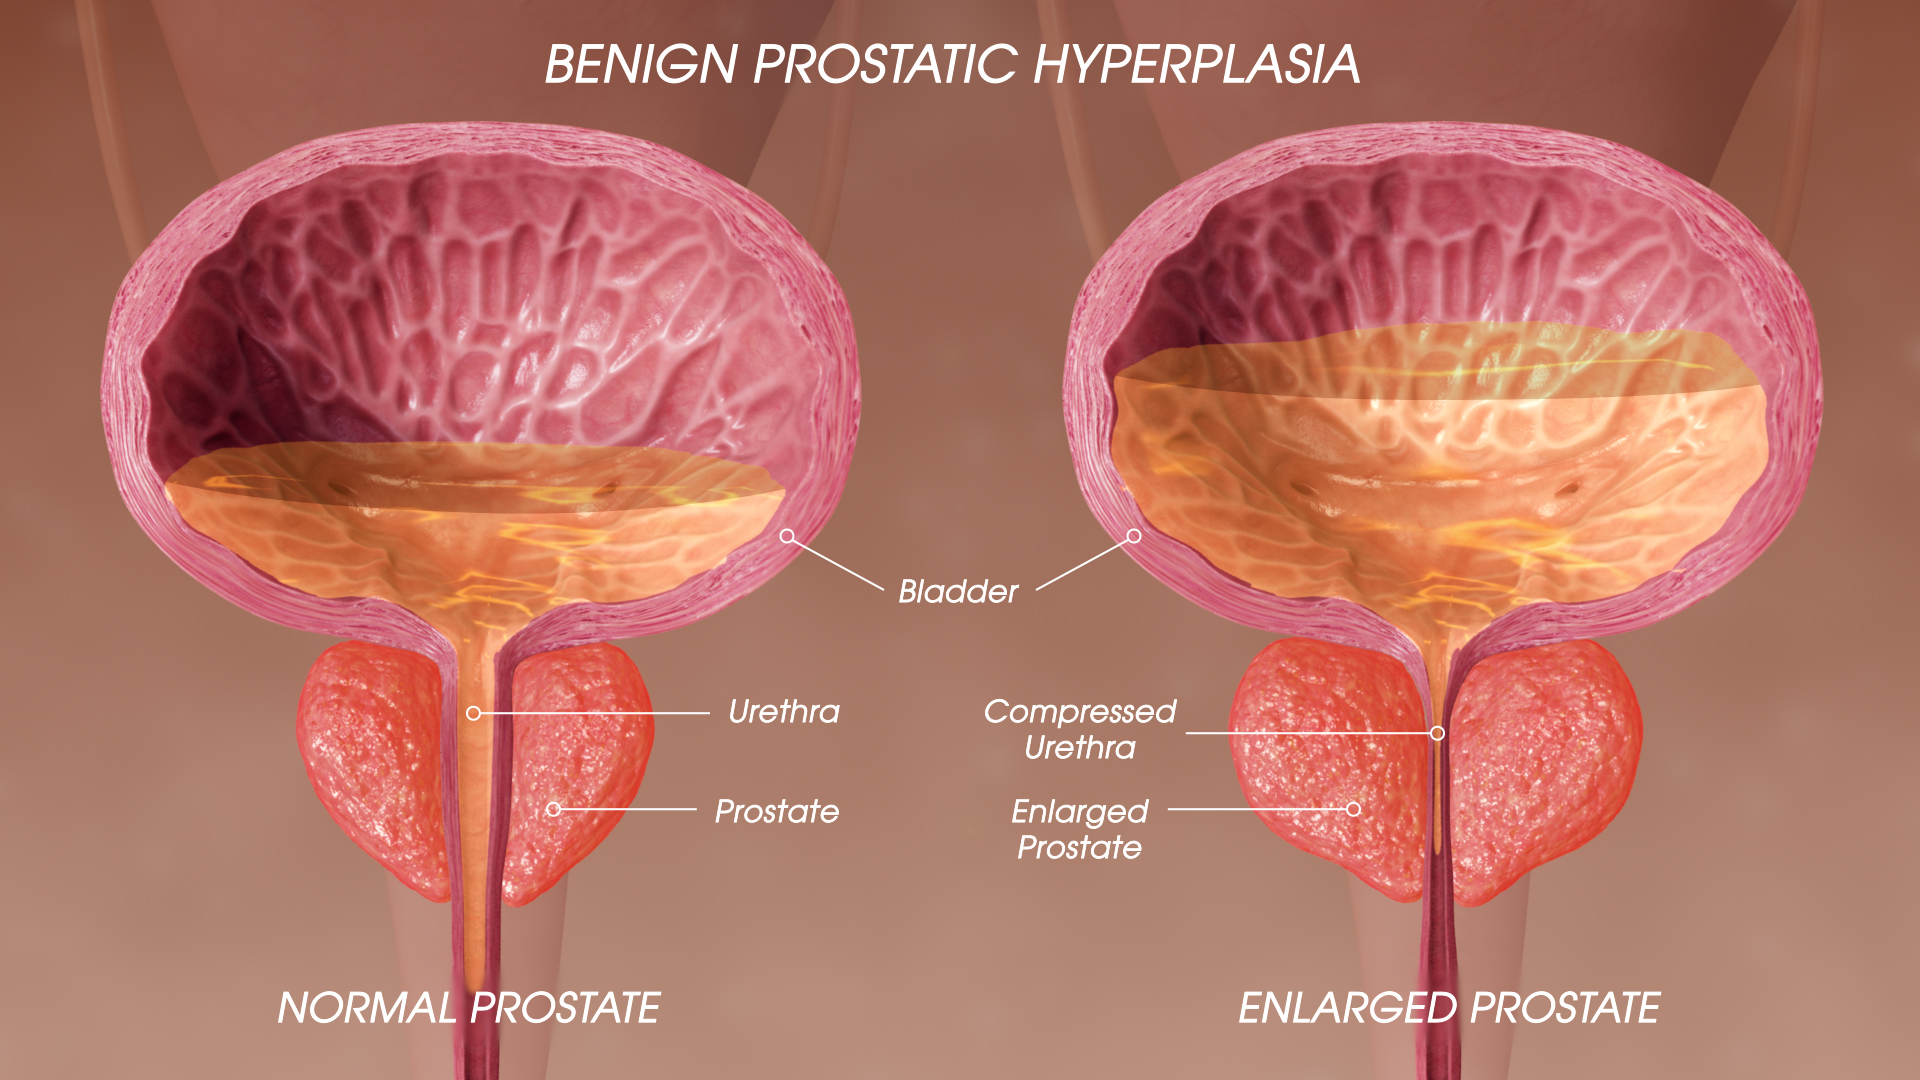 |
Prostate cancer | Hypoechoic focal lesions in the peripheral zone | 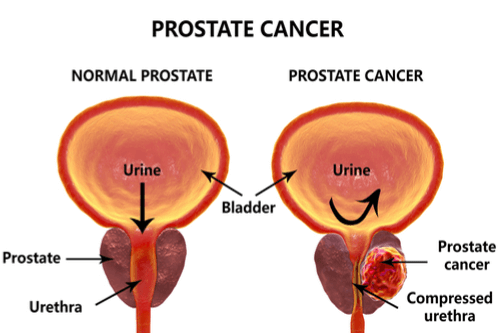 |
Prostatitis | Diffuse hypoechogenicity, ↑ vascularity | 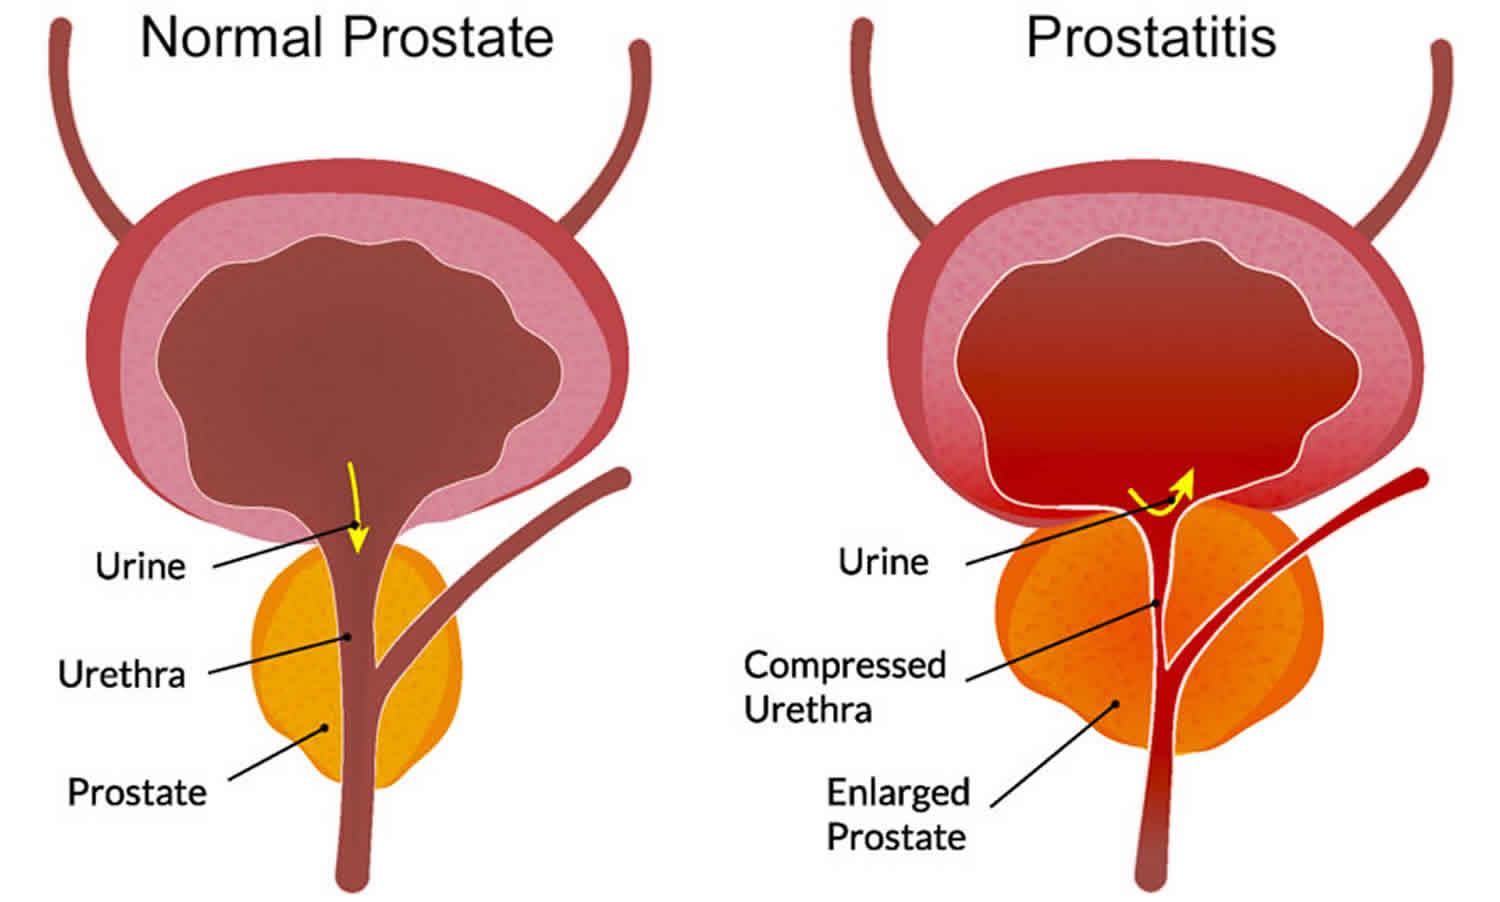 |
III. KUB (KIDNEYS, URETERS, BLADDER) ULTRASOUND
Purpose:
Evaluate kidneys, ureters, and bladder for stones, obstruction, or masses.
Probe:
Curvilinear transducer (3–5 MHz)
Technique:
Supine position
Longitudinal and transverse sweeps of the kidneys, bladder, and ureters, if visible
Evaluate hydronephrosis, stones, bladder volume, and wall
Common Pathologies:
Renal/ureteral stones
Hydronephrosis
Bladder wall thickening
Masses
Images Placeholder:
📎 KUB ultrasound showing renal calculus
IV. LOWER ABDOMEN ULTRASOUND
Purpose:
Assess pelvic organs, including bladder, uterus (if female), prostate (if male), and bowel loops.
Probe:
Curvilinear transducer (3.5–5 MHz)
Technique:
Supine with a full bladder
Scan in transverse and longitudinal planes
Evaluate bladder wall, post-void residual volume, and adjacent structures
Clinical Indications:
Lower abdominal pain
Urinary frequency or obstruction
Pelvic masses or cysts
Common Findings:
Finding | Sonographic Features | Image Placeholder |
|---|---|---|
Bladder wall thickening | Hypoechoic, thickened wall |  |
Prostate enlargement | Enlarged, heterogeneous | |
Cystic pelvic masses | Anechoic, posterior enhancement |  |
Urinary retention | Distended bladder with residual urine |  |
🧓 FINAL NOTE FROM A SENIOR ULTRASONOGRAPHER
“The kidneys and prostate tell stories of obstruction, infection, or growth long before symptoms appear. A careful sweep with the probe, a patient bladder, and a watchful eye reveal the secrets of the lower abdomen.”
Group 10
I. NORMAL FETAL DEVELOPMENT
Purpose:
Evaluate fetal growth, anatomy, position, and overall well-being throughout pregnancy.
1. Fetal Presentation
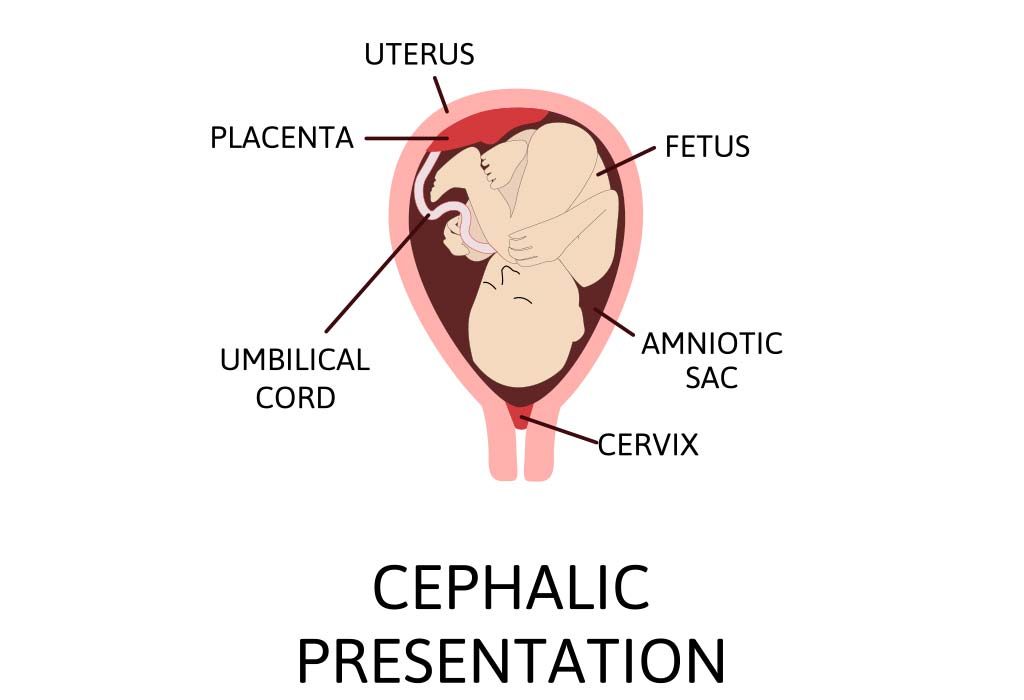
Definition:
The position of the fetus in the uterus relative to the maternal pelvis.
Common Presentations:
Presentation | Description |
|---|---|
Cephalic (vertex) | Head-down, most common at term |
Breech | Buttocks or feet-down |
Transverse | Lying sideways |
Oblique | Between cephalic and transverse |
Technique:
Assessed via TAS or TVS
Identify the head, spine, and limbs orientation
Images Placeholder:
📎 Fetal cephalic presentation
2. Multiple Gestation
Definition:
Pregnancy with two or more fetuses
Key Points:
Identify the number of fetuses, placentas, and amniotic sacs
Assess chorionicity (shared or separate placenta)
Images Placeholder:
📎 Twin gestation with separate placentas

3. Placental Localization
Purpose:
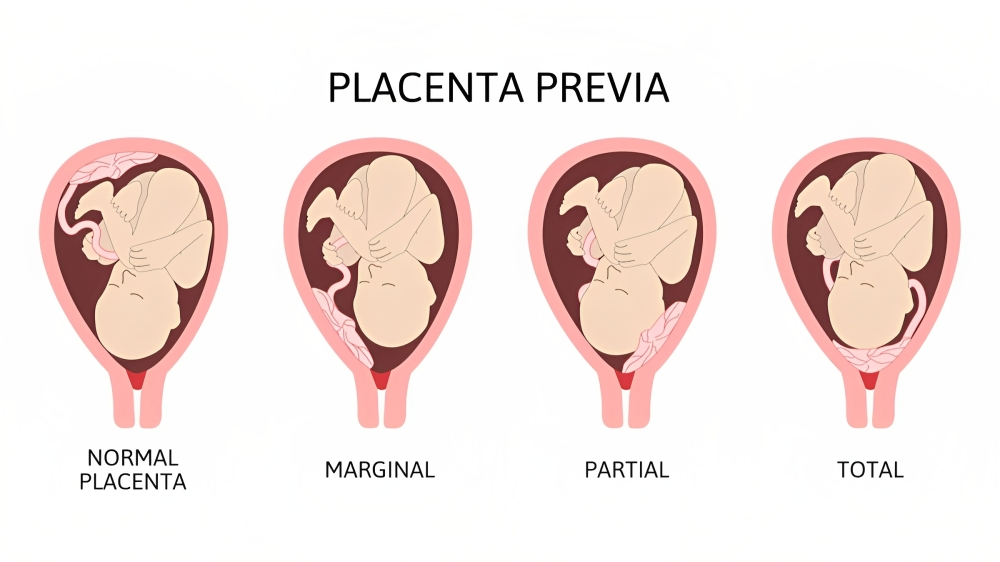
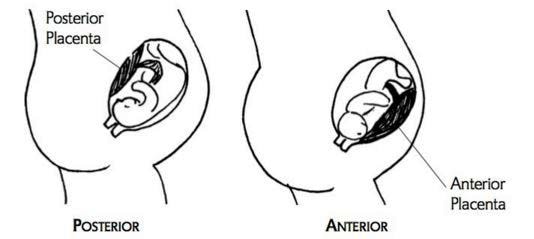
Determine placenta position (anterior, posterior, fundal, previa)
Evaluate placental maturity and abnormalities
Technique:
TAS or TVS if the placenta is low-lying
Document the distance from the cervical os
Images Placeholder:
📎 Placenta previa vs anterior placenta
4. Determination of Age of Gestation (AOG)
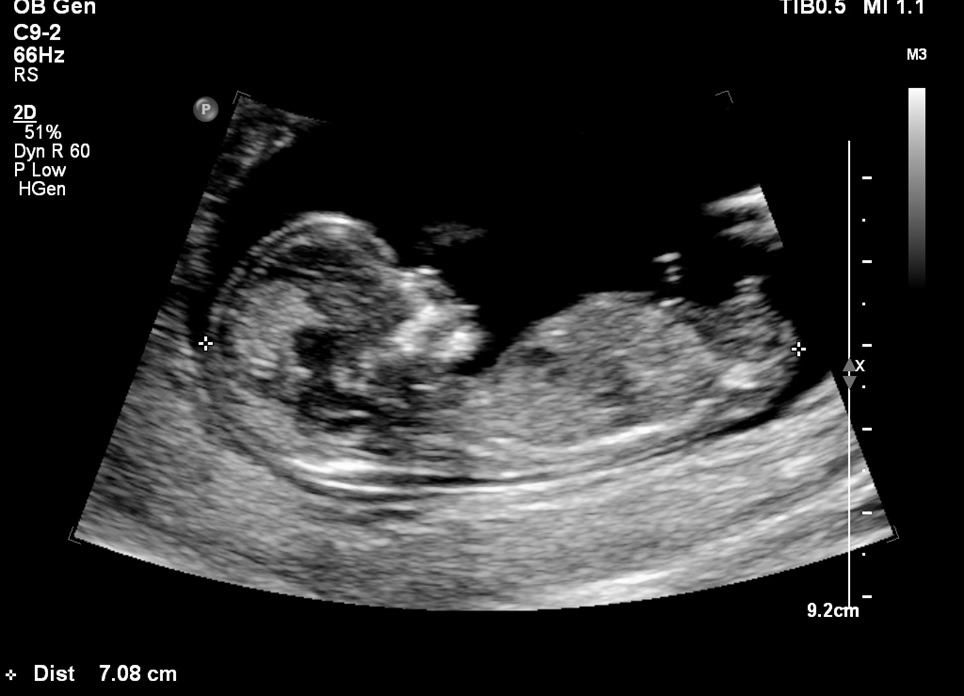
Biometric Parameters:
Parameter | Technique & Significance |
|---|---|
Biparietal diameter (BPD) | Measures fetal head width; reliable after 12 weeks |
Femoral length (FL) | Measures femur; correlates with gestational age |
Crown-rump length (CRL) | Measures fetal length from head to rump; most accurate in the 1st trimester |
Abdominal circumference (AC) | Measures fetal abdomen; estimates fetal weight and growth |
Images Placeholder:
📎 BPD measurement

📎 FL measurement

📎 CRL measurement
📎 AC measurement
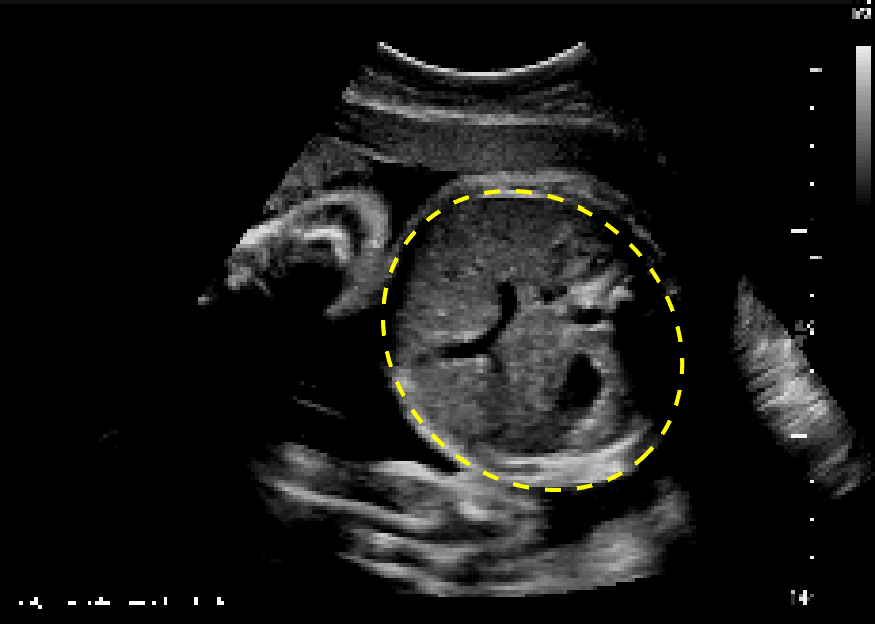
II. ULTRASOUND MODALITIES IN OBSTETRICS
1. Transabdominal (TAS) / Pelvis Ultrasound
Purpose:
Routine fetal assessment and maternal pelvic evaluation
Technique:
A full bladder improves visualization in early pregnancy
Sweep in longitudinal, transverse, and coronal planes
Assess fetal presentation, heart rate, placental position, and amniotic fluid
Probe:
Curvilinear transducer, 3–5 MHz
Images Placeholder:
📎 Transabdominal fetal scan

2. Transvaginal Ultrasound (TVS)
Purpose:
Early pregnancy evaluation (≤12 weeks)
Assess cervix, uterus, and early fetal structures
Technique:
Patient's empty bladder
Endovaginal probe (5–9 MHz)
Evaluate the gestational sac, yolk sac, fetal pole, and cardiac activity
Images Placeholder:
📎 TVS early pregnancy scan

3. Biophysical Profile / BPS Ultrasound
Purpose:
Evaluate fetal well-being in late pregnancy
Components:
Fetal breathing movements
Fetal movements
Fetal tone
Amniotic fluid volume
Optional: non-stress test
Technique:
TAS, observe real-time fetal activity for 30–60 minutes
Images Placeholder:
📎 BPS scoring scan

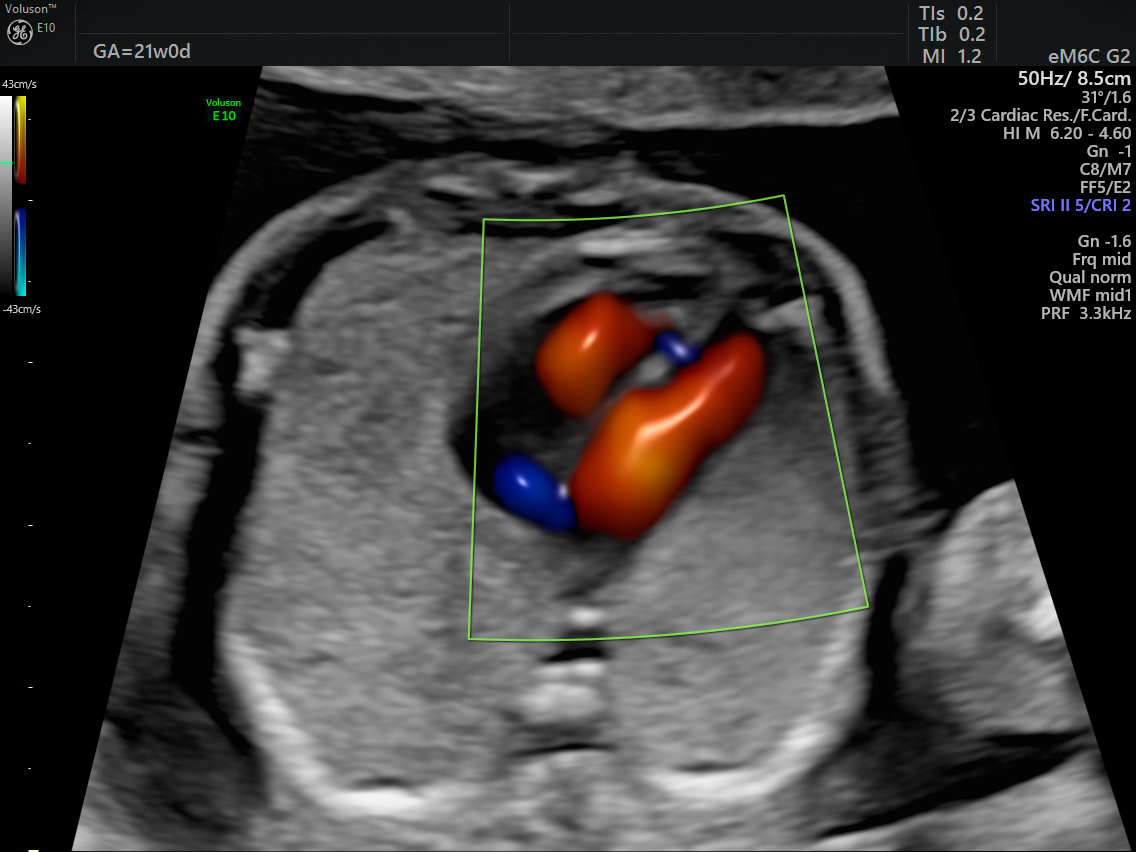
4. Congenital Anomaly Scan
Purpose:
Detect structural fetal anomalies, typically at 18–22 weeks
Technique:
TAS or TVS as indicated
Examine:
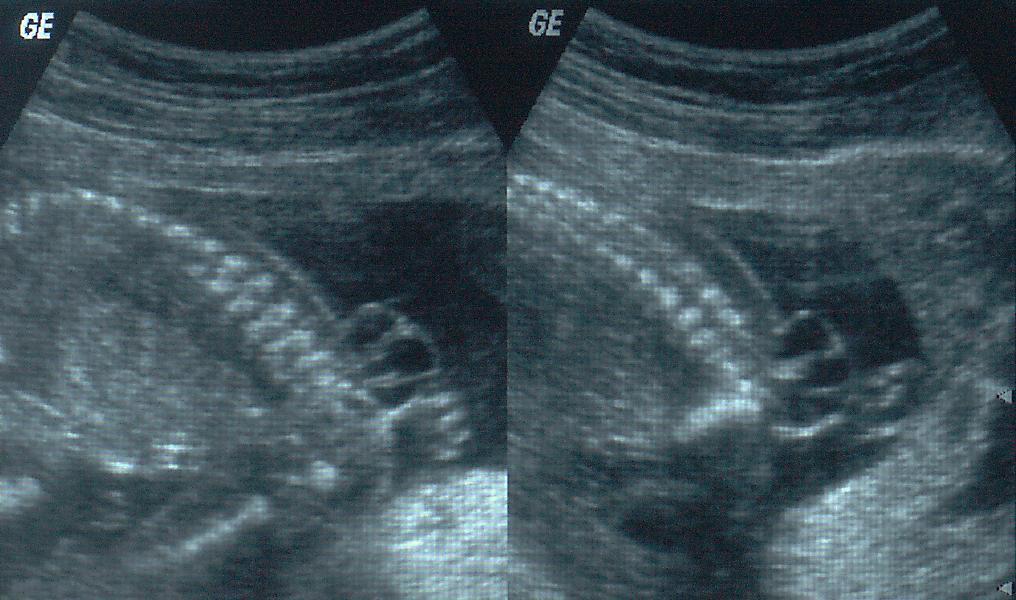
Brain & spine
Face & neck
Heart
Abdomen & kidneys
Limbs
Images Placeholder:
📎 Fetal congenital anomaly scan – heart defect
📎 Neural tube defect scan
🧓 FINAL NOTE FROM AN EXPERIENCED OBSTETRIC SONOGRAPHER
“A healthy fetus reveals itself in motion, growth, and anatomy. Patience, gentle scanning, and knowledge of normal ranges allow early detection of abnormalities, guiding safe pregnancy care.”
Group 11
I. INTERVENTIONAL ULTRASOUND
Interventional ultrasound (US) uses real-time imaging to guide procedures safely and accurately. It reduces risk, improves precision, and allows minimally invasive interventions.
1. Needle-Guidance Techniques
Purpose:
Guide needles accurately to lesions for biopsy, drainage, or injections.
Techniques:
Technique | Description |
|---|---|
In-plane | Needle inserted parallel to US beam; entire needle shaft visible |
Out-of-plane | The needle crosses the US beam perpendicularly; only the tip is seen |
Freehand | The operator manually guides the needle without a mechanical guide |
Needle guide attachment | Pre-set trajectory for more precise entry |
Tips:
Use color Doppler to avoid vessels
Maintain sterile field
Image Placeholder:
📎 In-plane vs out-of-plane needle guidance
2. Biopsies
Purpose:
Obtain tissue samples for histopathology
Common Targets:
Liver, kidney, thyroid, breast, lymph nodes
Technique:
Plan a safe trajectory with the US
Local anesthesia at the puncture site
Real-time US guides biopsy needle to lesion
Take multiple cores if needed
Safety Measures:
Avoid vessels and bowel
Monitor the patient for bleeding
Image Placeholder:
📎 US-guided liver biopsy

3. Aspiration and Drainage Procedures
Purpose:
Remove fluid collections such as abscesses, cysts, or pleural effusions
Technique:
Use the US to locate fluid collection
Sterile prep and local anesthesia
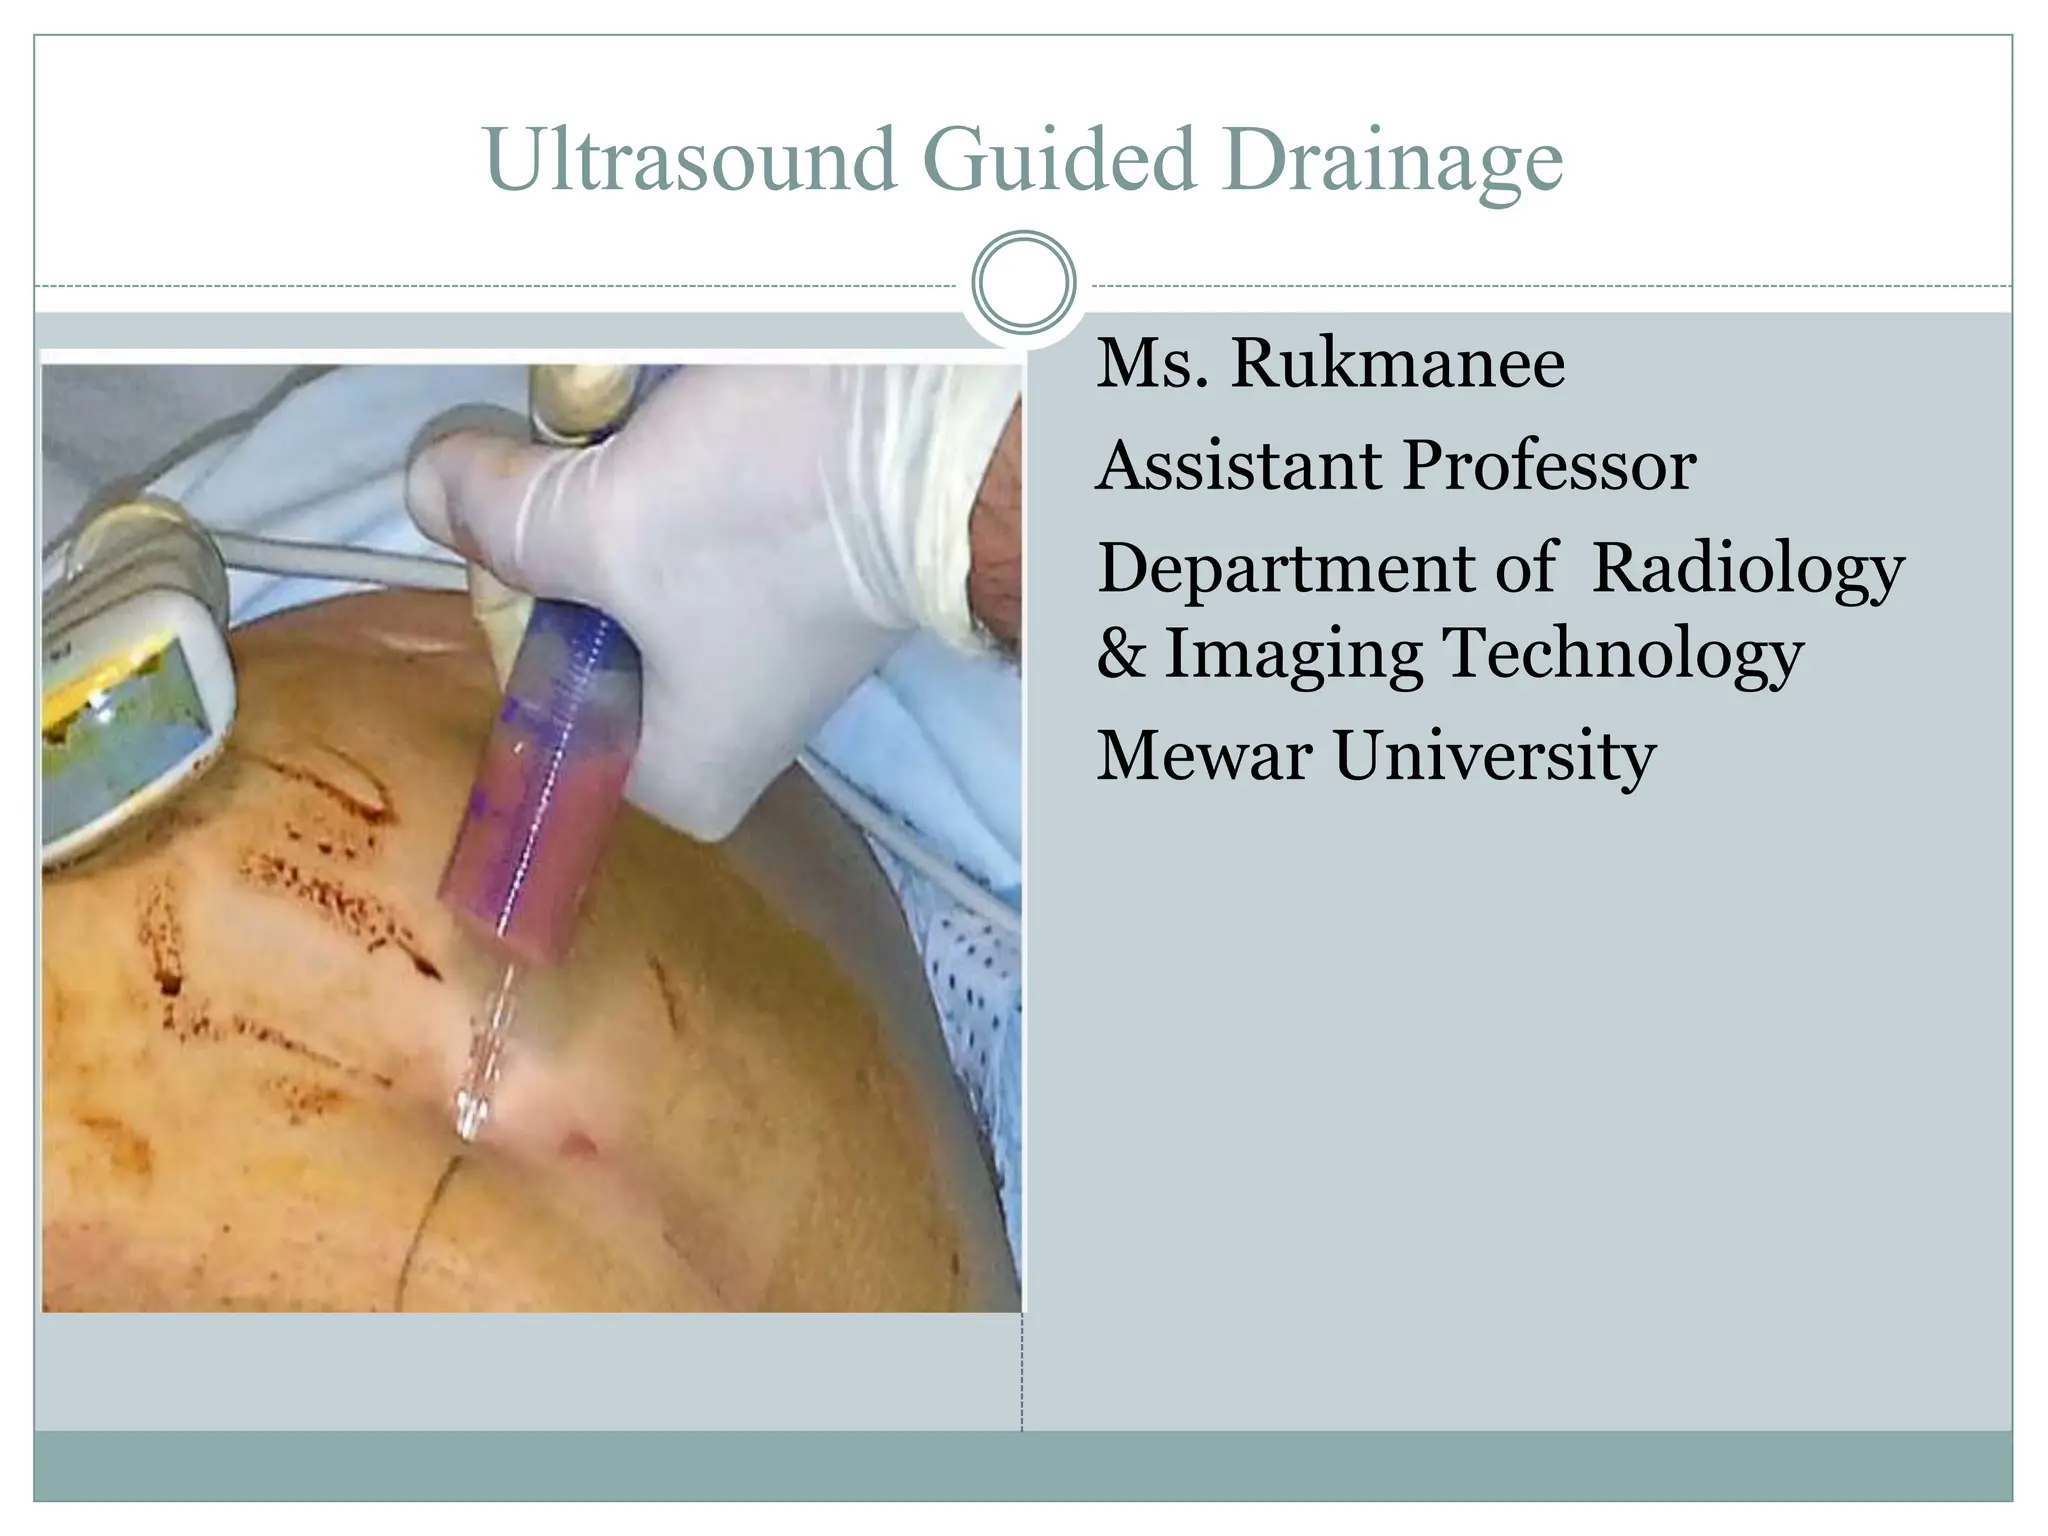
Needle or catheter inserted under US guidance
Aspirate fluid or place a drainage catheter
Benefits:
Minimally invasive
Reduced complications
Immediate fluid assessment
Image Placeholder:
📎 US-guided abscess drainage
4. Interventional Ultrasound in Obstetrics
Applications:
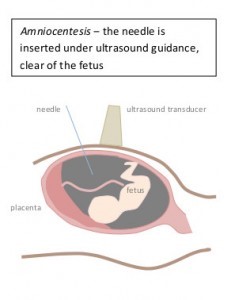
Amniocentesis – sample amniotic fluid for genetic testing
Chorionic villus sampling (CVS) – placental tissue biopsy
Fetal interventions – drainage of cystic lesions or pleural effusions
Technique:
TVS or TAS is used for real-time needle guidance
Avoid fetal and maternal vessels
Maintain a sterile environment
Image Placeholder:
📎 US-guided amniocentesis
II. QUALITY CONTROL IN ULTRASONOGRAPHY
Purpose:
Ensure accuracy, safety, and reliability of ultrasound imaging
Maintain high standards for diagnosis and patient care
Key Components
Component | Description |
|---|---|
Equipment checks | Verify probe function, image uniformity, resolution, and Doppler accuracy |
Calibration | Regular testing of machine output, power, and sensitivity |
Image quality assessment | Evaluate contrast, penetration, and artifact presence |
Operator competency | Training, certification, and ongoing skill assessment |
Documentation | Maintain logs of equipment maintenance and QA testing |
Radiation safety | Although the US is non-ionizing, the ALARA principle applies to Doppler in obstetrics |
Common Quality Control Tests:
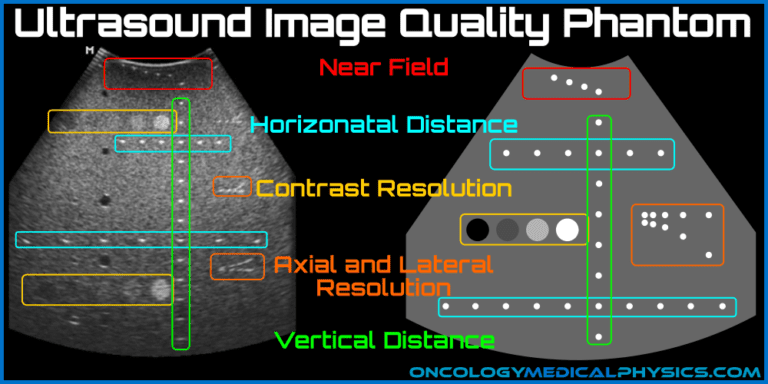
Phantom testing – simulates tissue for resolution and penetration
Transducer performance test – detects dead elements or signal degradation
Doppler accuracy test – ensures correct velocity measurement
Image Placeholder:
📎 US phantom testing
🧓 FINAL NOTE FROM A SEASONED SONOGRAPHER
“Ultrasound is not just about imaging; it is about guiding decisions safely. Interventions under US should be precise, cautious, and quality-controlled. Every needle, every image matters for patient care.”