Chapter 19: Financial Ratios
The importance of financial ratios
Ratio analysis is the process of comparing and quantifying relationships between financial variables, such as those variables found in the statement of financial position and statement of profit or loss of a company.
Ratios can assist with:
Measuring the achievement of corporate objectives
Investment appraisal
Working capital management
Capital structure
Business valuations.
Profitability and return ratios
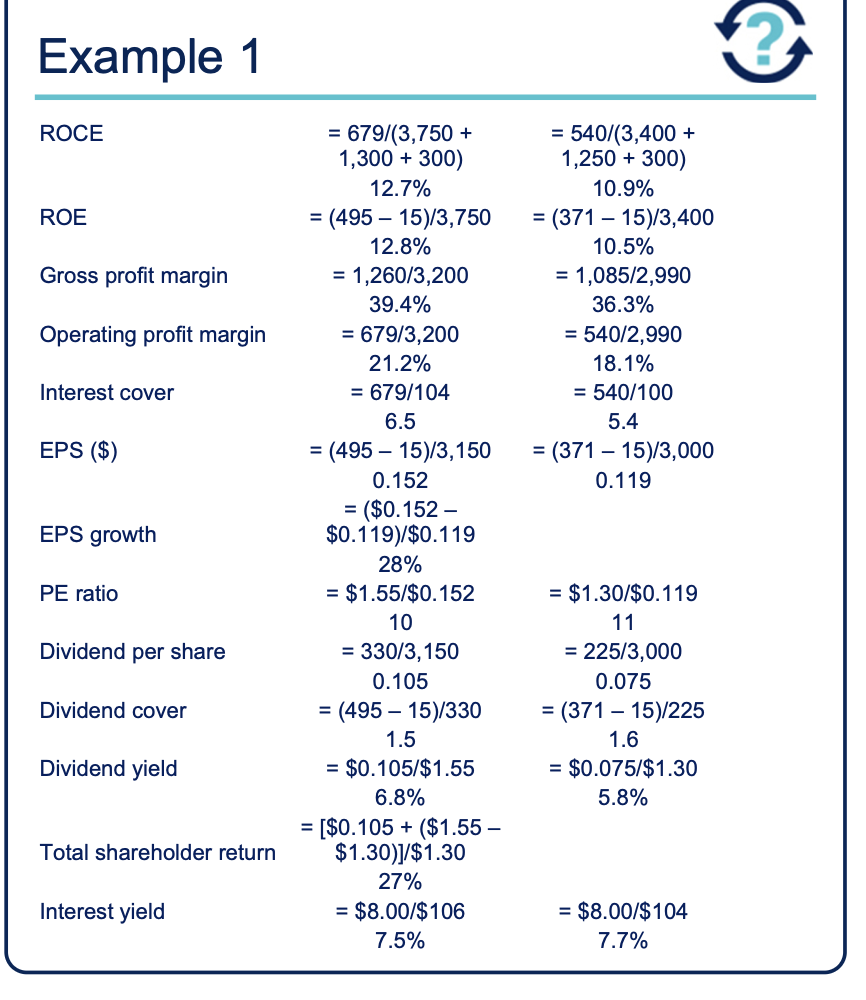
Return on capital employed (ROCE)
ROCE gives a measure of how efficiently a business is using the funds available. It measures how much is earned per $1 invested.
ROCE = \left( \frac{Operating Profit}{Capital Employed} \right) \times 100
Capital Employed can be defined as: Total assets - current liabilities Or, equity plus long-term debt.
ROCE uses profit, which is not directly linked to the objective of maximising shareholder wealth.
Return on Equity (ROE)
ROE gives a measure of how profit a company generates for its ordinary shareholders with the money they have invested in the company.
ROE = \left( \frac{Earnings}{Ordinary Share Capital and Reserves} \right) \times 100
Earnings are profits after deductions for interest, taxation and preference share dividends (if any are present).
ROE uses profit, which is not directly linked to the objective of maximising shareholder wealth.
It is sensitive to gearing levels – increasing as gearing increases.Profit Margins
Profit Margins indicate how well revenue is converted into profit.
Profit Margin = \left( \frac{Profit}{Revenue} \right) \times 100
Can be calculated using any profit figure (e.g., gross profit or operating profit).
Debt and gearing ratios
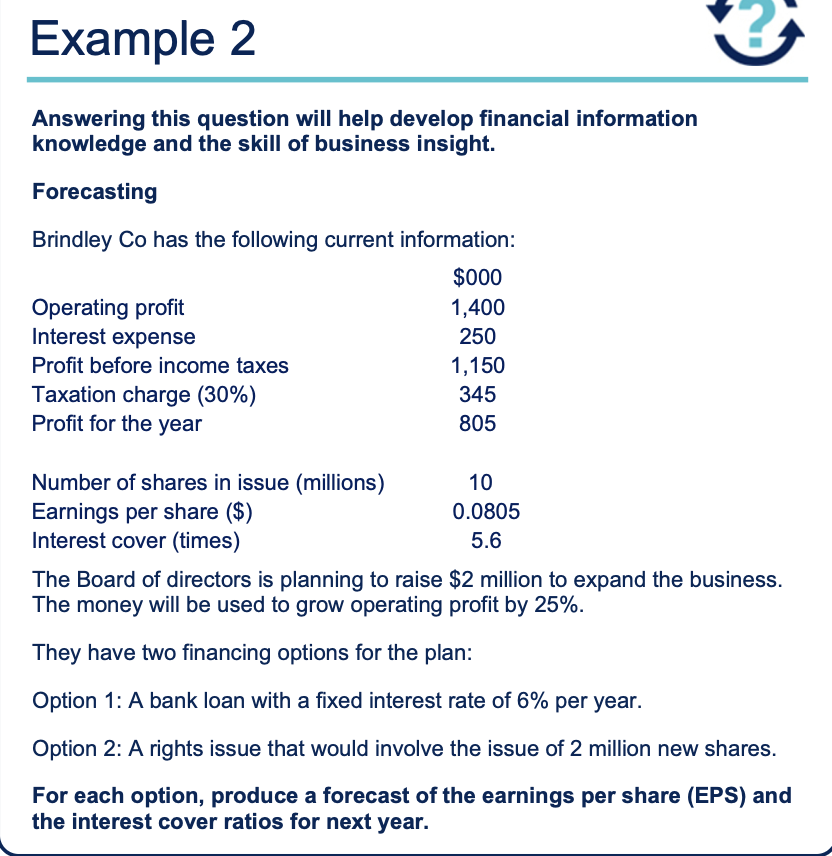
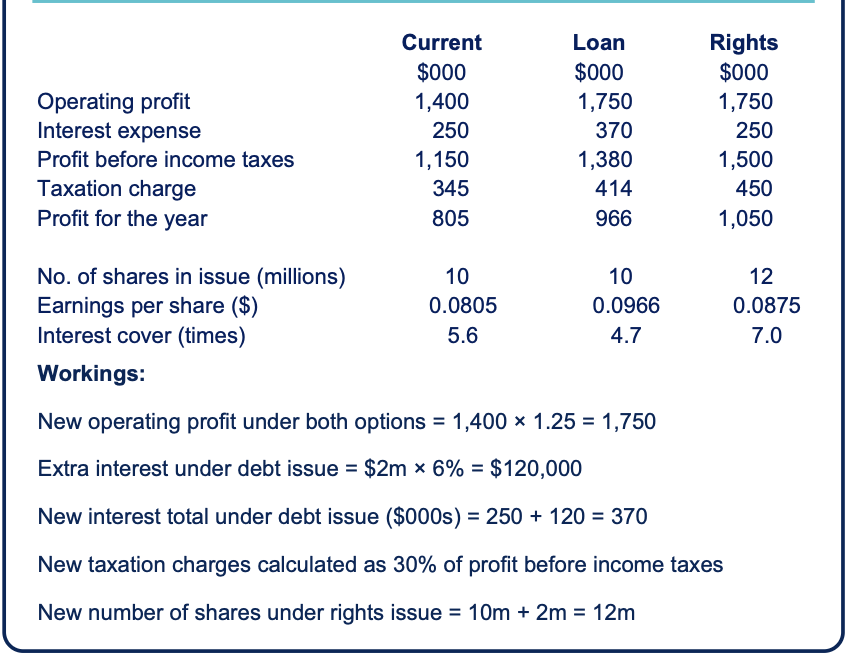
Interest Cover:
Measures the adequacy of a company’s profits relative to its interest payments.
Formula:
Interest Cover = \frac{Operating Profit}{Interest Expense}
The lower the cover, the greater the risk that profit will become insufficient to cover interest payments.
This is a particularly good ratio to use when evaluating a choice between debt and equity. If using debt leads to a low interest cover value, investors may feel that this represents too much of a risk.
Investor ratios
Earnings per share (EPS) is a basic measure of a company’s performance from an ordinary shareholder’s perspective. It is the amount of profit attributable to each ordinary share.
EPS = \frac{Earnings}{Number of Ordinary Shares in Issue}
EPS does not represent actual income of the shareholder and it uses earnings, which are not directly linked to the objective of maximising shareholder wealth.
Price/Earnings (PE) ratio gives a basic measure of company performance. It expresses the amount the shareholders are prepared to pay for the share as a multiple of current earnings.
PE\ Ratio = \frac{Share Price}{EPS}
A high PE ratio indicates that investors perceive the firm’s earnings to be of high quality – usually a mixture of high growth and/or lower risk expectations.
Dividend Per Share (DPS):
The DPS helps individual ordinary shareholders see how much of the overall dividend payout they are entitled to.
DPS = \frac{Total Dividend}{Total Number of Shares Issued}
Dividend Cover:
This is a measure of how many times the company’s earnings could pay the dividend.
Dividend Cover = \frac{Earnings}{Dividend for the Year}
Higher cover indicates better ability to maintain dividends if profits drop.
Dividend Yield:
Measures the wealth received by ordinary shareholders.
Dividend Yield = \left( \frac{DPS}{Market Price Per Share} \right) \times 100
Note: No capital growth is taken into account.
Total Shareholder Return (TSR):
Measures investor income by considering capital growth and dividend income.
TSR = \left( \frac{DPS + Change\ in\ Share Price}{Share Price\ at\ Start\ of\ Period} \right) \times 100
Interest Yield:
Measures interest on debt expressed as a percentage of the market price.
Interest Yield = \left( \frac{Interest}{Market\ Value\ of\ Debt} \right) \times 100