Graphs of Sine and Cosine
Graphing the trigonometric functions - Sine and Cosine
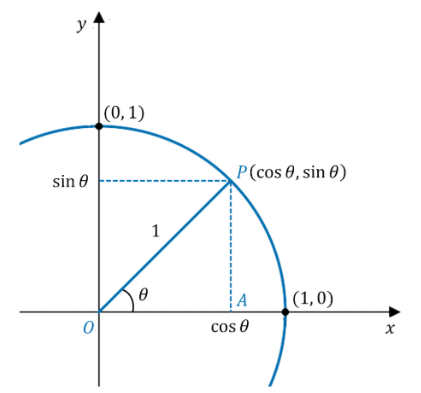
The sine of an angle is defined to be the y-coordinate of the point on the unit circle.
The cosine of an angle is defined to be the x-coordinate of the point on the unit circle.
The unit circle produces wave-like curves for and .
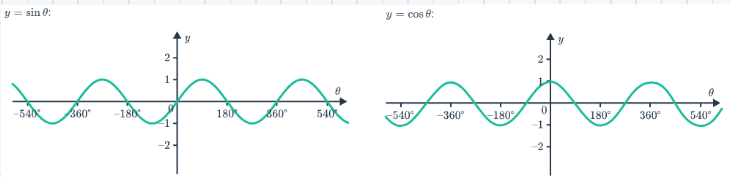
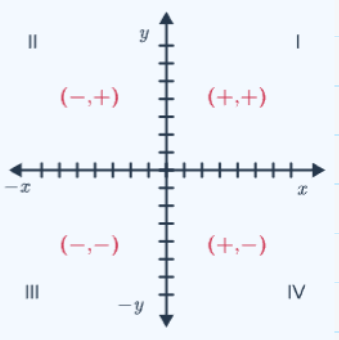
*Notice when the functions have positive and negative values. Match them up with the corresponding quadrants and check they behave in the same way.
Properties of Circular Graphs
wave functions, periodic graphs, cyclic graphs, oscillating graphs…
They demonstrate repetition. One cycle (wavelength), for these graphs, is 360°.
The possible value of y for sine (and cosine) waves is -1 and 1. This means the range: for both and
For the cycles to repeat, there has to be regions on the graph where y is increasing (as x increases) and other regions where y is decreasing (as x increases).
Graphing the trigonometric functions - Tangent
The tangent of an angle is defined as the ratio .
We also know that the gradient of a straight line is given by .
This means is just the gradient of the line raised from the positive x-axis.