ECG Interpretation
Uses of ECG
· Chest pain
· Arrhythmias
· Causes of syncope, SOB, dizziness
· Myocardial function – hypertrophy
· Guide medication
· Monitor medications – QT intervals
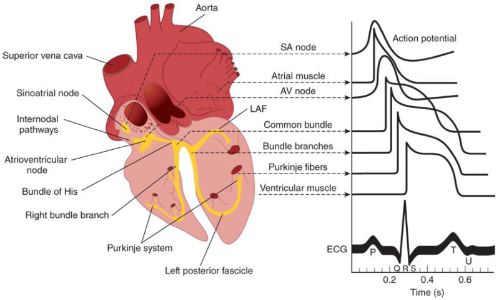
Cardiac Conduction System
· Electrical activity initiated at SA node
o Highest rate of spontaneous impulse generation
· Moves through cardiac tissue to ventricles at AV node
· Flows down bundle of His to bundle branches and Purkinje system
o 2 bundle branches on left, 1 on right
· Impulse reaches refractory tissue & dies out
o SA node recovers and fires again
Cardiac Myocytes Physiology
· Different types of excitable cells in heart
o Conduction (electrical) + myocardial (mechanical)
o Elicit action potential
· Electrical gradient between inside & outside of cardiac cell membranes
o Xxxxx
Action Potential Curve: Non-Nodal Cells
· Phase 4: resting membrane potential (-90 mV); slows Na2+ channels allows influx Na+ ions
· Phase 0: rapid depolarization; rapid Na+ channels allow influx of Na+
· Phase 1: K+ efflux to correct overshoot
· Phase 2: plateau phase; Ca2+ influx and balanced by K+ efflux
· Phase 3: cellular repolarization; K+ efflux to restore resting membrane potential
Action Potential Curve: Nodal v Non-Nodal
· Atrial and Ventricular Tissue Activation (Panel A)
o Rapid depolarizing current through Na+ channels & gates
· SA and AV Nodal Tissue Activation (Panel B)
o Slow depolarizing current through Ca2+ channels & gates
Normal Conduction
· Electrical stimulation/depolarization results in cell membrane potential changes
o Sudden depolarization affects adjacent cells “Wave” effect
· Myocardial cells depolarize Release calcium Muscle contraction
· Voltage-gated channels re-open to facilitate repolarization back to baseline gradient
· Alternating waves of depolarization and repolarization generate electrical current captured on ECG
Action Potential to ECG Waves
Basics of ECG
· X-axis: Time
· Y-axis: Amplitude
· Standardized technique records all electrical activity over 10 seconds
· Recorded waves form intervals and segments that represent major electrical events
· No electrical activity Baseline or isoelectric line
· Large 5 x 5 mm 0.2 seconds and 0.5 mV amplitude
· Small 1 x 1 mm 40 ms time and 0.1 mV amplitude
· Reference pulse 1 mV
Normal Sinus Rhythm on ECG: Single Heartbeat
· P wave: atrial depolarization
· PR interval: conduction delay through AV node
· QRS complex: ventricular depolarization
· ST segment: early ventricular repolarization
· T wave: ventricular repolarization
· QT interval: total ventricular activity
· In NSR All waves and intervals are predictable Same size, shape, distance apart
·

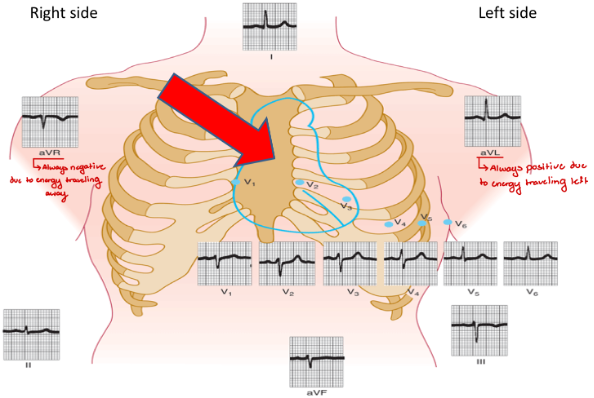
Lead Placement for 12 Lead EKG
· Heart is 3D Need different viewpoints
· Each ECG lead is a different viewpoint
o Records energy movement in relation to electrodes (leads)
· Rhythm strip 1 lead
· Combined “360” degree 12 leads
· Limb leads Frontal/Vertical Plane
o I, II, III, aVR, aVL, aVF
o Top to bottom + Right to left
· Precordial (chest) leads Horizontal plane on front/side chest
o V1, V2, V3, V4, V5, V6
o Anterior to posterior
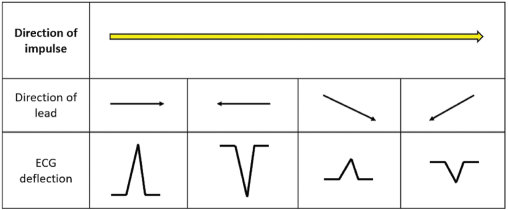
ECG Wave Forms
· ECG captures wave form in relation to lead placement
· Positive (UP) deflection Electrical movement towards electrode
· Negative (DOWN) deflection Electrical movement away from electrode
·
12 Views of a Single Heart Beat
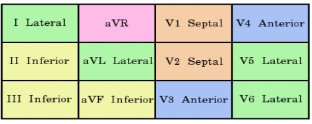
Grouping of Leads: Perspective on Heart Regions
· Anterior: V1, V2, V3, V4
· Left Lateral: I, AVL, V5, V6
· Inferior: II, III, AVF
· N/A: AVR
·
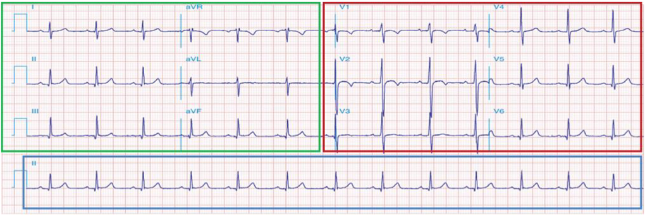
Typical 12-Lead ECG
Steps for Analyzing ECG
· Assume electrical direction is normal
· HR
o Bradycardia: < 60 bpm
o Normal: 60 – 10 bpm
o Tachycardia: > 100 bpm
· Rhythm – Pattern of QRS complexes
o R-R distances, regular or irregular?
o Shape of QRS, narrow or wide?
o P waves present, yes or no?
o Is there one P wave before each QRS, yes or no?
· Intervals and Segments
o Evaluate duration of PR, QRS, QT intervals
o ST segment, elevated or depressed?
Calculating HR from EKG
· Standard ECG rhythm strip records 10 seconds
o R waves x 6
· Counting squares on EKG paper between R waves
o One small square: 0.04 seconds
o One large square: 0.2 seconds
o 5 large squares: 1 second
o Count # of squares between R waves
o Rate = 300 / R-R interval in large squares
o Rate = 1500 / R-R interval in small squares
Diagnostic Testing in Chest Pain
· ECG
· Normal in ½ of patients with angina not experiencing an acute attack
· ST-T wave changes
o Depression
o T-wave inversion
o ST-segment elevation
· Significant ischemia
o ST-segment depression > 2 mm
o Exertional hypotension
o Reduced exercise tolerance
Electrocardiogram S-T Segment
· Ischemia exerts complex electrical properties of myocardial cells
· Ischemia changes voltage gradient between normal and ischemic zones
o Severe, acute ischemia lowers resting membrane potential and shortens duration of AP
· Area of injury in LV are represented by current changes on ECG through deviation of ST segment
· Panel A: Ischemia confined to subendocardium, ST vector shifts towards subendocardium and ventricular cavity ST-segment depression
· Panel B: Acute ischemia or infarction is transmural; ST vector is usually shifted in direction of outer layers ST elevation
· ST changes in 1 lead are not clinically relevant; Changes seen in contiguous leads are important to localize injury and guide treatment
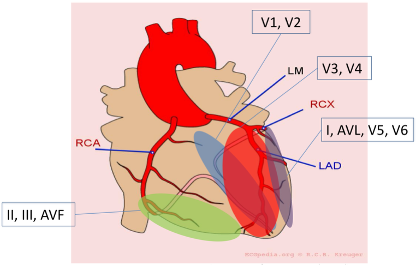
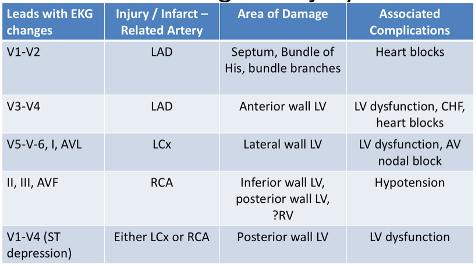
Localizing Injury
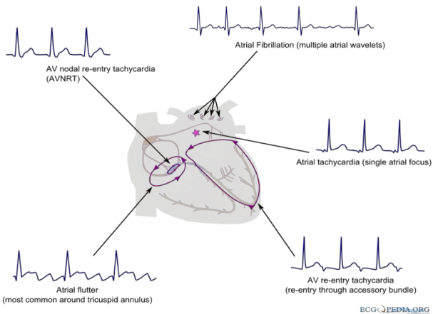
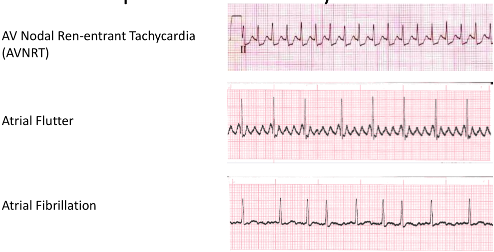
Supraventricular Arrhythmias
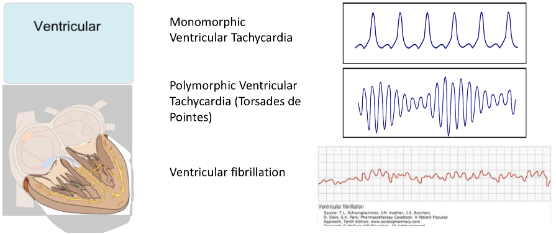
Ventricular Arrhythmias
Conduction Blocks
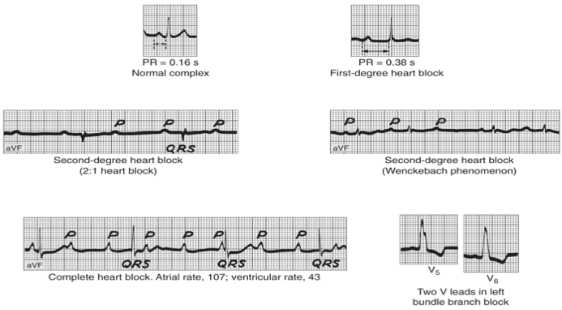
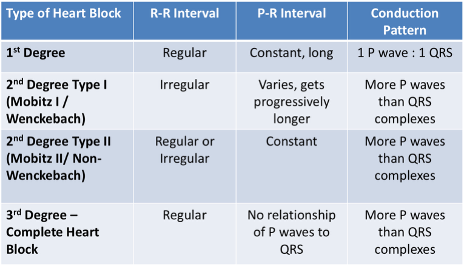
Differentiating Heart Blocks
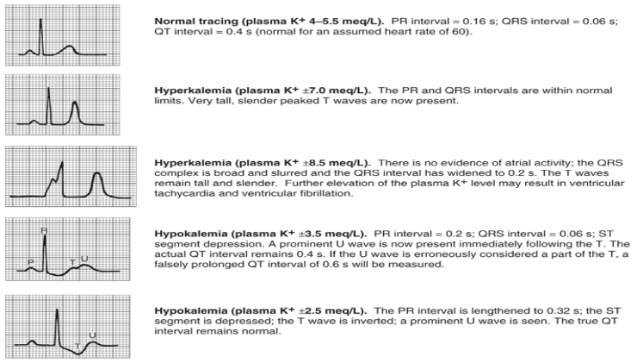
Electroyltes and ECG Findings