e-DNA monitoring of biodiversity
Relevant Fields for Conservation Genetics
Focus on e-DNA (environmental DNA) monitoring of biodiversity, which involves detecting genetic material shed by organisms into their environment.
It is crucial for detecting rare or elusive species, monitoring invasive species spread, and assessing the overall health and composition of ecosystems where traditional sampling methods are challenging.
Mentioned in the context of an online seminar discussing cutting-edge research and applications in nature conservation.
Introduction to e-DNA in Biodiversity
e-DNA approaches play a crucial role in estimating biodiversity by providing a non-invasive and highly sensitive method for species detection.
The significance of e-DNA is highlighted in its ability to facilitate the collection of genetic material from various environmental samples (e.g., soil, water, air, sediment, feces, ice, snow), which can then be analyzed to identify the organisms that have been present in that environment.
Public Interest in e-DNA
BBC News features a report by Prof. Neil Gemmell discussing Loch Ness samples, where e-DNA analysis was used to investigate the possibility of a large unknown animal.
Hypothesis: Loch Ness Monster potentially a giant eel, through sampling the genetic material found in the water that is shredded off the species surface
Limitations of e-DNA
Contamination Risks: e-DNA can be prone to contamination from external sources (e.g., human DNA, DNA from reagents, cross-contamination between samples during collection or processing), leading to misleading or false positive results. Strict laboratory protocols are essential to minimize this risk.
Inhibition and Sequencing Errors: Environmental samples often contain substances (e.g., humic acids in soil, heavy metals, polyphenols) that can inhibit PCR amplification, leading to false negatives or reduced detection sensitivity. Sequencing errors can also lead to misidentification or overestimation of diversity.
Longevity in Soil: e-DNA can persist for decades, influenced by factors like soil composition, pH, temperature, and microbial activity. However, its persistence means it cannot distinguish between live, recently dead, or historically present organisms, posing challenges for inferring current biodiversity or population viability.
Degradation in Aquatic Environments: Factors such as light (UV radiation), heat, oxygen, nucleases (enzymes that break down DNA), and microbial activity contribute to the quick degradation of e-DNA in water, typically ranging from hours to days. This rapid degradation affects the spatiotemporal signal of detection, often indicating recent presence.
Power of e-DNA Approaches
Meta-Analyses: e-DNA research utilizes meta-analyses to synthesize findings from multiple independent studies, identify overarching patterns, assess the consistency of e-DNA applications, and strengthen ecological conclusions across different environments or species.
Time Series Studies: Investigations allow for tracking changes in biodiversity and species occupancy over time by repeatedly sampling the same locations. This is crucial for monitoring population trends, seasonal variations, and the impact of environmental disturbances.
Historic Records: Integration of historic data, often obtained from preserved museum specimens, archived sediment cores, or cryo-archived samples, to inform current biodiversity assessments and provide crucial baselines for comparing past and present ecological states.
Long-Term Experiments: Essential for understanding ecological changes through a longer time frame, particularly in response to environmental stressors like climate change, pollution, or habitat alteration, allowing for the observation of subtle or delayed impacts on biodiversity.
Quaternary Paleoecology: Study of ecological changes and biodiversity over the Quaternary period (last 2.6 million years) by analyzing e-DNA from ancient sediments (e.g., lake or marine cores, permafrost). This approach helps reconstruct past ecosystems, track species migration, and understand long-term evolutionary trends.
Primer and Sequencing Techniques
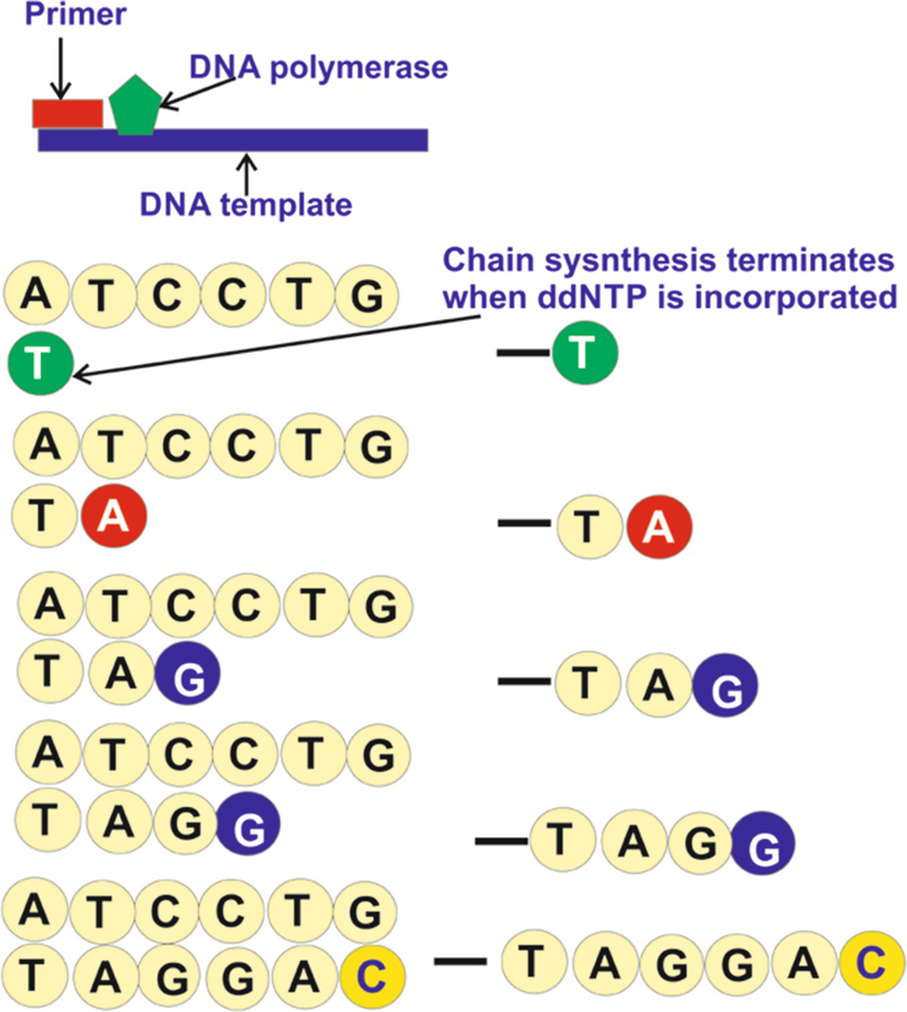
Sanger Sequencing: Methodology includes the use of DNA polymerase (an enzyme that synthesizes new DNA strands), DNA templates (the target DNA sequence to be analysed), and the incorporation of ddNTPs (dideoxynucleotide triphosphates) which lack a 3'-hydroxyl group.
When a ddNTP is incorporated into a growing DNA strand, it terminates chain synthesis during sequencing because no further nucleotides can be added. Each of the four ddNTPs (ddATP, ddTTP, ddCTP, ddGTP) is typically labelled with a distinct fluorescent dye.
Example segments DNA sequences indicating how terminator nucleotides affect the output of sequencing reactions. The resulting fragments of varying lengths are separated by size (e.g., via capillary electrophoresis), and the fluorescent signal at each position is detected to reconstruct the DNA sequence.
Modern DNA Outputs
Various complex sequences showcased indicating outputs from high-throughput DNA sequencing technologies, such as Illumina, PacBio, or Oxford Nanopore platforms.
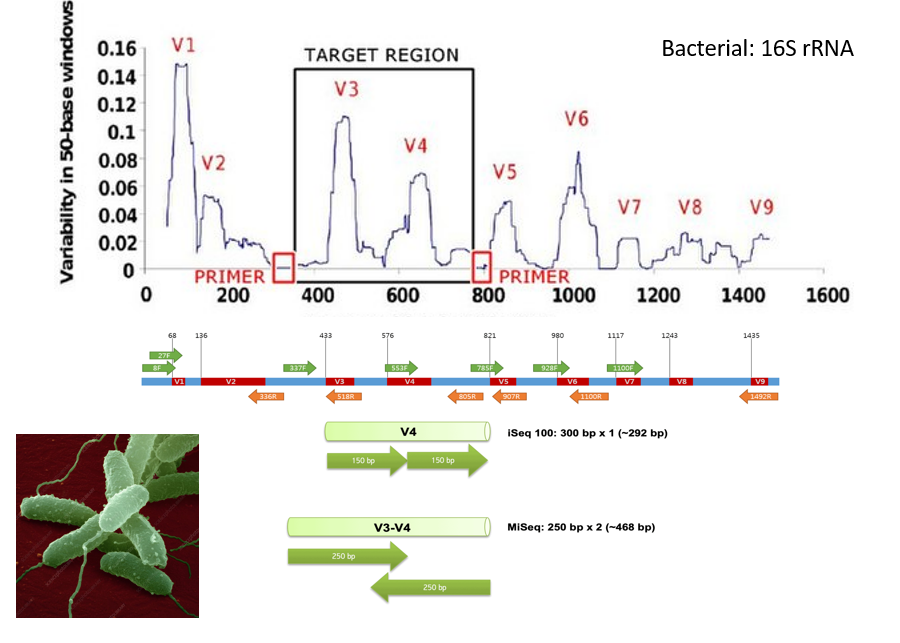
The text indicates advanced practices and tools used in DNA sequencing which include amplified markers for targeted sequencing (e.g., 16S rRNA for bacteria, CO1 for animals) and high-throughput methods that generate millions or billions of short DNA reads simultaneously. These outputs require sophisticated bioinformatics pipelines for processing, quality control, sequence alignment, and taxonomic assignment.
DNA Barcoding Technique
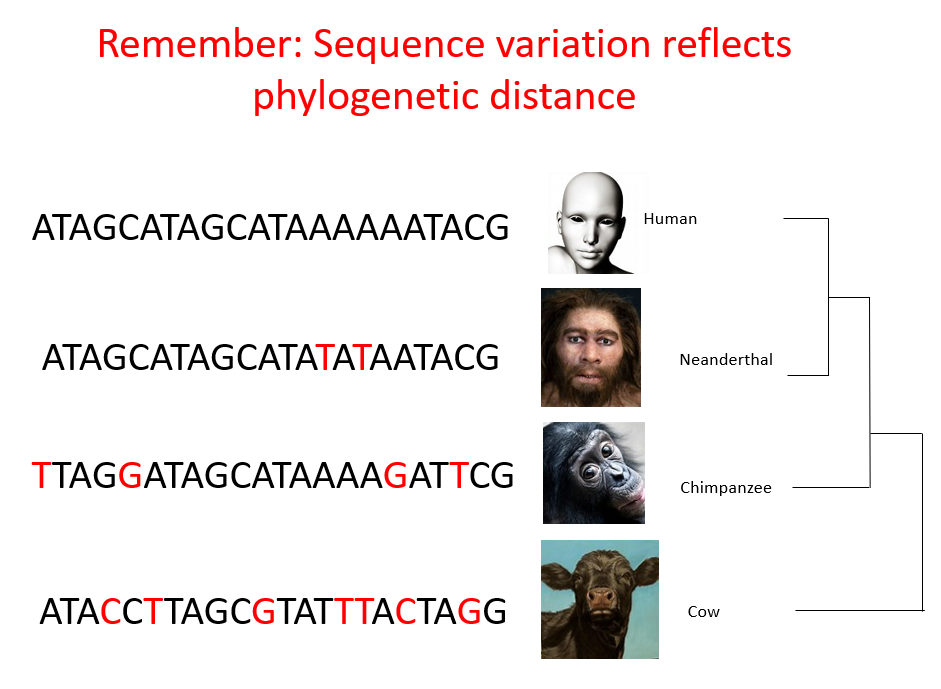
What to Sequence: DNA Barcoding
A description of DNA barcoding standards for species identification, which involves using a short, standardized genetic region to identify species, much like a product barcode.
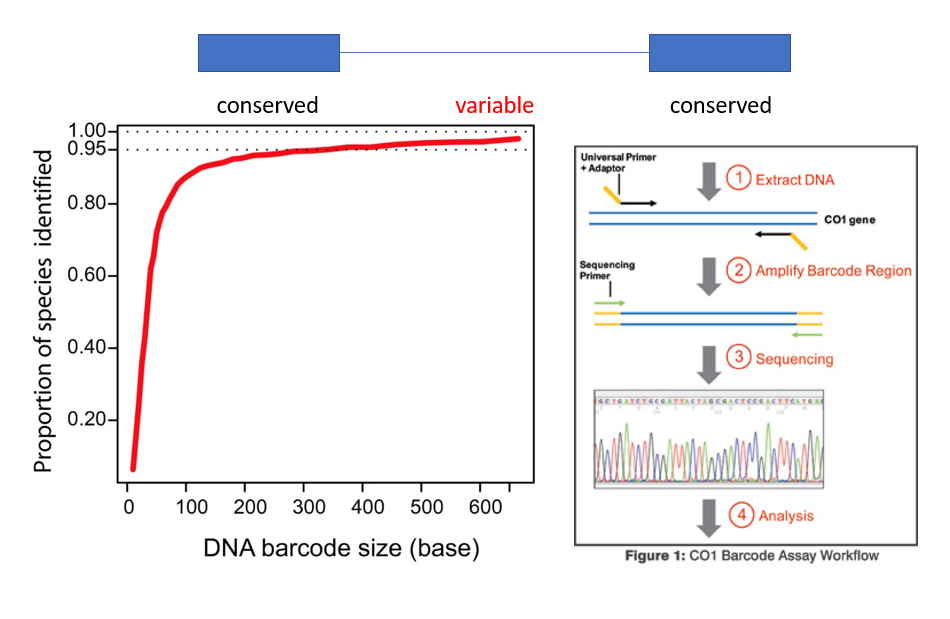
Specifically, the CO1 gene (cytochrome c oxidase subunit I), found in the mitochondrial genome, is highly effective in distinguishing over 95% of animal species. It possesses conserved flanking regions, allowing for the use of universal primers, and a variable central region that provides species-specific diagnostic markers.
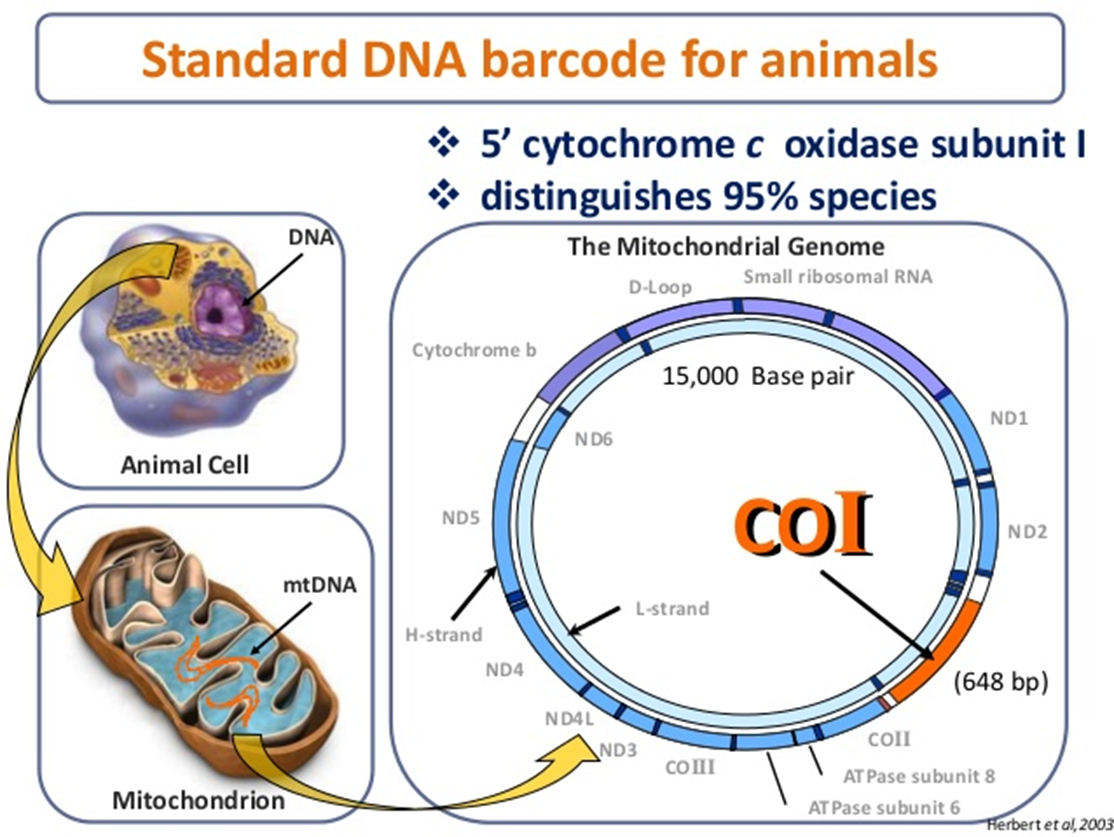
DNA structure includes a complex arrangement of mitochondrial genes. The mitochondrial genome is particularly useful for barcoding due to its high copy number per cell (making DNA extraction easier), maternal inheritance (simplifying phylogenetic analysis), and relatively rapid evolutionary rate.
Proportions and Sequencing in DNA Barcoding
Workflow illustrated for sequencing in DNA barcoding:
DNA Extraction: Obtain high-quality DNA from diverse environmental samples, such as water filters, soil cores, scat, or even air samples, using specialized extraction kits tailored to the sample matrix.
Amplification: Use universal primers, typically via Polymerase Chain Reaction (PCR), to amplify the specific barcode region (e.g., CO1 for animals, rbcL for plants, ITS for fungi). This increases the copy number of the target DNA fragment.
Sequencing: Perform DNA sequencing using methods like Sanger sequencing (for single species DNA barcoding) or high-throughput sequencing (for metabarcoding, enabling simultaneous identification of multiple species).
Analysis of Sequences: Identify species present by comparing generated barcode sequences against publicly available reference databases such as BOLD (Barcode of Life Data System) or GenBank, using bioinformatics tools like BLAST.
Meta Barcoding
Applications of e-DNA Metabarcoding
Utilizes e-DNA for various ecological insights, providing a comprehensive view of biodiversity in diverse contexts:
Ancient Ecosystems: Understanding historic biodiversity by analyzing e-DNA preserved in sediment cores from lakes, permafrost, or cave deposits, allowing reconstruction of past flora and fauna.
Pollination Interactions: Studying relationships in ecosystems by identifying plant DNA on pollinator bodies or in honey, mapping complex plant-pollinator networks, and assessing pollinator health.
Diet Analysis: Investigating dietary habits of animals through environmental samples like scat, stomach contents, or pellets, revealing trophic links and food web dynamics without invasive sampling.
Invasive Species Detection: Early and sensitive identification of non-native species through e-DNA in water or soil samples, often detecting their presence at low densities before visual observation is possible, enabling rapid management responses.
Pollution Responses: Use in assessing ecosystem health relating to pollution metrics by monitoring shifts in microbial communities, invertebrate populations, or fish assemblages in contaminated environments.
Air Quality Monitoring: Evaluating ecosystem responses in relation to air pollutants by identifying airborne pollen, fungal spores, or even bioaerosols, and tracking their seasonal or geographical distribution.
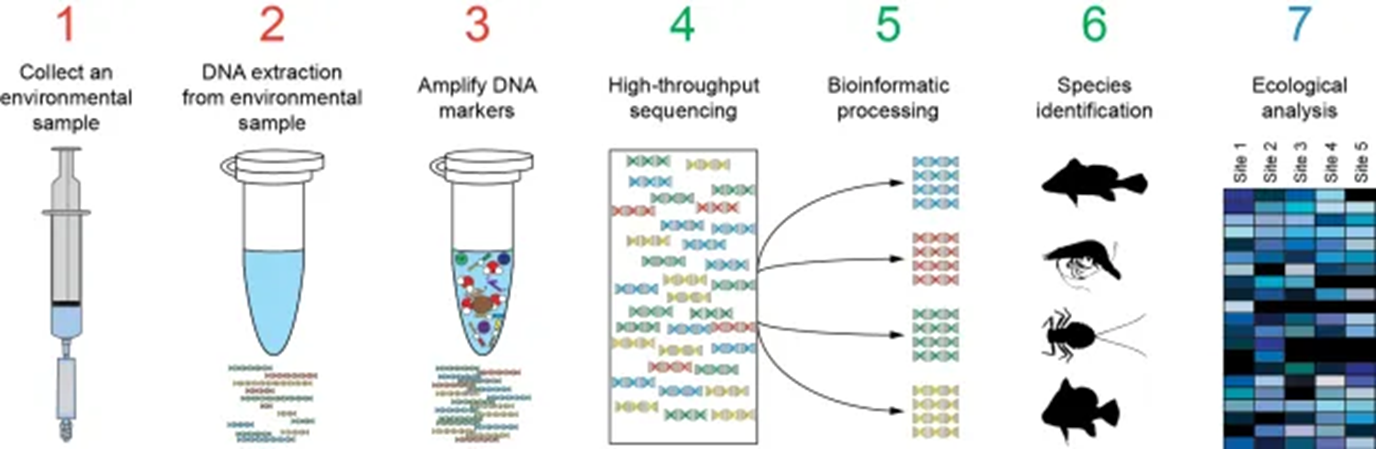
Meta Barcoding Process
Environmental sample is collected, encompassing a wide range of matrices such as water (filtered), soil, sediment, air (via filters), snow, ice, or even bulk invertebrate samples. PPE worn to ensure DNA from lad conductor does not contaminate sample
DNA is extracted from the sample, often involving lysis, purification, and concentration steps to yield sufficient and high-quality DNA.
Amplification of specific DNA markers (e.g., 16S, 18S, ITS, CO1) for sequencing using universal or degenerate primers that target specific phylogenetic groups within the diverse e-DNA pool.
High-throughput sequencing is conducted to gather extensive data, typically generating millions of short DNA reads simultaneously, allowing for parallel analysis of thousands of different DNA fragments within the sample.
Bioinformatic processing aids in the identification of species. This involves demultiplexing, quality filtering, denoising (to create Amplicon Sequence Variants or Operational Taxonomic Units), and taxonomic assignment by querying sequences against reference databases.
Resulting data is utilized for ecological analysis, leading to findings across multiple sites. This includes calculating diversity indices, analyzing community structure, performing statistical comparisons, and visualizing ecological patterns to infer biodiversity and ecosystem health.
Example of Next Generation Sequencing
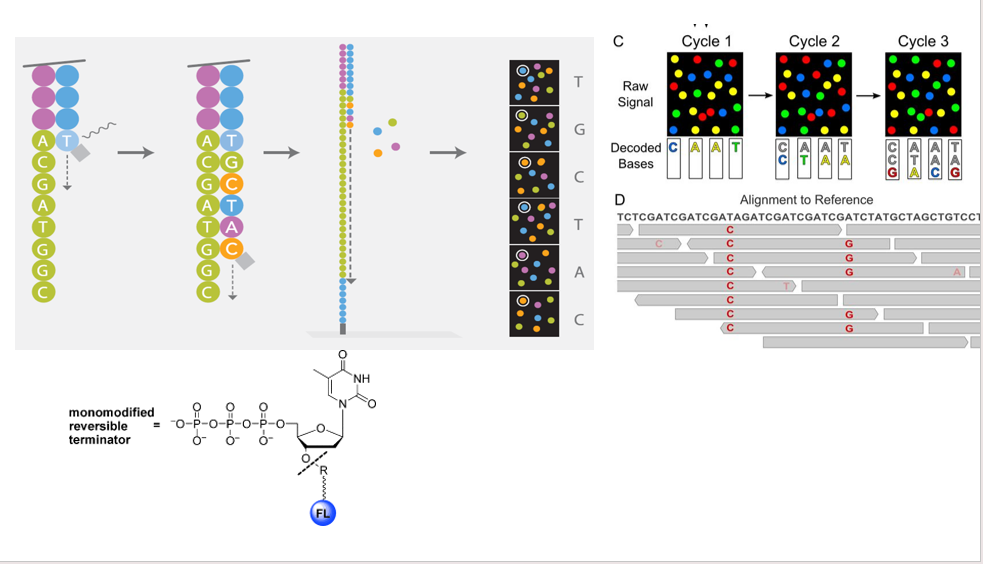
Outlines the process of next-generation sequencing, which typically involves cyclical reversible termination chemistry, as seen in Illumina platforms.
Use of modified primers and reversible terminators to capture sequence outputs. In each cycle, a fluorescently labeled ddNTP (reversible terminator) is incorporated, blocking further extension. After imaging the incorporated base, the fluorophore and the terminating group are enzymatically cleaved, allowing the next cycle of synthesis and incorporation.
Cycles of synthesis that yield data for understanding DNA sequences. Millions of DNA fragments are simultaneously sequenced base-by-base in parallel, generating high-resolution data quickly and cost-effectively.
Example indicates raw signals (fluorescent intensities) from sequencing and their interpretations through sophisticated algorithms to identify genetic sequences from environmental samples, ultimately providing base calls and quality scores.
Outputs from e-DNA Analysis
A diverse array of organism classifications resulting from sophisticated e-DNA analysis, demonstrating the comprehensive nature of this technique in revealing cryptic biodiversity:
Animalia: Cnidaria (e.g., jellyfish, corals), Arthropoda (e.g., insects, crustaceans), Echinodermata (e.g., starfish, sea urchins), Chordata (e.g., fish, mammals), Annelida, Mollusca, among many others, encompassing both macroscopic and microscopic animal life.
Fungi: Various phyla like Ascomycota (e.g., yeasts, molds), Basidiomycota (e.g., mushrooms), Chytridiomycota, Glomeromycota, often revealing a hidden world of decomposers and symbionts.
Plantae: Chlorophyta (green algae), Streptophyta (land plants and some green algae), indicating the diversity captured in e-DNA monitoring, including macroscopic plants, phytoplankton, and other photosynthetic organisms.
Others: Included classifications of Archaea, Bacteria, and Protozoa which further exemplify the breadth of e-DNA outputs, offering insights into microbial communities, soil health, and planktonic ecosystems that are often invisible to traditional surveys. This holistic view provides a powerful tool for comprehensive biodiversity assessment and conservation strategy development.