Long-Run Production Costs
Long-Run ATC curve
long-run average total cost (LRATC) curve
shows the lowest average total cost possible when a firm can change all inputs
shaped by connecting the lowest points of all short-run ATC curves
it's called an envelope curve because it wraps around the bottom of the SRATC curves
relationship to short-run ATC
each SRATC is based on a fixed plant size or resource
the LRATC assumes flexibility in changing all resources (no fixed inputs)
firms can switch between SRATC curves to stay on the LRATC as they grow
Economies and Diseconomies of Scale
Economies of Scale
Definition: LRATC declines as output increases
Causes:
Specialization of labor and management
Bulk purchasing of inputs
Efficient use of capital and technology
Graphical Representation: Downward-sloping portion of the LRATC curve
Diseconomies of Scale
Definition: LRATC increaess as output increases
Causes:
Coordination and communication difficulties
Bureaucratic inefficiencies
Resource limitations leading to higher input costs
Graphical Representation: Upward-sloping portion of the LRATC curve
Constant Returns to Scale
Definition: When increasing production does not change LRATC
Graphical Representation: Flat portion of the LRATC curve
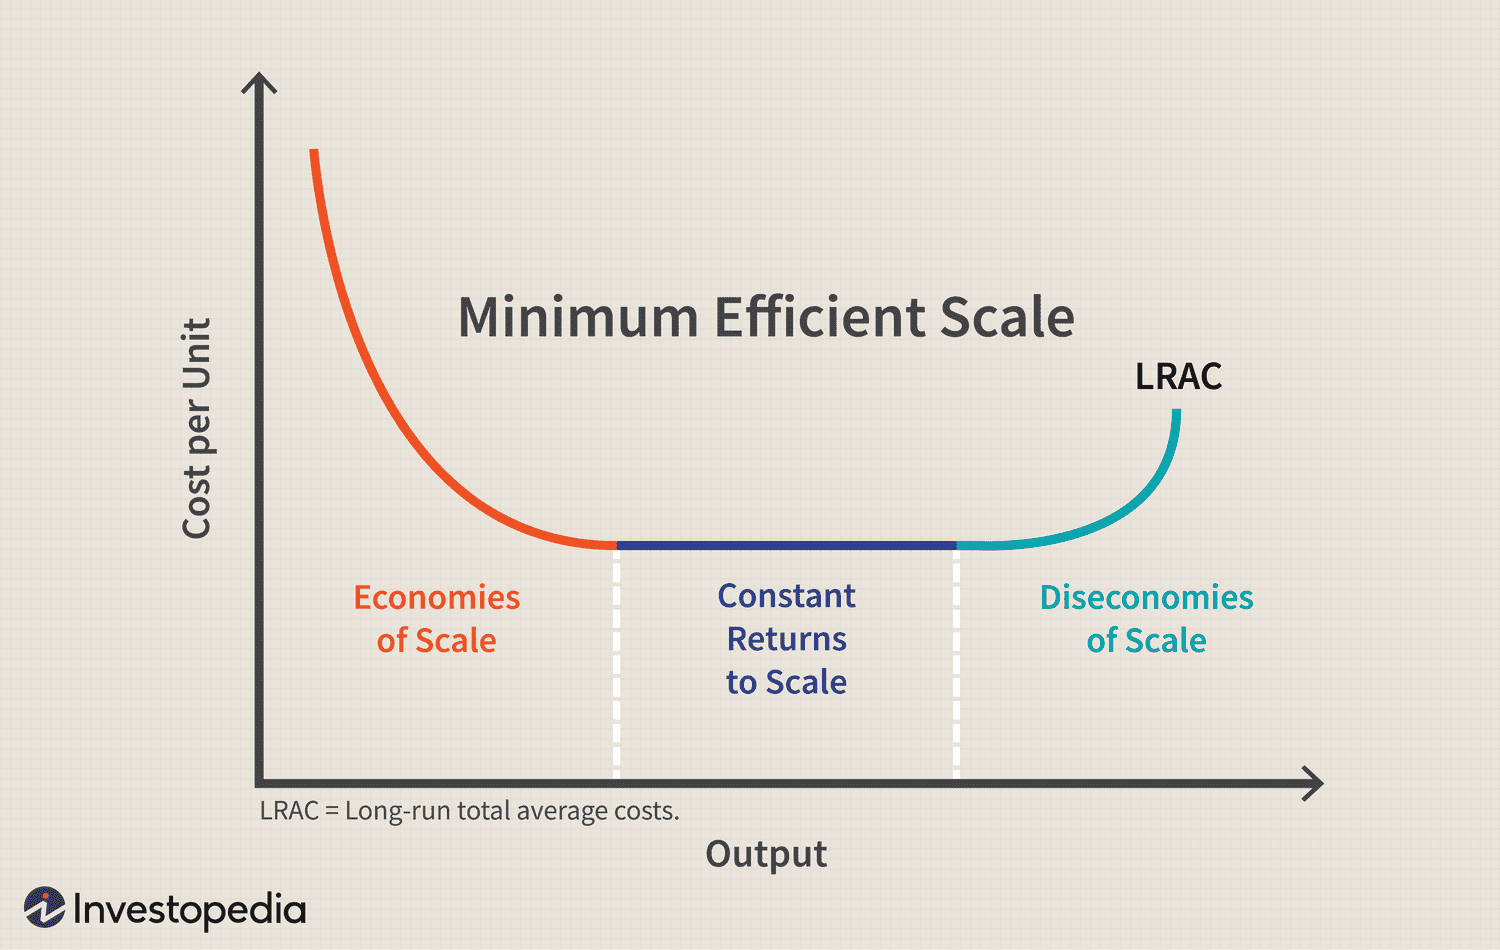
Minimum Efficient Scale and Market Concentration
Definition: The smallest quantity of output at which a firm achieves the lowest long-run average total cost (LRATC).
Significance: Firms operating at or above MES can produce efficiently; those below may struggle to compete due to higher per-unit costs
MES and Market Structure
MES vs. Market Size:
If MES is a small fraction of total market demand, many firms can operate efficiently, leading to a competitive market
If MES is large relative to market demand, only a few firms can achieve efficiency, resulting in a concentrated market or natural monopoly
Natural Monopoly:
Occurs when a single firm can supply the entire market at a lower cost than multiple firms due to economies of scale