Ultrasound vocabulary
I. Basic Ultrasound Physics
Sound is a series of pressure waves propagating through a medium
One cycle of the acoustic wave is composed of a complete positive and negative pressure change
The wavelength is the distance traveled during one cycle
The frequency of the wave is measured in cycles per second or Hertz (cycles/s, Hz) (Illustration 1)
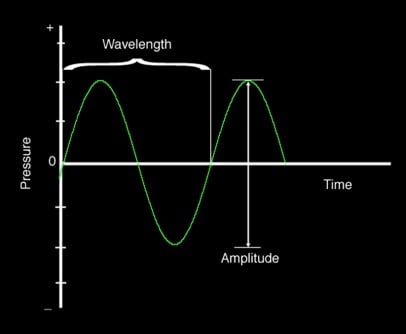
Illustration 1. The illustration shows a schematic drawing of wave length, pressure and amplitude.
For most humans audible sound ranges between 20 Hz and 20,000 Hz (20 kHz)
Ultrasound refers to any sound waves with frequencies greater than 20kHz
Diagnostic ultrasound typically uses frequencies between 2 and 20 million Hertz (Megahertz - MHz)
The propagation speed of an acoustic wave traveling through a specific medium is determined by the stiffness of that medium
The greater the stiffness, the faster the wave will travel. This means that sound waves travel faster in solids than liquids or gases
Sound waves travel through human soft tissue at approximately 1540 m/s (about one mile per second)
Attenuation is the loss of intensity and amplitude as sound waves travel through a medium
The major source of attenuation in soft tissue is absorption, the conversion of acoustic energy into heat
Other causes of attenuation are reflection, refraction and scatter
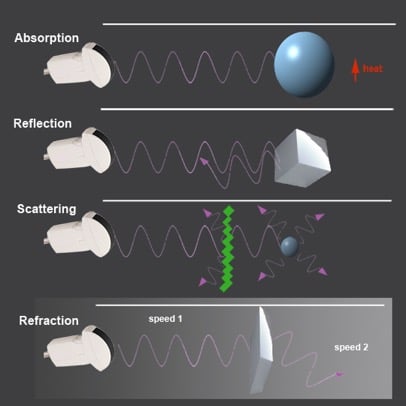
Illustration 2. Hearing range in various animals and humans.
These occur as sound waves encounter a boundary between two different media
Some of the waves bounce back towards the source as an echo (reflection)
The angle of approach (incidence) is identical to the angle of the reflection
The remaining sound wave travels through the second medium (or tissue)
If the two mediums have different “stiffness” the resulting change in propagation speeds will cause the wave to be “bent” from its original path (refraction)
The angle of incidence will be different from the angle of transmission
The amount of deflection is proportional to the difference in the two tissues ‘stiffness’
Scatter occurs when ultrasound waves encounter a medium with a heterogeneous surface
While most of the original wave continues to travel in its original path, a small portion of the sound waves are scattered in random directions
The production and interpretation of ultrasound waves is based on the so-called ‘pulse-echo-principle’
The source of the ultrasound wave is the piezoelectric crystal, which is housed in the transducer
These crystals have the ability to transform an electrical current into mechanical pressure waves (ultrasound waves) and vice versa
Once the ultrasound wave is generated and travels through the medium, the crystal switches from ‘sending’ into ‘listening’ mode and awaits returning ultrasound echoes
Transducers spend over 99% of the time “listening” for returning waves
This cycle is repeated several million times per second
Returning sound waves are converted into images on the ultrasound monitor.
Based off direction, timing and amplitude of returning waves
Understanding the relationship between ultrasound frequency and image resolution helps when choosing the ideal probes and frequencies
Lower frequencies are able to penetrate deeper into tissue but show poorer resolution (fine detail)
Higher frequency ultrasound will display more detail with a higher resolution though with less depth penetration
II. Ultrasound Modes
B-mode or ‘brightness mode’ provides structural information utilizing different shades of gray (or different ‘brightness’) in a two-dimensional image (Figure 1)
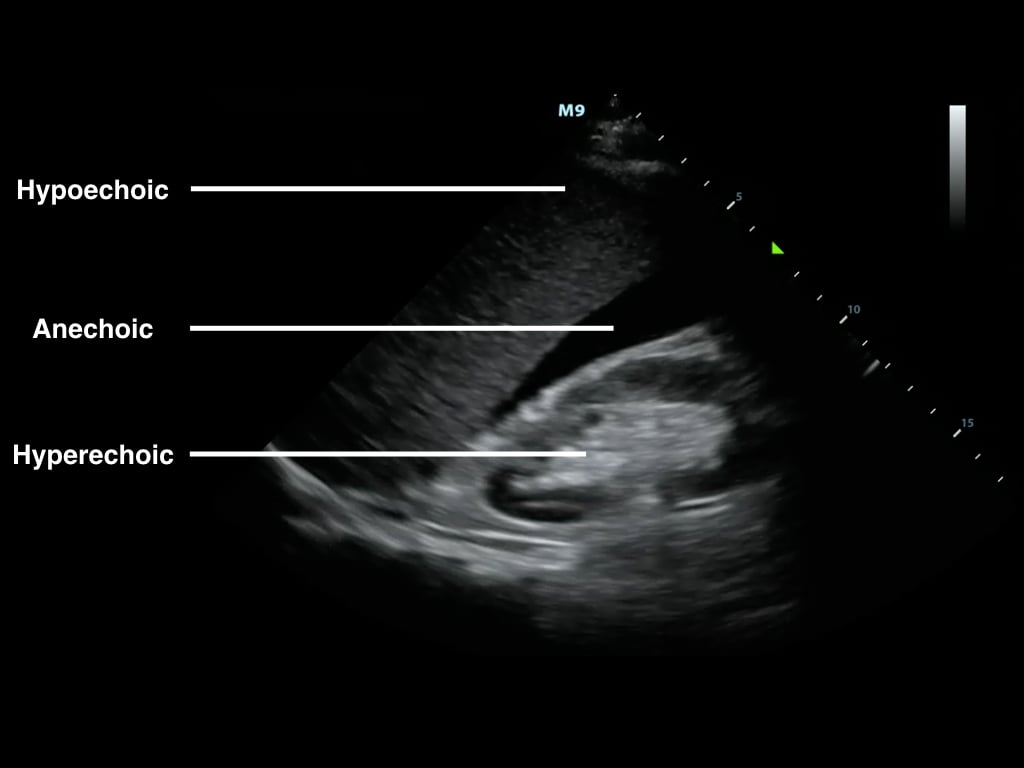
Figure 1. B-Mode image of free fluid in the right upper quadrant
Brightness is determined by the amplitude of returning echoes
Anechoic/Echolucent – Complete or near absence of returning sound waves, area is black
Hypoechoic - Structure has very few echoes and appears darker than surrounding tissue
Hyperechoic/Echogenic – Large amplitude of returning echoes appears brighter than surrounding tissue
M-mode (motion mode) captures returning echoes in only one line of the B-mode image displayed over time
Movement of structures positioned in that line can now be visualized
Often M-mode and B-mode are displayed together in real-time on the ultrasound monitor (Figure 2, Video 1)
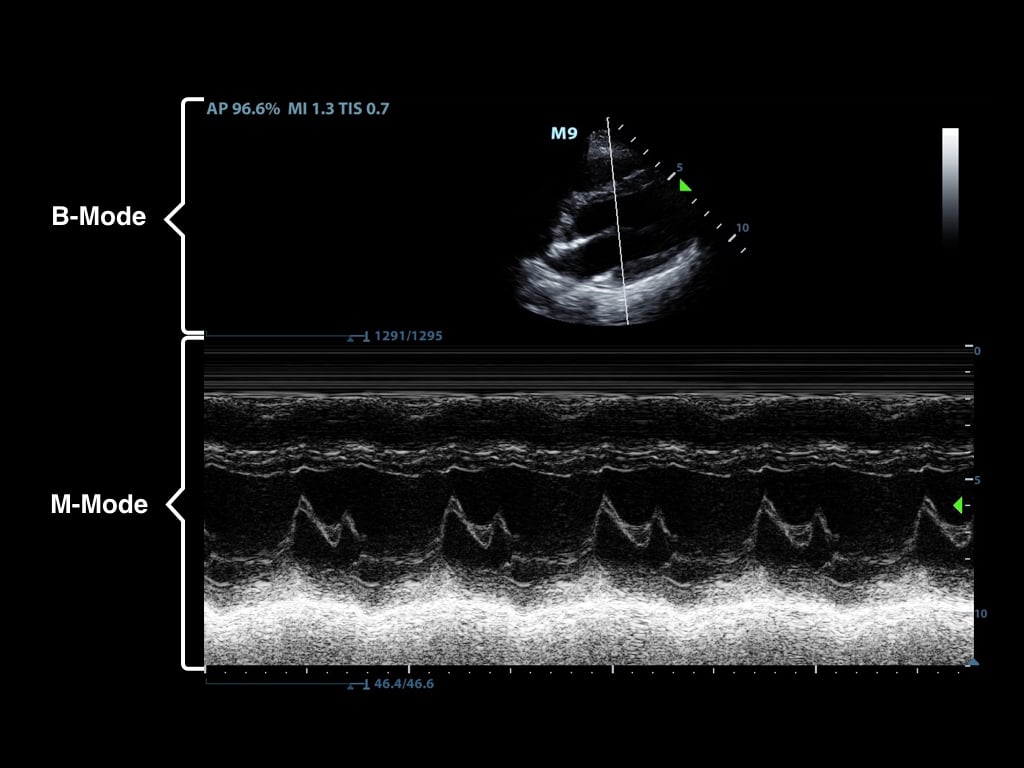
Figure 2. M-Mode (lower portion of the image) combined with B-Mode image. In this still image the M-mode captures the movement of a particular part of the heart.)
Video 1. M-Mode showing movement of the mitral valve
Doppler modes examine the characteristics of direction and speed of tissue motion and blood flow and present it in audible, color or spectral displays
Utilizes a phenomenon called ‘Doppler shift,’ which is a change in frequency from the sent to the returning sound wave
These changes or ‘shifts’ are generated by sound waves reaching moving particles.
The change of frequency/amount of shift correlates with the velocity and direction of particle motion
Color Doppler ultrasound is also called color-flow ultrasound.
It is used to show blood flow or tissue motion in a selected two-dimensional area
Direction and velocity of tissue motion and blood flow are color coded and superimposed on the corresponding B-mode image (Figure 3, Video 2)
Typically, red depicts movement towards the transducer, while blue depicts movement away from the transducer
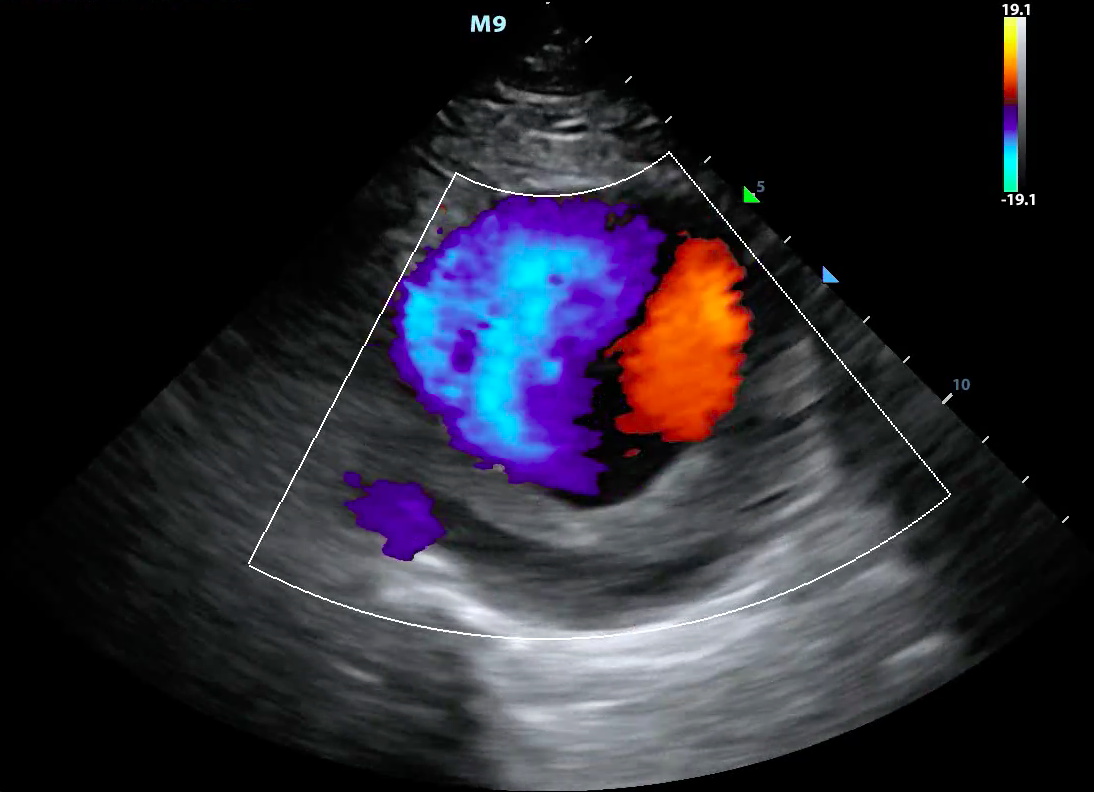
Figure 3. Color doppler showing turbulent blood flow in a large abdominal aortic aneurysm
Video 2. Color doppler showing turbulent blood flow in a large abdominal aortic aneurysm
Power Doppler looks only at the amplitudes of the returning frequency shifts.
It does not examine flow velocity or the direction of flow
This allows for detection of movement in very low flow states (Figure 4)
This is of use when examining vascular emergencies such as testicular or ovarian torsion
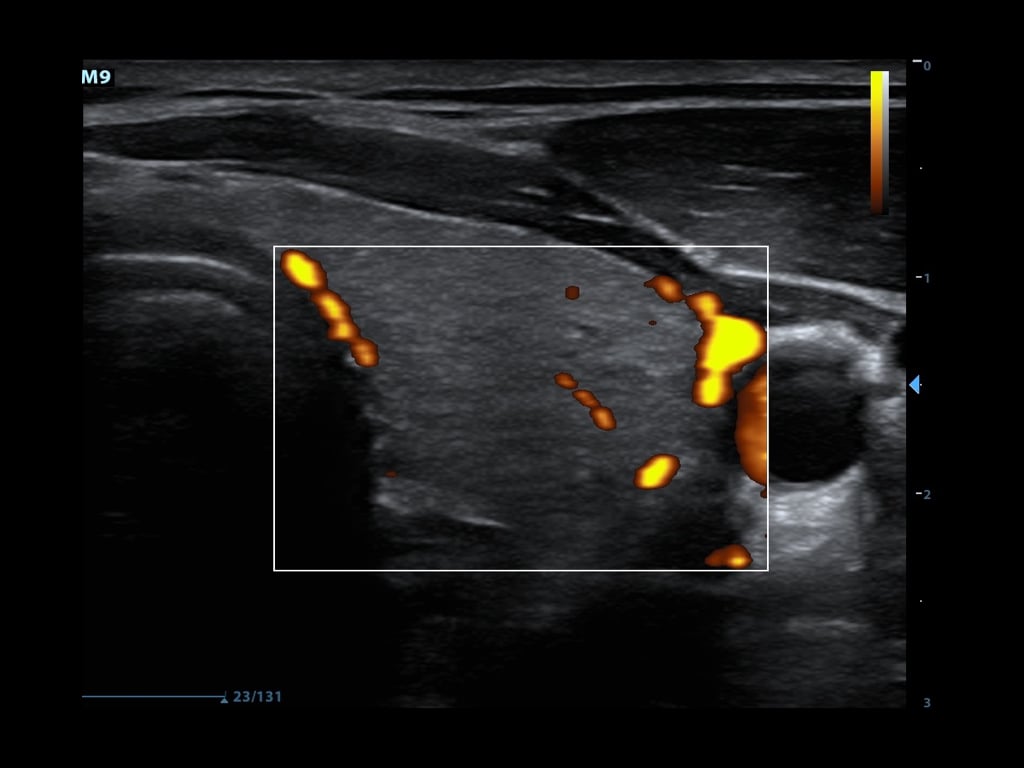
Figure 4. Power doppler showing blood flow in thyroid tissue
Spectral Doppler consists of a continuous and pulsed-wave form
Pulsed-wave spectral Doppler
Transducer sends pulses of ultrasounds to a predetermined depth
Transducer then listens for returning echoes to determine flow velocities at that given location
The “spectrum” of the returned Doppler frequencies are plotted in a characteristic two-dimensional display (Figure 5)
Venous flow demonstrates a more continuous, band like shape
Arterial flow shows a more triangular shape1-8
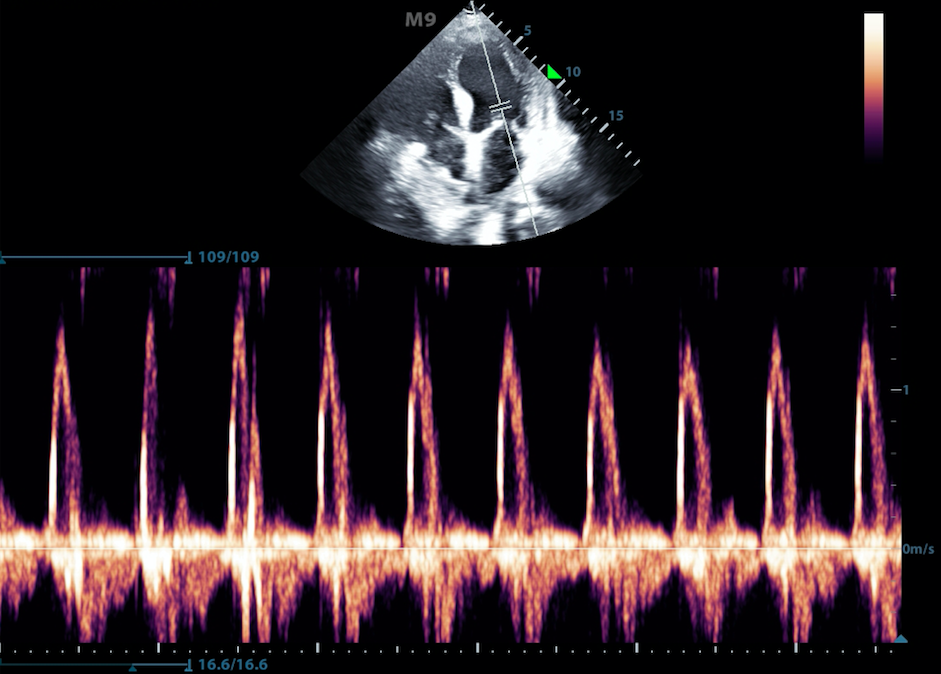
Figure 5. Pulse wave doppler of flow through the mitral valve
Continuous wave Doppler
Transducer continuously sends and receives signals
This allows for detection of very high frequency signals (Figure 6)
Velocities along the entire line of interrogation are measured and not localizable
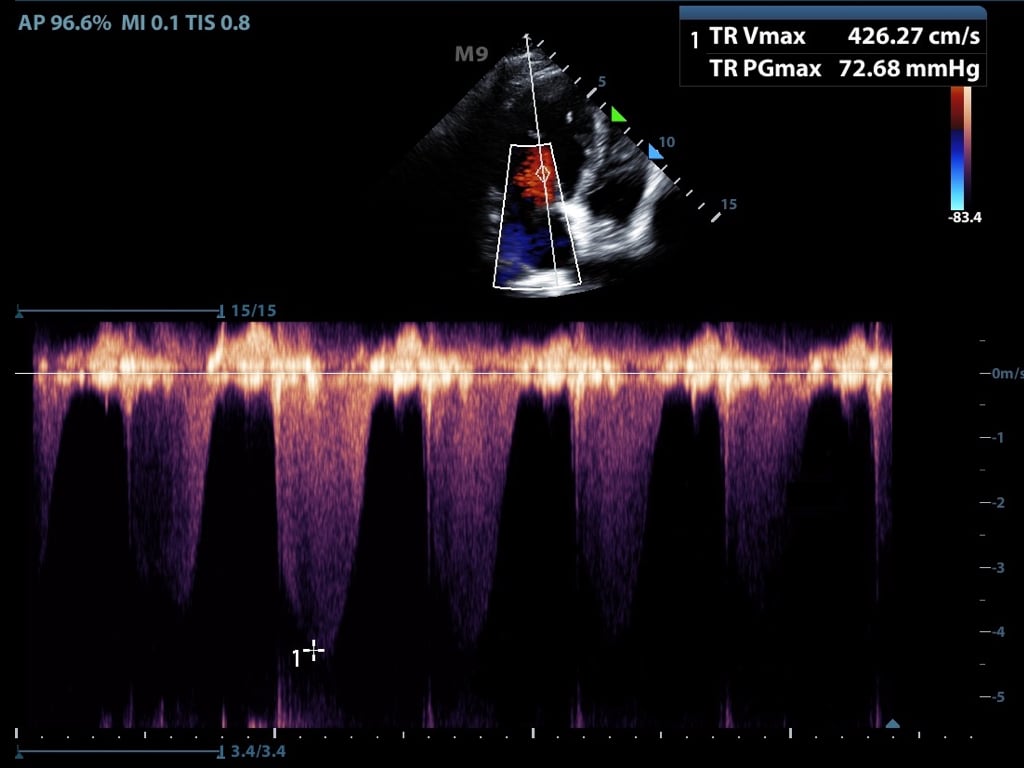
Figure 6. Continuous flow doppler of tricuspid regurgitation
III. Artifacts
Artifacts refer to something the machine depicts on the ultrasound image but does not exist in reality
An artifact can be helpful interpreting the image or it can confuse the interpreter
Several commonly encountered artifacts are mentioned below
Attenuation Artifacts:
Shadowing is caused by partial or total reflection or absorption of the sound energy
A much weaker signal returns from behind a strong reflector (air) or sound-absorbing structure (gallstone, kidney stone, bone) (Figure 7)
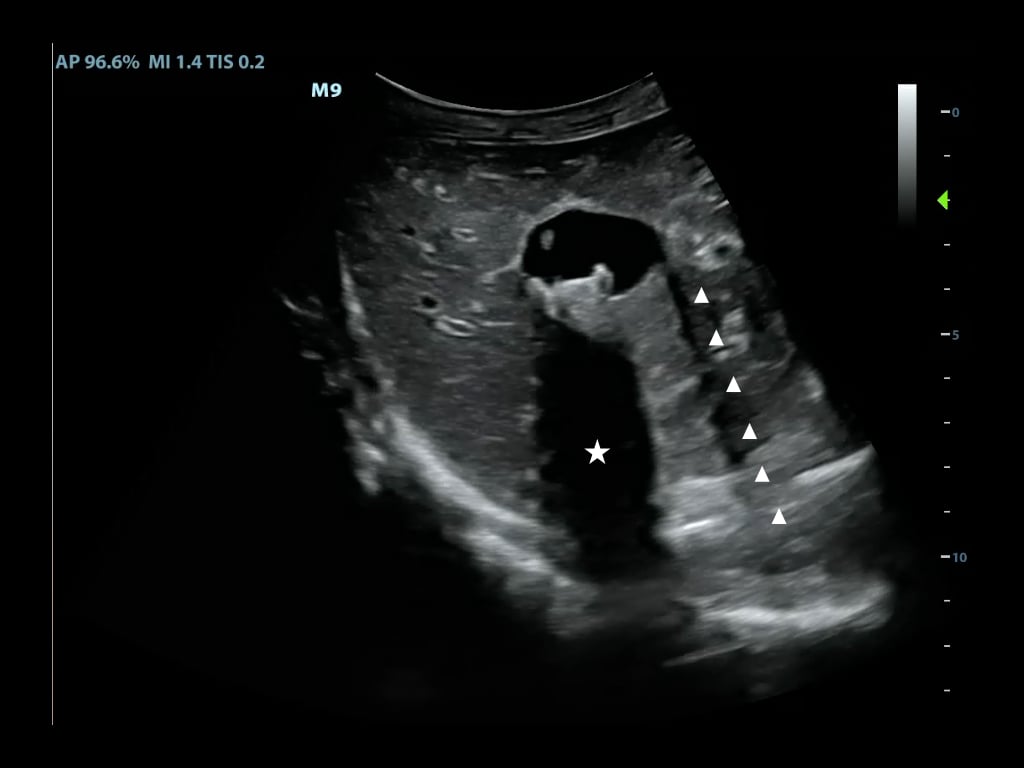
Figure 7. Shadowing from gallstones and edge artifact at lateral wall of gallbladder
Edge Shadowing Artifact is a thin acoustic shadow behind lateral edges of cystic structures
Sound waves encountering a cystic wall or a curved surface at a tangential angle are refracted with few echoes returning to the transducer (Figure 7)
In posterior enhancement, the area behind an echo-weak or echo-free structure appears brighter (more echogenic) than its surrounding structures
Neighboring signals must pass through more attenuating structures and return with comparatively weaker echoes
A common place for this to occur is posterior to the anechoic bladder (Figure 8)
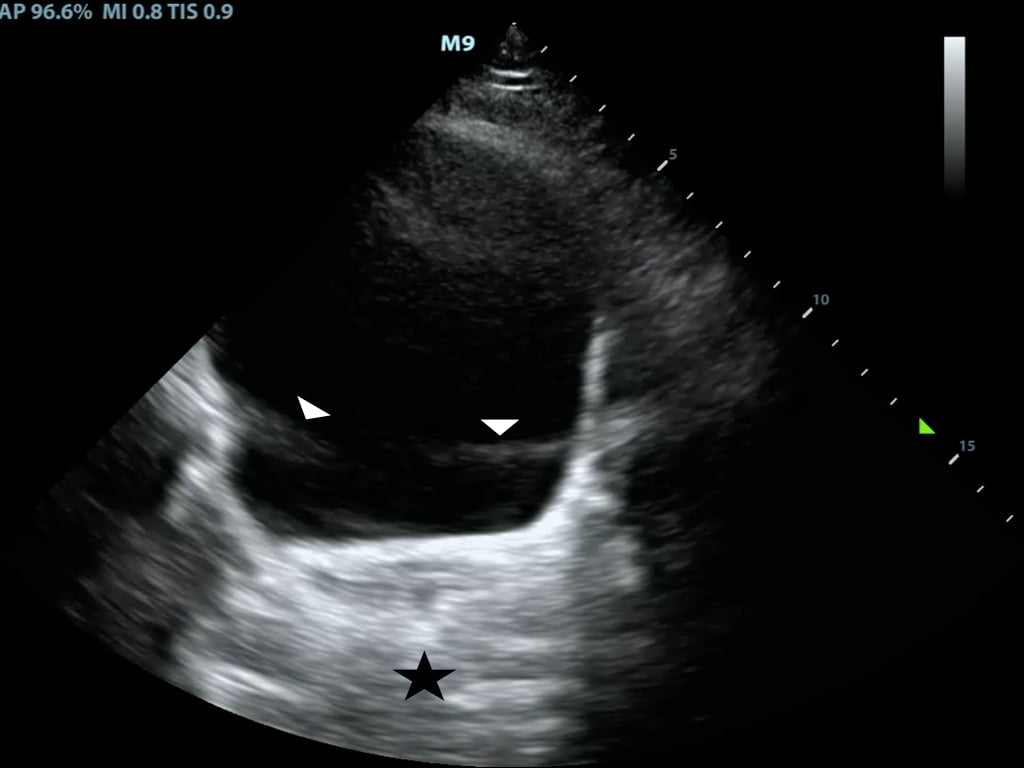
Figure 8. Posterior acoustic enhancement deep to the bladder and side lobe artifact
Propagation Artifacts:
Reverberation occurs when sound encounters two highly reflective layers
The sound is bounced back and forth between the two layers before returning to the transducer
The probe detects prolonged travel time and correlates with a further distance, displaying additional ‘reverberated’ images in a deeper tissue layer (Figure 9)
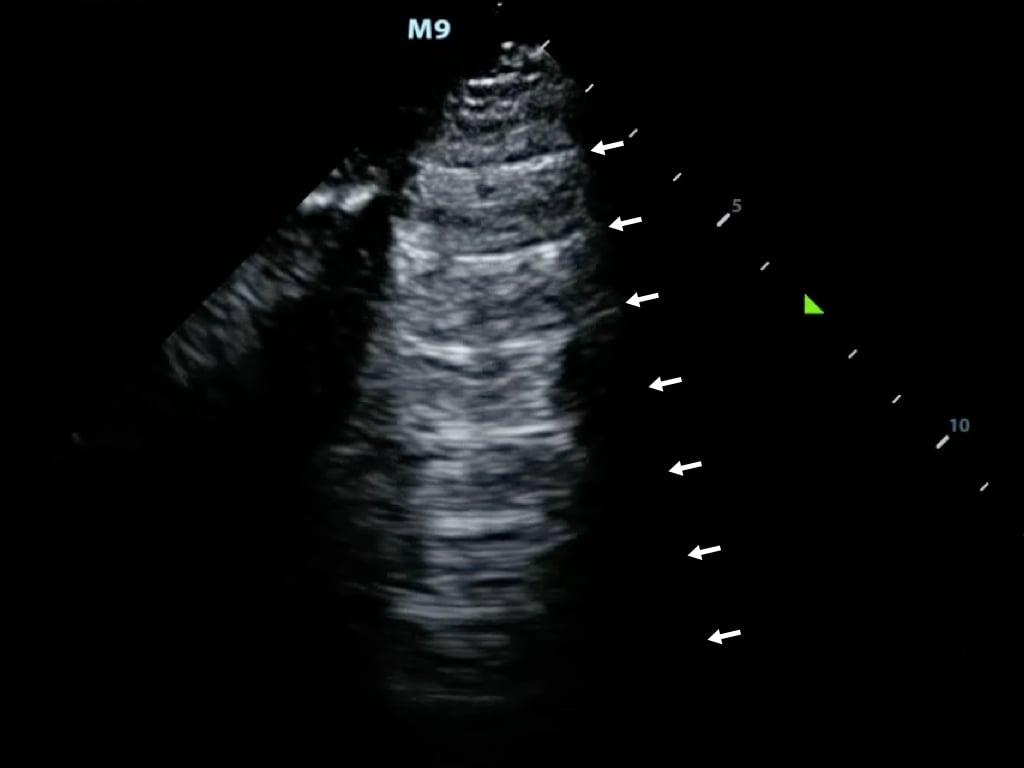
Figure 9. Reverberation artifact from the pleural line
Comet Tail Artifact is similar to reverberation.
It is produced by the front and back of a very strong reflector (air bubble, BB gun pellet)
The reverberations are spaced very narrowly and blend into a small band (Figure 10)
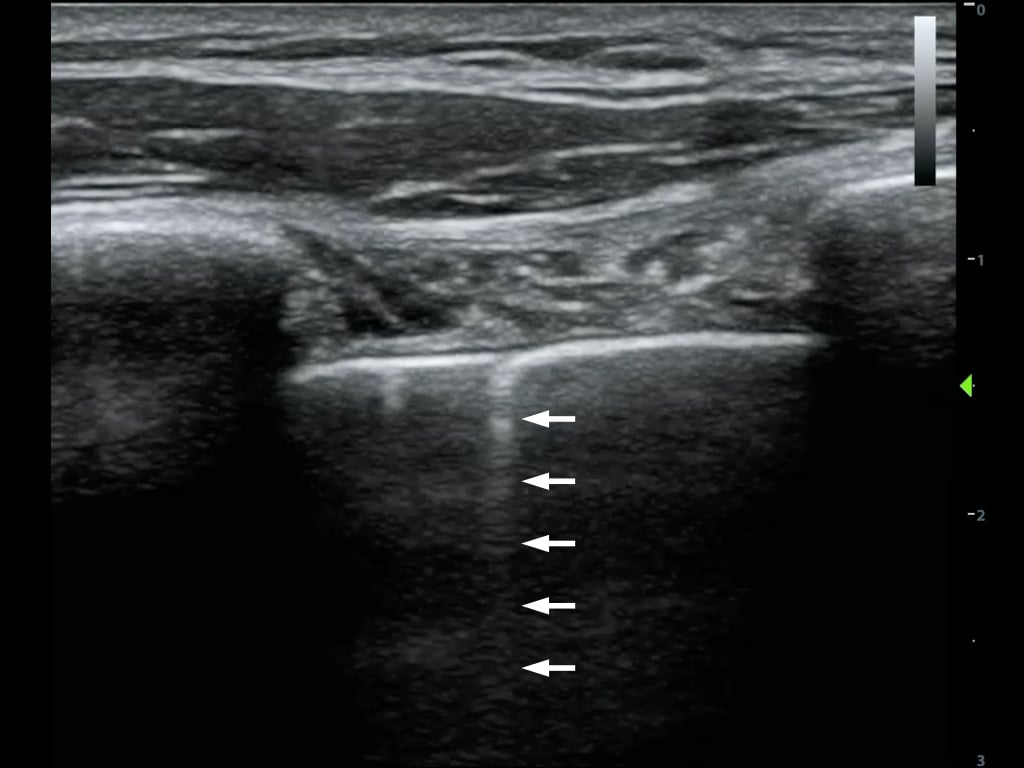
Figure 10. Comet tail artifact from the pleural line
Mirroring is a duplicate image depicted on the opposite side of a strong reflective surface.
Waves reflect off of the strong reflective surface and encounter another structure such as liver tissue
Echoes return towards the strong reflector and finally back to the transducer
These echoes have a longer travel time and are depicted as an additional anatomic structure deep to the strong reflector (Video 3)
Video 3. Mirror artifact of the heart across the pericardium
Miscellaneous Artifacts:
Ring Down artifact is caused by a resonance phenomenon from a collection of gas bubbles
A continuous emission of sound occurs from the ‘resonating’ structure causing a long and uninterrupted echo (Figure 11)
It appears very similar to the comet tail artifact
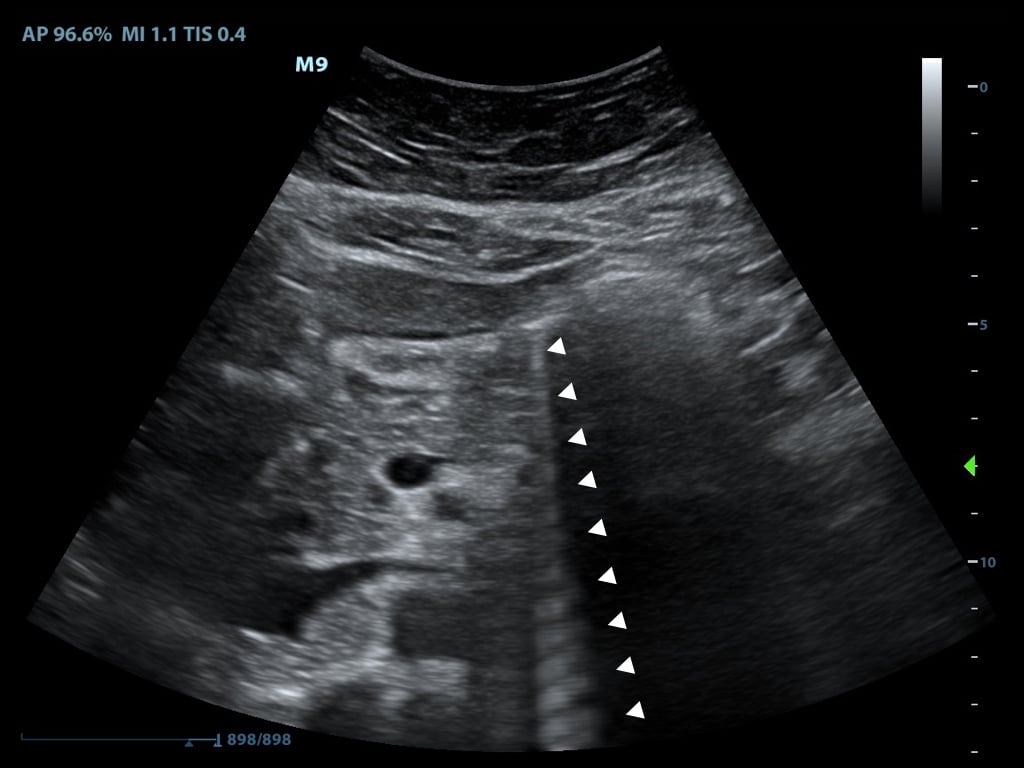
Figure 11. Ring down artifact caused by bowel gas
Side Lobe artifact is caused when low energy ‘side lobes’ of the main ultrasound beam encounter a highly reflective object such as bowel gas
When an echo from such a side lobe beam becomes strong enough and returns to the receiver, it is ‘assigned’ to the main beam and displayed at a false location
Usually seen in hypoechoic or echo-free structures and appear as bright and rounded lines (see Figure 8)
IV. Probes
Transducers consist of the active element (the piezoelectric crystal), damping material and a matching layer
Different arrangements and forms of activation of the active element have led to a variety of probes
The most common transducers utilized in the emergency department are listed below (Figure 12).
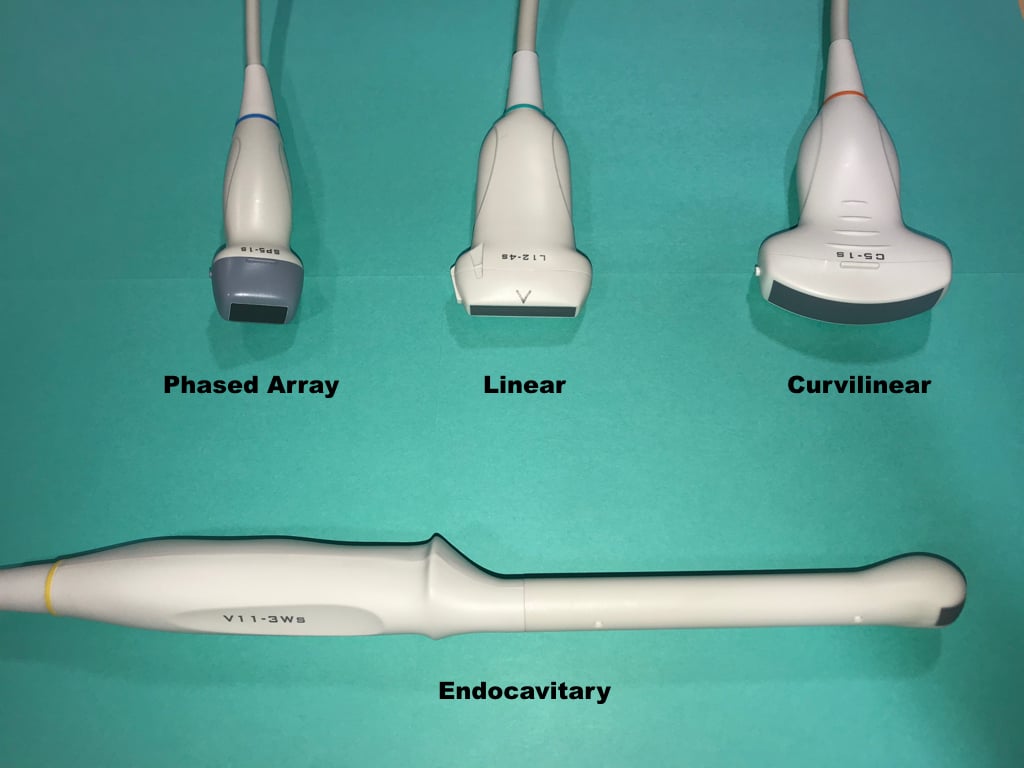
Figure 12. Commonly used ultrasound probes
Curvilinear Probe (Curved Array):
Produces a sector shaped image with a large curved footprint
Low frequency
Main utilization is transabdominal sonography
Phased Array Probe:
Sector shaped image with a smaller footprint, ideal for use between ribs
Low frequency
Main utilization is cardiac and transabdominal sonography
Linear Probe:
Produces a rectangular image with a straight flat footprint
High frequency
Main utilization is vascular sonography, procedural guidance or evaluation of superficial soft tissue structures
Endocavitary Probe:
Small curved footprint
Medium frequency
Main utilization is endovaginal or intraoral sonography
V. Image Acquisition / Probe Positions:9
Transverse Plane (axial plane or cross-sectional) – In the supine patient, runs perpendicular to the ground
Separates superior from inferior, or head from feet
Sagittal Plane – In the supine patient, runs perpendicular to the ground
Separates left from right
Coronal Plane (frontal plane) – In the supine patient, runs parallel to the ground
Separates anterior from posterior or front from back (Illustration 3)
Oblique Plane - The probe is oriented neither parallel to, nor at right angles from, coronal, sagittal or transverse planes
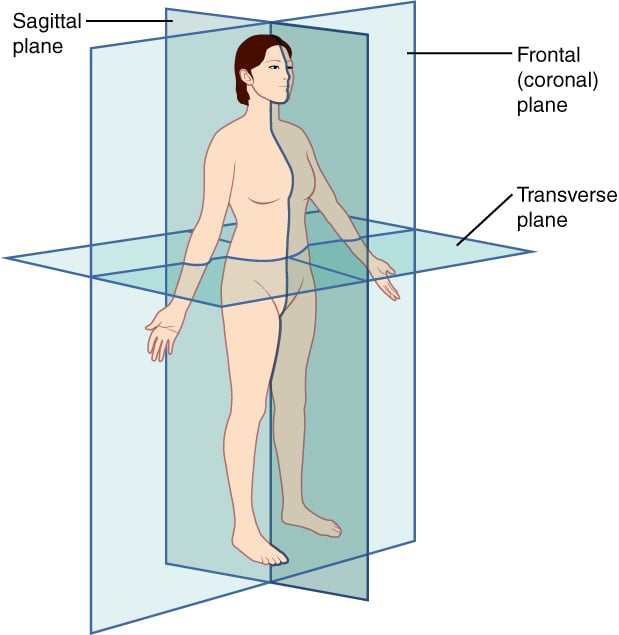
Illustration 3. Spatial orientation and imaging planes (Credit: https://commons.wikimedia.org/wiki/File:Planes_of_Body.jpg)
Probe manipulation:
Slide – Movement of the probe in the long axis along the surface of the body
The probe remains perpendicular to the target
Sweep – Movement of the probe in the short axis along the surface of the body
The probe remains perpendicular to the target
Rock – Movement of the probe along its long axis without changing the point of contact between the probe and the surface of the body
Fan – Movement of the probe along its short axis without changing the point of contact between the probe and the surface of the body
Pressure/compression – Movement of the probe into the surface of the body
Footprint maintains contact with the surface of the body and the probe remains perpendicular to the target
Rotate – Movement of the probe clockwise or counterclockwise
Footprint maintains contact with the surface of the body and the probe remains perpendicular to the target
VI. Ultrasound Machine Functions
This section lists several basic ultrasound machine functions
They are more or less universal to all ultrasound equipment
Information is kept as general as possible to make it applicable to most machines
On/Off – Powers the machine on or off
Sleep mode also available on many machines
Select/Change Probes - Selects a specific probe
Often allows selection of exam type as well
Freeze – Freezes the current image
Scroll - Moves the cursor within the image or navigates through menus (typically a touch pad or track ball)
After freezing an image, moving the scroll ball will cycle through the last few seconds of imaging (these images are called cine-loops)
Gain - Changes overall strength of returning echoes, functions as an amplifier, making the image brighter or darker
Lower gain until fluid filled structures appear anechoic (Video 4)
Video 4. Optimizing gain
Time Gain Compensation (TGC) - Changes strength of returning echoes at various depths to help make the entire ultrasound image uniform brightness
Depth Adjustment - Increases or decreases the depth of the ultrasound beam
Save - Saves an image or clip to the hard drive
Change Mode - Pushing the M-mode button will change the machine to M-mode, Doppler button to Doppler mode, color Doppler to color, etc.
Most machines are set up so that a “dual” screen appears when certain modes are selected (B-Mode combined with Doppler or M-Mode) (See Video 1)
Focus - Will change or add focal zones to the image, helping improve the image quality at a specific depth