Introduction to the business cycle
Economic activity
A country’s potential GDP is the level of GDP that can be produced when the economy is at full employment or full capacity.
This occurs when the unemployment rate is close to 4% (i.e. the ‘natural’ rate of unemployment).
A country’s potential GDP will normally grow over time at a steady state due to:
•Population growth
•Increase in the factors of production
•Improvements in the quality of resources (i.e., an increase in productivity).
This rate is around 3% per year
Actual GDP however can change in an unpredictable and irregular fashion (i.e., volatile) – it can surge and it other times is slows or even fall.
The subject matter of macroeconomics is concerned with understanding why the level of economic activity fluctuates over time.
Economic activity can be measured in a number of ways (e.g., production, employment and national income).
The main economic indicator is real GDP – measure of the value of final goods and services produced in the economy over a period od time.
For the whole 2022-23 financial year, Australia’s real GDP was $2 230 billion.
The figure shows the level of quarterly real GDP over the past 30 years.
The trend for the period is relatively smooth and linear – this shows a fairly consistent upward trend
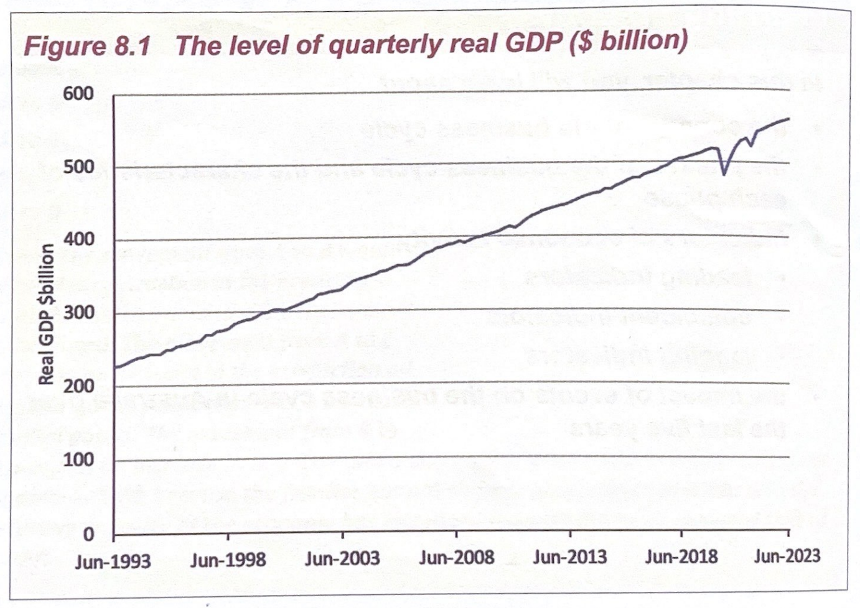
The average growth rate is around 3%.
Notice the anomaly in the trend – 2020-2021.
The Covid pandemic caused the economy to shut down and disrupted the smooth linear trend – it caused Australia to go into a recession (first in 29 years)
•Recession
•Two successive falls in quarterly real GDP
The economy recovered in 2022 and therefore the upward growth trend resumed.
The Covid pandemic is an example of a large negative macroeconomic shock that disrupted the growth trend.
Another is the GFC however Australia did not experience its effects due to economic management of the government (but in other countries you would also see a downturn in GDP).
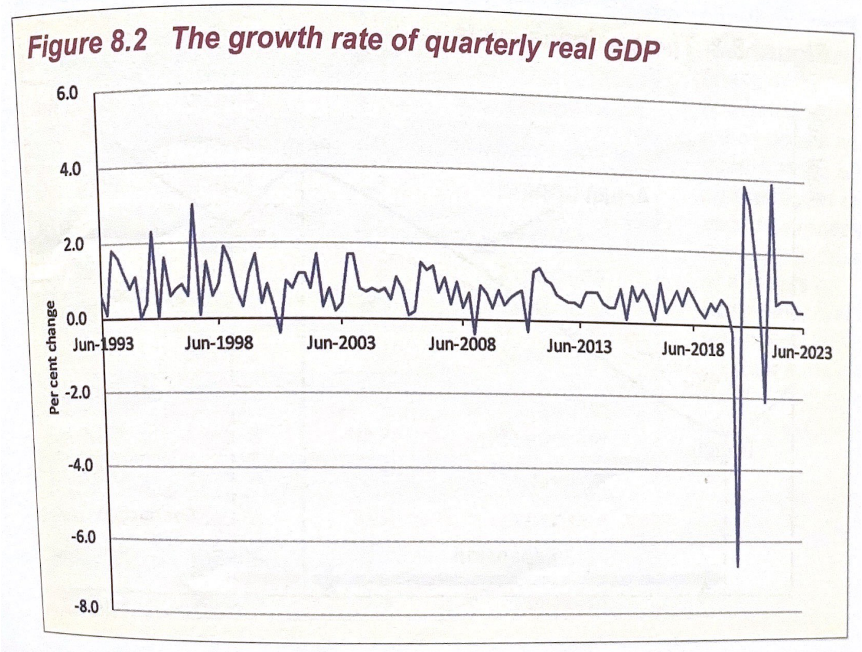
This figure shows the percentage growth rate of quarterly real GDP over the same 30-year period as the previous figure.
Different terminology would be used to describe this figure as it shows the fluctuations in real GDP that occur – quarterly GDP does not change at a constant rate.
The ‘normal’ quarterly growth rate for Australia is around 0.7%-0.8% - this equates to an annual growth rate of around 3% (four quarters in a year).
The fluctuations occur as real GDP is affected by the many shocks that can hit the economy.
•Positive: stronger economic growth
•Negative: weaker economic growth or negative growth
The Business Cycle
The business cycle refers to the fluctuations in economic activity around a long-term growth pattern.
The concept of it is to refer to expansions and contractions in economic activity that occurs around the long-term growth rate.
Typically, the business cycle is described as having 4 phases through which the economy travels:
Expansion
peak (upper turning point)
Contraction
Trough (lower turning point)
One business cycle is measured as the period of time between two troughs (or two peaks)
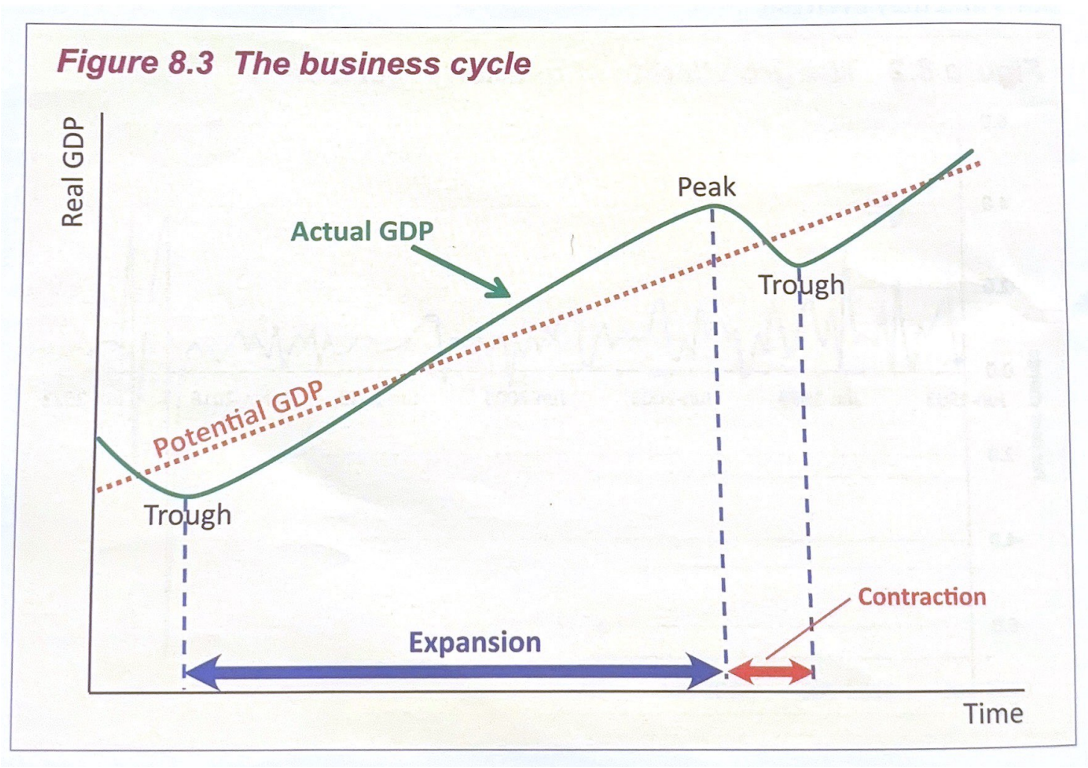
If actual GDP is above potential GDP, then the economy experiences a positive output gap and the unemployment rate will fall below 4%.
If actual GDP is below potential GDP then the economy experiences a negative output gap and the unemployment rate will rise above 4%.
Most of the time the economy will be in an expansion.
Expansions are typically much longer (e.g., up to 10 years) than a contraction (typically one or two quarters).
Overall – the business cycle can be measured by:
•Measuring the change in the level of real GDP over time
•Measuring the growth rate of real GDP over time
Australia and the Business Cycle
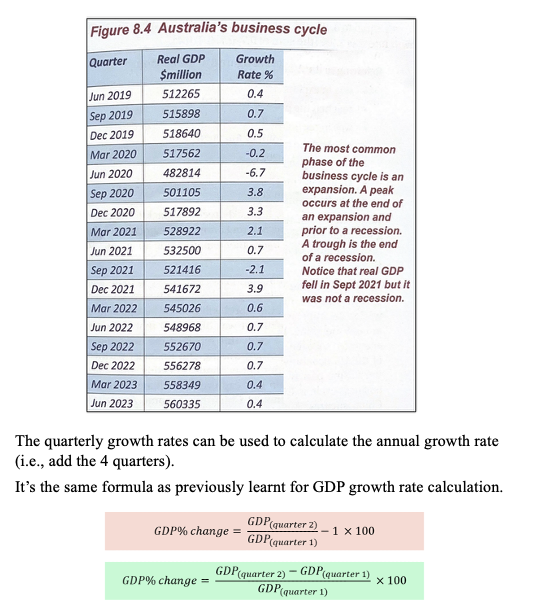
An expansion can be shown by either an increase in the level of real GDP or by a positive growth rate.
A contraction can be shown by either a fall in the level of real GDP or a negative growth rate.
IMPORTANT
A fall in the growth rate is not necessarily a contraction - real GDP can still be increasing but at a slower rate.
So long as the growth rate is positive then it is still part of an expansion.
It is only when the growth rate is negative that it is a contraction.
The International Business Cycle
All economies are subject to the cyclical fluctuations in economic activity and growth – this is especially true in the globalised and interconnected world that currently exists.
The impact of events in one part of the world will quickly transfer around the globe – this can be seen when looking at the GFC.
The US economy is one of high importance to Australia and therefore any fluctuations in the US economy is felt by Australia.
However, the most important economy now to Australia is China’s economy – it is Australia’s more important export and import partner, dominating Australia’s trade flows
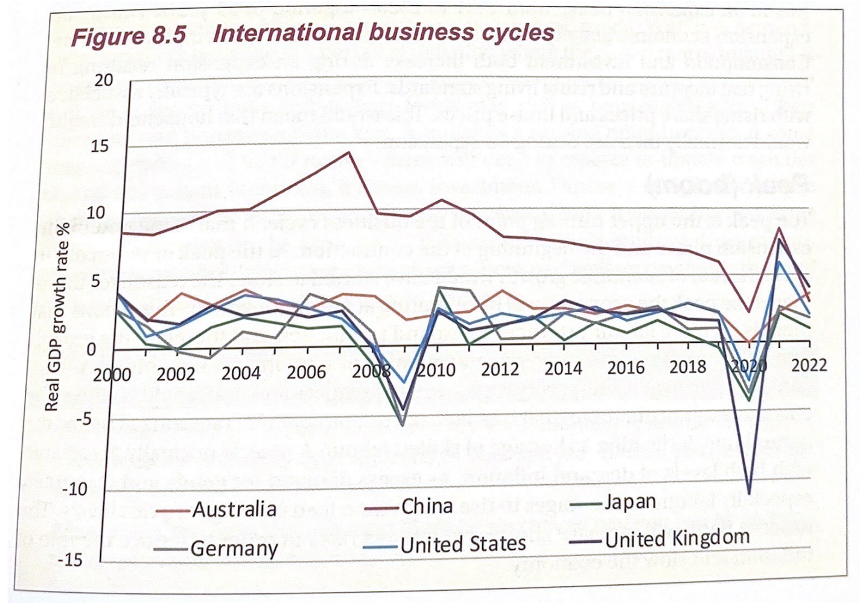
The figure shows the annual change in real GDP for 6 economies between 2000 and 2022.
There is a close correlation between each country’s business cycle – the rises and galls in the growth rates are closely linked.
Notice that 4 out of the 6 economies went into recession during the GFC – China and Australia suffered a slow down in economic activity but did not go into a recession.
All economies other than China experienced another recession in 2020 due to Covid
The main reason why the business cycle correlation occurs is because most economies are subject to the same global shocks.
For example, an increase in world oil prices will affect all economies and lead to a rise in cost inflation and a slowdown in economic growth.
Each country’s business cycle can be divided into two parts:
The global component
•This captures the common movements in all country’s business cycles and is particularly influenced by trade and foreign investment flows
A country component
•This captures the movements in the business cycle that are unique to the individual country (e.g., drought)