Untitled
Neurotrophic Factors
Neurotrophic factors are small secreted proteins expressed in target tissues of peripheral sensory and autonomic neurons, and sometimes by neurons in peripheral ganglia.
They bind to cell surface receptors to modulate:
Neuronal differentiation
Neuronal survival
Axon growth and branching and target field innervation
Neuronal maturation (regulation of expression of functionally important proteins)
In the developing nervous system:
Peripheral target field
CNS central target field
Ganglion (sensory neurons)
Modes of Action of Neurotrophic Factors
Target field-derived neurotrophic factors exert trophic effects on neurons via retrograde transport to the nucleus.
Neurotrophic factor receptors are expressed on axon terminals in the target field.
Neurotrophic factors bind to and activate their receptors.
Neurotrophic factor/activated receptor complexes are endocytosed into signaling endosomes.
Signaling endosomes are retrogradely transported by a dynein-mediated microtubule-based mechanism to the nucleus.
This leads to altered transcription of mRNAs encoding functionally important proteins.
Paracrine and Autocrine Signaling
Neurotrophic factors produced by neurons within ganglia exert trophic effects via paracrine or autocrine signaling.
Paracrine: Neurotrophic factors synthesized and released by one neuron bind to receptors on other neurons to exert trophic effects.
Autocrine: Neurotrophic factors synthesized and released by one neuron bind to receptors on the same neuron to exert trophic effects.
Neurotrophins
The neurotrophin family includes:
NGF (Nerve Growth Factor): binds to tyrosine kinase receptor TrkA.
BDNF (Brain Derived Neurotrophic Factor): binds to tyrosine kinase receptor TrkB.
NT-3 (Neurotrophin-3): binds to tyrosine kinase receptor TrkC.
NT-4 (Neurotrophin-4): binds to tyrosine kinase receptor TrkB.
All 4 neurotrophins also bind to the common neurotrophin receptor p75NTR.
Neurotrophins promote the survival, target field innervation, and maturation of developing sensory and sympathetic neurons.
Developing dorsal root (DRG) and trigeminal sensory ganglia contain neuron populations that require either NGF, BDNF, or NT-3 for survival and target field innervation.
of developing sympathetic neurons of the Superior Cervical Ganglion (SCG) require NGF for survival and target field innervation.
Other Neurotrophic Factors
TNF (Tumour Necrosis Factor) superfamily:
Includes 19 members initially characterized as immune system modulators with neurotrophic actions on post-mitotic neurons.
Examples: GITRL (Glucocorticoid-induced TNFR ligand), RANKL (RANK ligand), CD40L (CD40 ligand), TNF (Tumor Necrosis Factor), TWE-PRIL (an APRIL/TWEAK hybrid).
IL-6 related cytokines.
Fibroblast growth factors (FGF’s).
TGF- (transforming growth factor-) superfamily.
GDNF (glial cell-derived neurotropic factor) family.
Neuregulins.
TNF family members modify the actions of Neurotrophins on developing neurons.
Determining Trophic Effects
Promoting neuronal survival:
In vitro: Low-density neuronal cultures from WT or transgenic mice +/- neurotrophic factors.
In vivo: Comparison of neuron numbers in sympathetic and sensory ganglia from WT and transgenic animals (null-mutants of neurotrophic factors and/or their receptors).
Promoting axon growth and branching and target field innervation:
In vitro: Low-density neuronal cultures from WT or transgenic mice +/- neurotrophic factors. Process length and degree of branching is determined by Sholl analysis.
In vivo: Immunohistochemistry using antibodies against axon-associated proteins. Comparison of target field innervation density in WT and transgenic animals (null-mutants of neurotrophic factors and/or their receptors).
Regulating the expression of mRNAs encoding functionally important proteins:
In vitro: RT-QPCR of RNA extracted from neuronal cultures established from WT and transgenic mice +/- neurotrophic factors.
In vivo: RT-QPCR of RNA extracted from peripheral ganglia dissected from WT and transgenic mice.
Assessing Neuronal Survival In Vitro
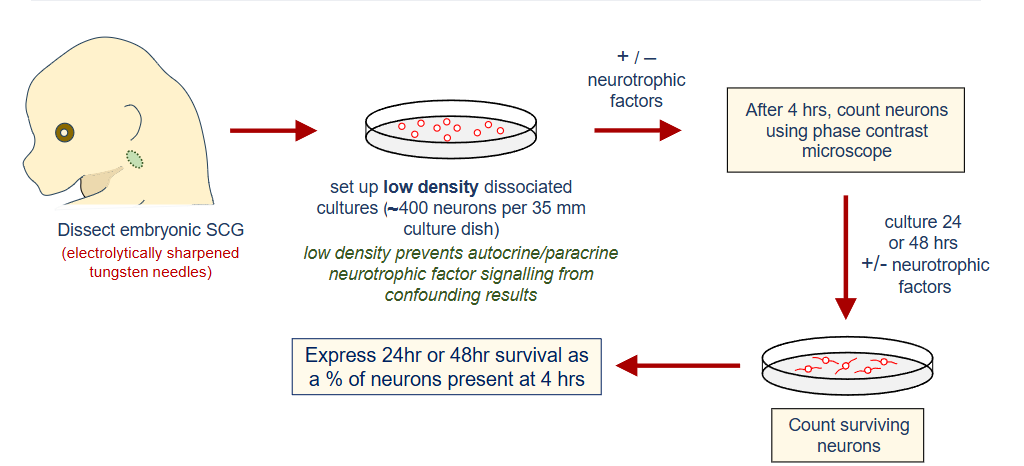
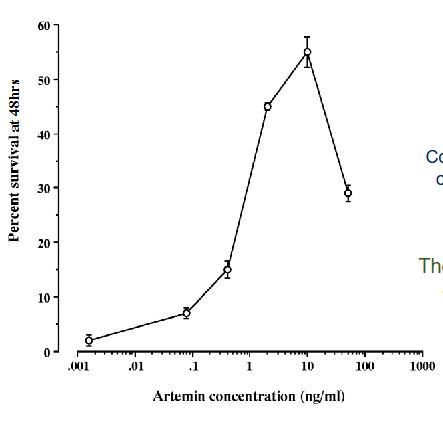
Example: Artemin and SCG Neuron Survival
Artemin supports the in vitro survival of embryonic day 14 (E14) SCG neurons in a dose-dependent manner (Andres et al., 2001).
To determine physiological relevance:
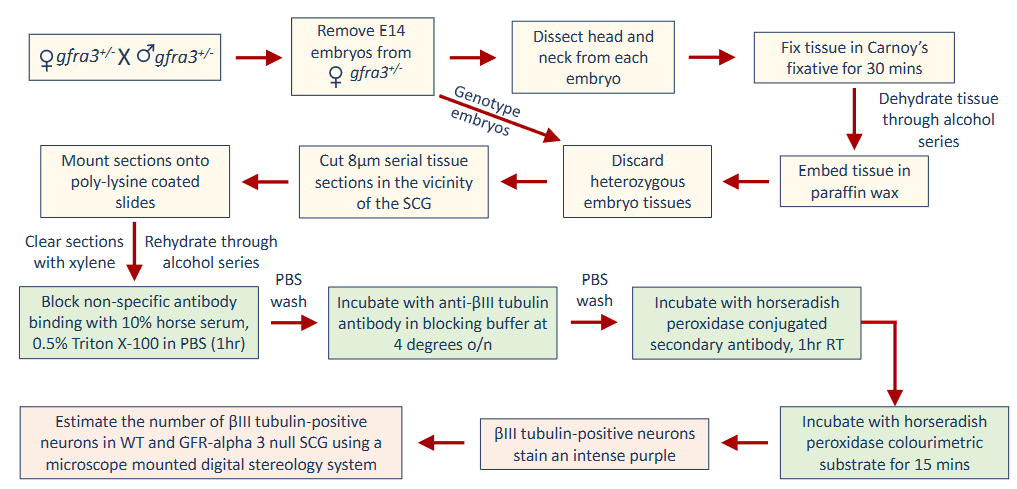
Compare neuron number between the SCG of E14 WT and either artemin or artemin receptor null-mutant mouse embryos.
The protein GFR-alpha 3 is an essential component of the artemin receptor.
Determining Neuron Number in SCG
Results of SCG Neuron Number Experiment
E14 SCG’s from GFR-alpha 3 null-mutant embryos have fewer neurons than WT SCG’s (Andres et al., 2001).
WT n = 6, GFR\alpha3-/- n = 5
p< 0.01 t-test
Sections were also stained for proliferating cell nuclear antigen (PCNA) to determine neuroblast numbers in SCG (-III tubulin +ve/PCNA +ve cells).
p< 0.01 t-test
SCG from GFR\alpha3-/- embryos have 50% less neuroblasts than WT SCG.
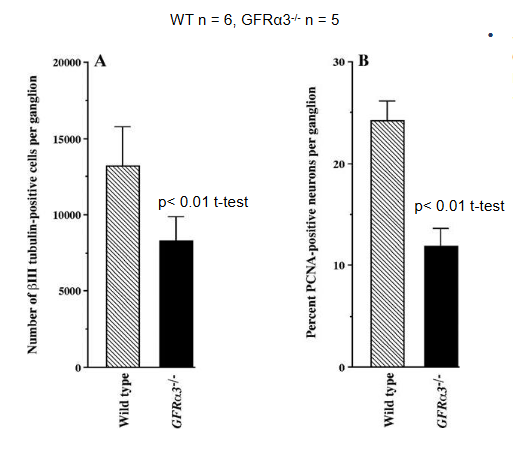
This suggests a significant role for GFR\alpha3 in the regulation of neuroblast proliferation during development. Furthermore, the reduction in neuroblast numbers could indicate that GFR\alpha3 is crucial for both the maintenance and differentiation of progenitor cells within the sympathetic ganglia.
Artemin enhances sympathetic neuroblast proliferation and promotes the survival of early sympathetic neurons in vivo.
Quantification of Neurite Length and Complexity
Dissect SCG from mouse embryos/neonates.
Set up low-density dissociated cultures.
Culture 24 hr +/- neurotrophic factors.
Fluorescently label neurons (Calcein AM).
Image neurons using a fluorescence microscope.
Use data on the position of neurite terminals and branch-points to quantify total neurite length and the number of branch-points.
Sholl analysis.
Sholl plots are a graphical representation of neuron complexity.
Example: ProNGF and SCG Neurons
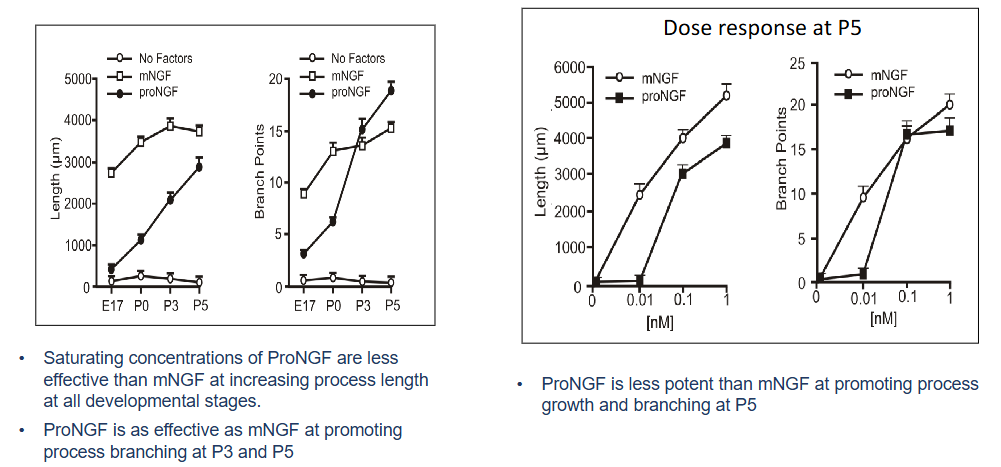
ProNGF promotes process outgrowth and branching from embryonic and postnatal SCG neurons in vitro (Howard et al., 2013).
Sholl plots – remember the larger the area under the plot, the more complex process outgrowth from neurons is.
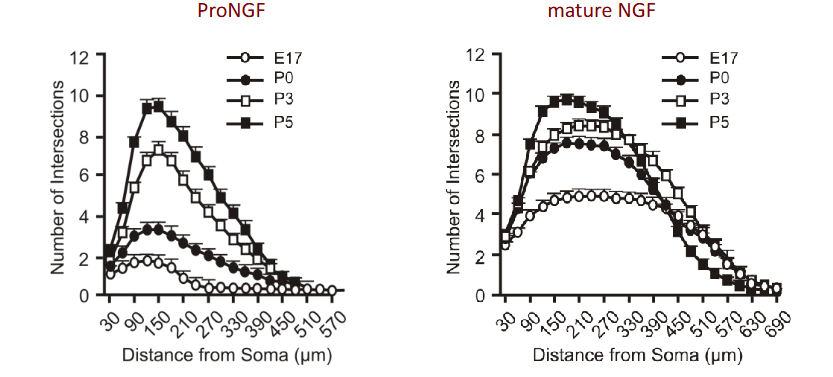
ProNGF vs mNGF
Example 2: CD40L and DRG Sensory Neurons
The TNF superfamily member CD40L promotes axon growth from early embryonic DRG sensory neurons (Howard et al, 2019).
Early embryonic DRG neurons are bipolar in culture and are not amenable to Sholl analysis (Fiji software plugin used instead to trace axons).
CD40L maximally promotes axon growth at E12; it has no effect by E15.
NGF-promoted axon growth from E12 CD40 null-mutant DRG neurons is reduced compared to WT neurons.
Suggests CD40L/CD40 autocrine signaling loop is operating in WT to enhance NGF-promoted growth.
Determining Physiological Relevance of Axon Growth Data
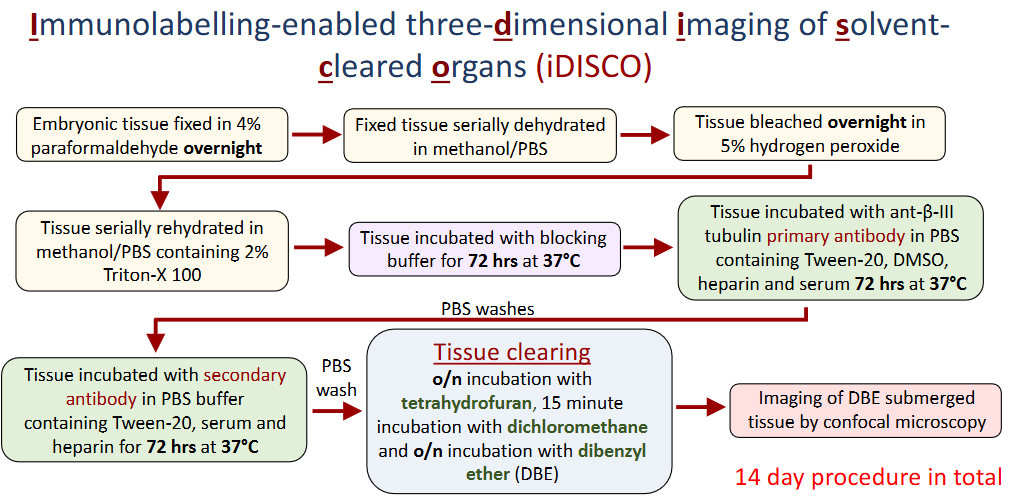
Example: CD40 Null-Mutant Embryos
E12 and E13 CD40 null-mutant embryos have reduced innervation by DRG neuron axons compared to WT embryos.
Length of thoracic spinal nerves (arrows) are significantly reduced in CD40 null-mutant embryos compared to WT at E12 and E13.
Hindlimb innervation density is significantly reduced in CD40 null-mutant embryos compared to WT at E12 and E13.
No difference in the number of L4 DRG neurons between genotypes
*= p<0.01, **= p<0.001, *** = p<0.0001 one-way ANOVA with Bonferroni post-hoc
Using RT-QPCR
Extract and purify RNA from either neuronal cultures or from ganglia dissected from WT and/or transgenic mouse embryos.
Reverse transcribe RNA into cDNA.
Amplify cDNA by QPCR.
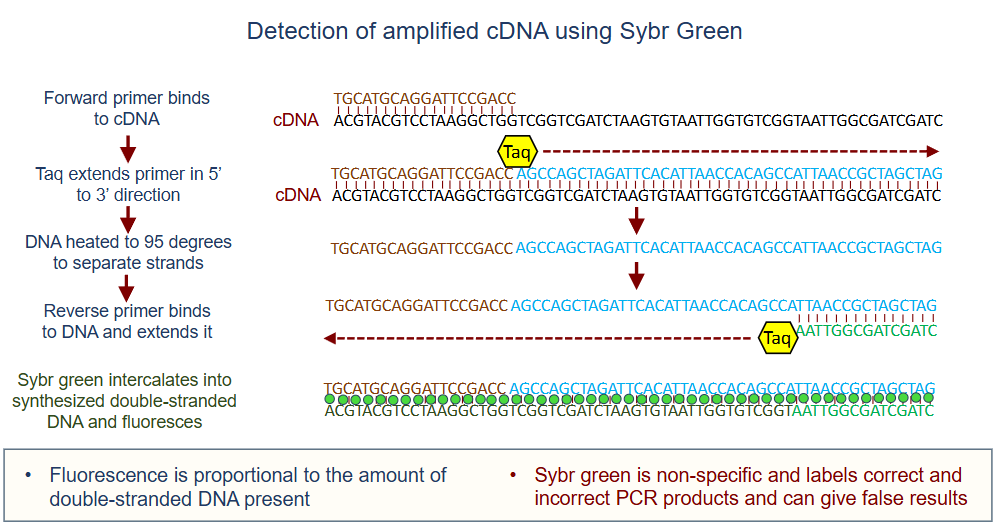
QPCR measures an increase in fluorescence generated when DNA is amplified in the exponential phase.
The amount of DNA generated is proportional to the fluorescence level in the exponential phase of the QPCR, and the fluorescence level is proportional to the starting amount of cDNA.
A threshold fluorescence level is set.
The cycle number when the fluorescence plot crosses the threshold is recorded (Ct value).
The Ct value is proportional to the original amount of cDNA.
The higher the original amount of cDNA, the lower the Ct value.
Detecting DNA Amount in QPCR
Quantifying Gene Expression Changes
It is important to quantify changes in the expression of the “target” gene relative to the levels of genes whose expression is constant (reference genes).
Best practice is to use at least 3 reference genes and quantify the levels of the “target” gene relative to a geometric mean of the 3 reference genes.
Standard curves comprising serial 5-fold dilutions of cDNA synthesized from concentrated mouse brain RNA are used to assign values for expression levels to each “target” gene and reference gene in every experimental cDNA sample.
Using standard curves for each primer/probe set (gene) makes allowances for the fact that not all primer/probe sets amplify with the same efficiency.
This method is more accurate than the traditional method used to quantify changes in gene expression detected by QPCR.
Example: NGF and CD40 Receptor Expression
NGF is a negative regulator of CD40 receptor expression in postnatal mouse SCG neurons (McWillams et al 2015).
NGF downregulates the expression of Cd40 mRNA in a dose-dependent manner in cultures of mouse P3 SCG neurons (48hr cultures Time course expt.).
In the absence of NGF, Cd40 mRNA expression increases 13-fold over 48hrs in culture.
In the presence of 10ng/ml NGF, Cd40 mRNA expression decreases 5-fold over 48hrs in culture.