Chapters 1 - 2: Specify the Question and Obtain Data
Vocabulary
Business Value: All the items, events, and interactions that determine a company’s financial health. Common measure is long-term profitability
Business Process: A coordinated, standardized set of activities conducted by both people and equipment to accomplish a specific business task.
Business Analyst: A data specialist who curates and uses data to help an organization make effective business decisions.
Data Overload: Access or exposure to too much data; prevents data from being properly synthesized and interpreted.
Analytics Mindset: The willingness and ability to specify which questions need to be addressed, find and extract pertinent data that might address those questions, analyze those data, and then report the results of business analytics to decision-makers.
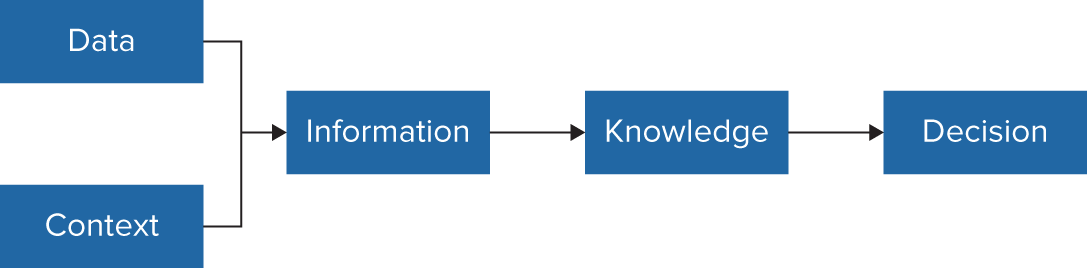
Data: Raw numbers and facts that have little meaning on their own
Information: Data organized in a way that is meaningful to the user in context; data with context
Context: Setting, event, statement, or situation in which data can become more fully understood and evaluated
Information Value Chain: The events and processes from the collection of data to the compilation of information to an ultimate business decision.
Knowledge: Understanding or familiarity with information gained through learning
Decisions: Conclusions reached after consideration of knowledge gained
Data Scientist: Data Specialist who knows how to work with, manipulate, and statistically test data
Business Analytics: Use of data to make knowledge, draw conclusions, and address business questions
Marketing Analytics: Use of business analytics to measure and improve marketing performance
Financial Analytics: Use of business analytics to help a company measure, evaluate, and improve its financial performance
Operations Analytics: Use of business analytics to measure and improve the efficiency and effectiveness of the company’s operations
Accounting Analytics: Use of business analytics to evaluate financial performance and to address accounting questions
Relevant Data: Data directly or closely connected to the question being asked
Reliable Data: Facts or truth with little or no bias
Data Integrity: Combined accuracy, validity, and consistency of data stored and used over time
Static Report: Not a constantly updated report of results
Dynamic Report: Real-time updating report delivered through a dashboard
Data Visualizations: Graphical representations of data that can reveal patterns in data and communicate findings
Exploratory Visualizations: Graphical representation that uncovers patterns in data as part of descriptive or diagnostic analytics
Enterprise System: Business management software that integrates applications from throughout the business into one system
Relational databases: Compile data into separate tables to ensure data is complete and not redundant. Composed of tables, fields, and records. Primary and foreign keys relate tables of data to each other, as well as allow for better security/ access protection and make updates easier.
Big Data: Data sets that are too large and complex for businesses’ existing systems to capture, store, manage, and analyze. Focuses on the four aspects of volume, velocity, variety, and veracity.
Structured data: Organized data that fits neatly in a table or database
Unstructured data: Data without organization
Semi-structured data: No internal structure, but may have tags or markers that explain what the data represent
Internet of Things: A network of physical objects, such as cars and watches, that have sensors connecting them to the internet and allowing for the exchange of data.
Data warehouse: A repository that allows a large amount of structured data to be integrated for reporting and data analysis.
Data lake: A repository for a large amount of both structured and unstructured data (internal and external) to be integrated for reporting and data analysis.
OLAP (Online Analytical Processing): Computing method that enables users to easily and selectively extract and query data for analysis from different points of view. All possible combinations are pre-calculated
Distributed Computing: Data stored across multiple databases
Raw Data: Data that has not been processed, cleaned, or aggregated
Aggregated Data: Individual data points combined into subtotals (counts, sums, averages)
Categorical Data: Categorize into groups represented by labels
Nominal Data: Categorical data that cannot be ranked but are instead summarized through counting, grouping, or proportion
Ordinal Data: Categorical data that can be ranked and sorted and can also be summarized through counting, grouping, or proportion
Numerical Data: Meaningful numbers that represent quantities
Interval Data: No meaningful zero
Ratio Data: The zero value is meaningful, so ratios can be calculated. Most numerical data is ratio data
Data Completeness: Data to analyze is fully extracted from original source
Data Integrity: None of the data was manipulated or tampered with during extraction
Concepts
There is a lot of data available now.
This can be good because it can offer valuable insights
This can be bad because it can result in data overload
Business Analysts are uniquely positioned to perform analysis because they
Understand the questions that a business is asking
Understand the nature and quality of the business’s data
Can act as a intermediary between management and data scientists, helping data scientists to understand the business needs and helping the business to understand the conclusions of the data scientist
The SOAR analytics model is useful for remembering the analytics mindset
Specify the question
More succinct and specific questions are better
Obtain the Data
Use relevant and reliable data
Obtain data ethically
Analyze the Data
Descriptive analytics
Diagnostic analytics
Predictive analytics
Prescriptive analytics
Adaptive/autonomous analytics
Report the Results
Report the results back to decision makers
Relational Databases:

Data lakes are better than warehouses because of their ability to store unstructured data, but warehouses are better in that they are less likely to result in data overload
Data formats for analysis
Text Data is best for unstructured, text-based data
Tabular Data is best for structured data
Preparing Data for Analysis
Ensure Data Quality
Validate Data for Completeness and Integrity
Cleanse the Data
Trim functions remove white space (except single spaces between words)
Clean functions remove nonprintable characters (except white spaces)
Perform Preliminary Exploratory Analysis